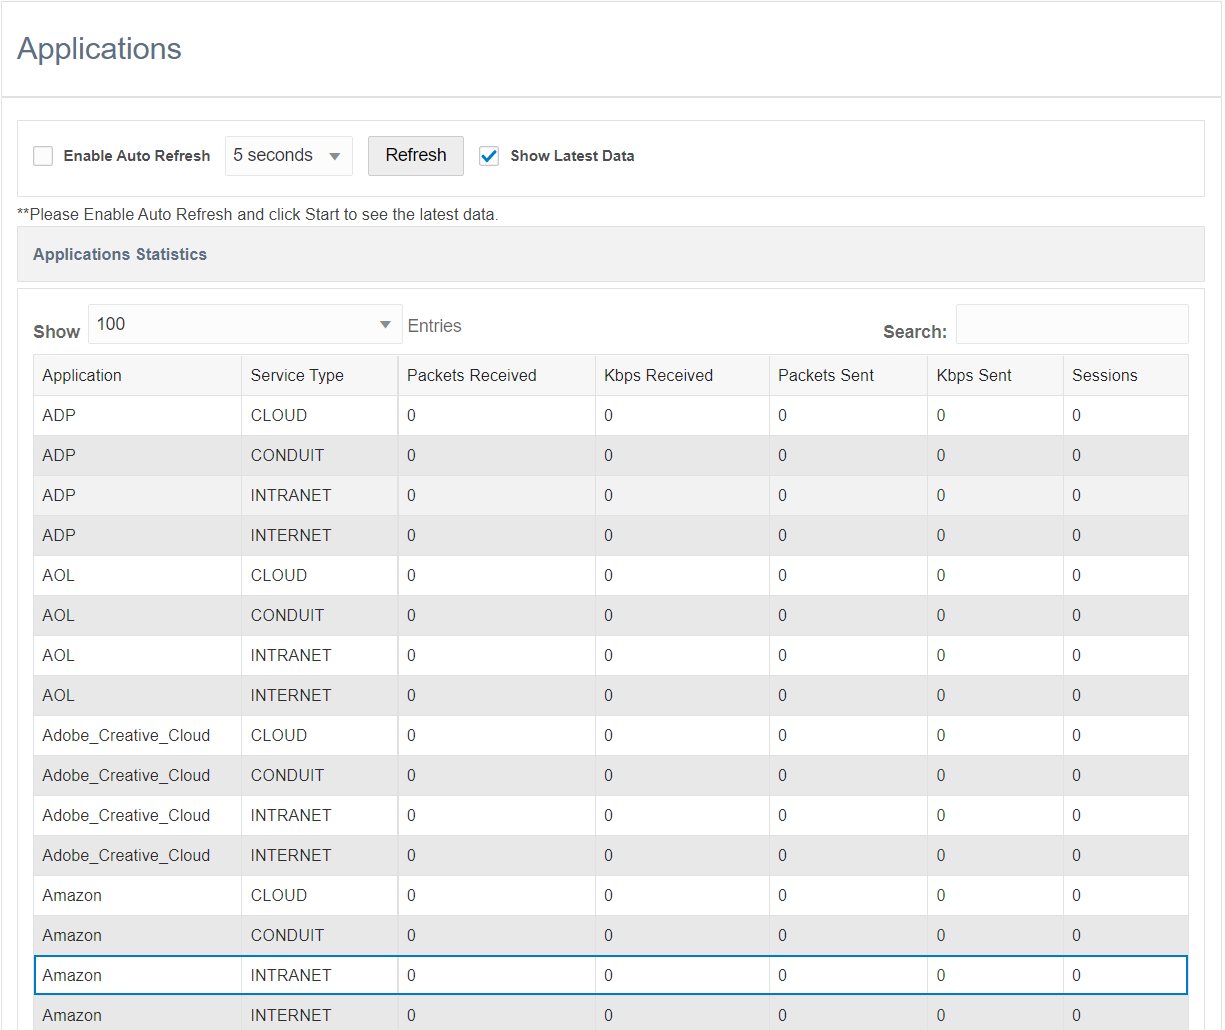
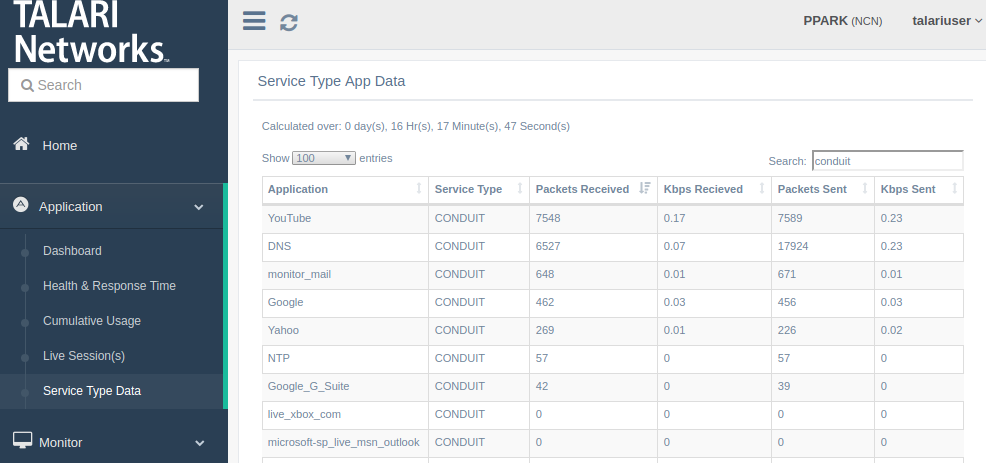
2 Configuration
Configuration Overview
Application Identification is configured through the Configuration Editor tool. In order for Application Identification to provide data on application health and usage, one or more applications must be defined and enabled. In order to take advantage of Application Identification’s steering capabilities, one or more application policies must be defined as well.
Below are more details about the configurable components that may be leveraged by the user for enhanced application identification.
Configure Application Categories (Optional)
Note:
Configuring or removing Application Categories is not required for Application Identification to function.- In the Configuration Editor, open
Applications > Application
Categories.
Pre-defined application categories may not be edited. However, they may be deleted by clicking the Delete icon in the right-hand column.
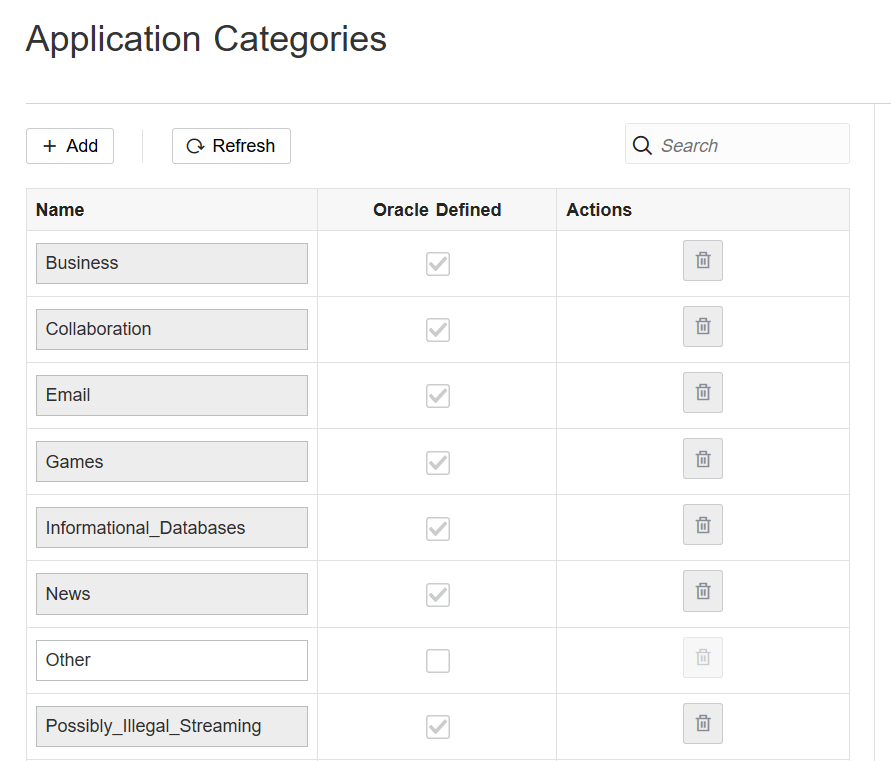
- To add a new application category, click + Add, assign a name to the new category, and click Submit.
Configure User Defined Applications
Add a New Application
To add a user-defined application, open Application
Policies, Create and Manage Applications in
the Configuration Editor and click the + Add button.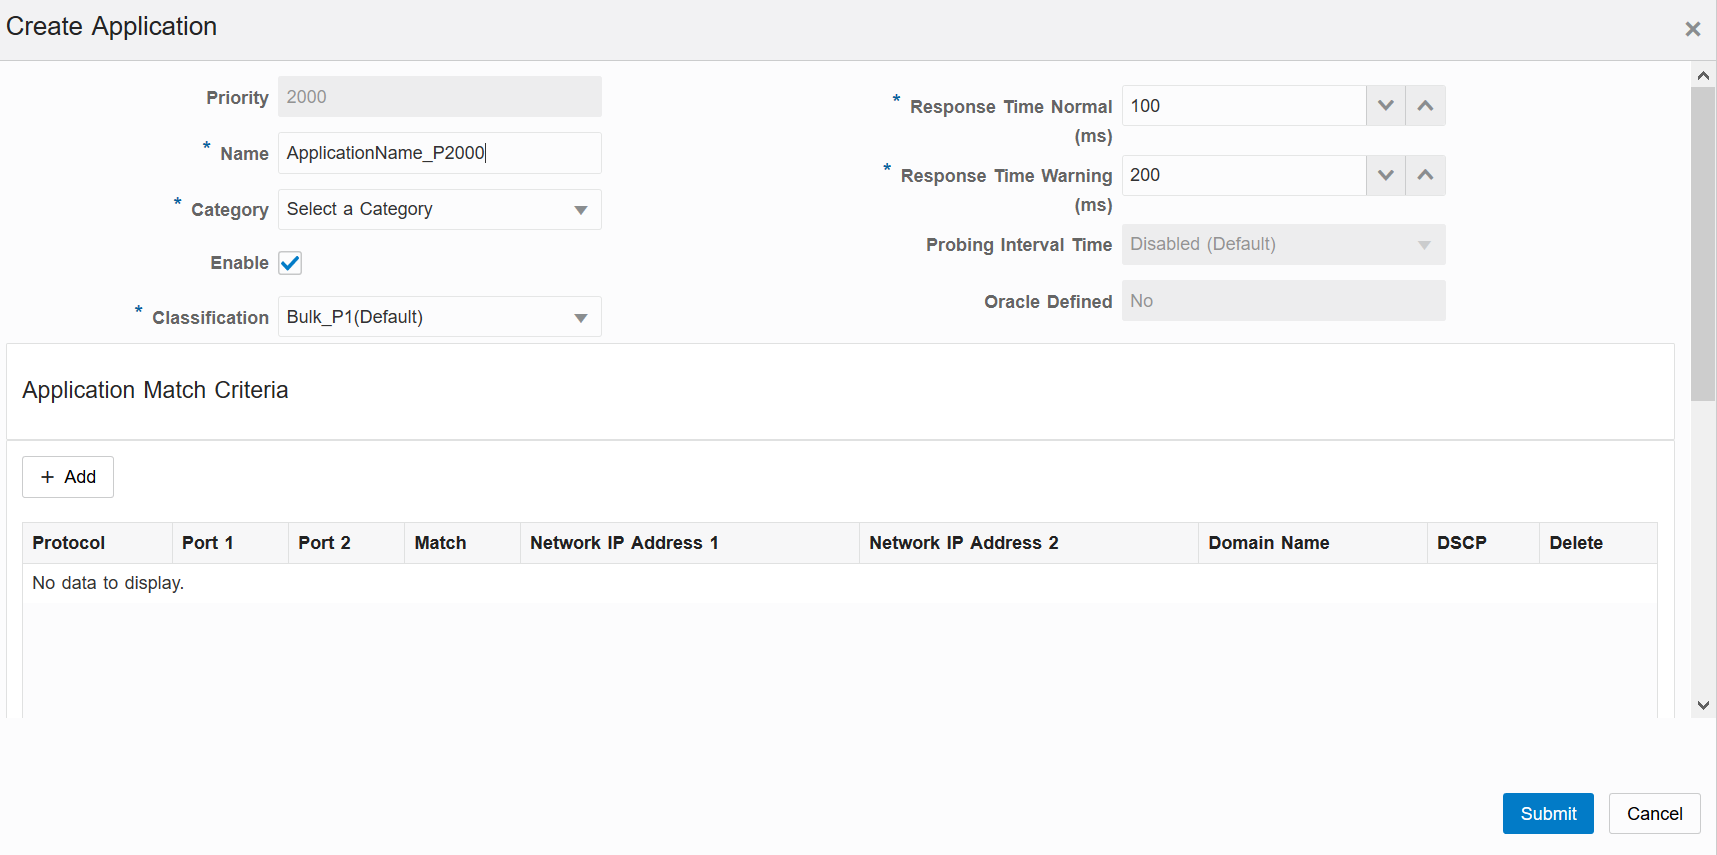
Applications defined are evaluated by a user-customizable priority order (see above). Once the system finds a match for the traffic, additional applications defined will not be evaluated for that traffic. More specific application definitions should be given a higher priority (closer to 100) so that theses matches will be achieved before more general criteria (e.g. an application matching based on the domain name analytics.google.com should be ordered before an application matching based on the domain name “google.com”). User defined application priorities will supersede the Defined Application priorities.The application definition priority is different from the Application Policy priority (see Application Policy Configuration Section further below) Applications will be assigned an automatically generated name. Best practice is to replace this with a descriptive name. Applications should be assigned a category to aid in grouping the application on the Application Dashboard. If no category is selected, the application will be assigned to a category named “Other.”
Classification
All applications have been defined a default classification for application identification. These default classifications map to the Default Rulesets. Details on how each default classification for application identification maps to the Default Rule sets can be found in Application ID Classification Mapping.
Response Time and Probing Interval(s)
When probing is enabled and the application domain name is resolved by DNS snooping, a TCP request will be sent to the IP(s) associated with the application and the RTT time will be calculated based on the response. The RTT is compared to the Response Time thresholds (Normal and Warning) specified in the application configuration to determine application health.
Applications which are at or below the normal response time will be classified as Normal on the Application Health section of the Application Dashboard. Applications which are at or below warning response time but above the normal response time will be classified as Warning. Applications which are above the warning threshold will be classified as Critical.
- Make sure the Enable box is checked to enable DNS snooping and Application Identification.
- Review/modify normal and warning response times for the application (see above).
- Select a probing interval from the dropdown.
Note:
By default, the probing interval is disabled. When the probing interval is disabled, health checking will not be available for the application.Site Bias
In addition to the per application response time settings, an overall Site Bias can be configured under Basic Settings for each site. The site bias allows the adjustment of the normal and warning times the system will expect to see for an individual site. This is useful when there are sites that are known to experience slower rates of speed than others.
When normal and warning response times are set up for an application
with probing enabled, the site bias can be used to increase the RTT checks if a
certain site is known to have slower WAN response times/higher latency across the
WAN to access applications. Using the site bias will prevent the known slower
performance site from constantly showing up under the Application Dashboard Health
with a warning or critical status for what is considered expected behavior at a that
site.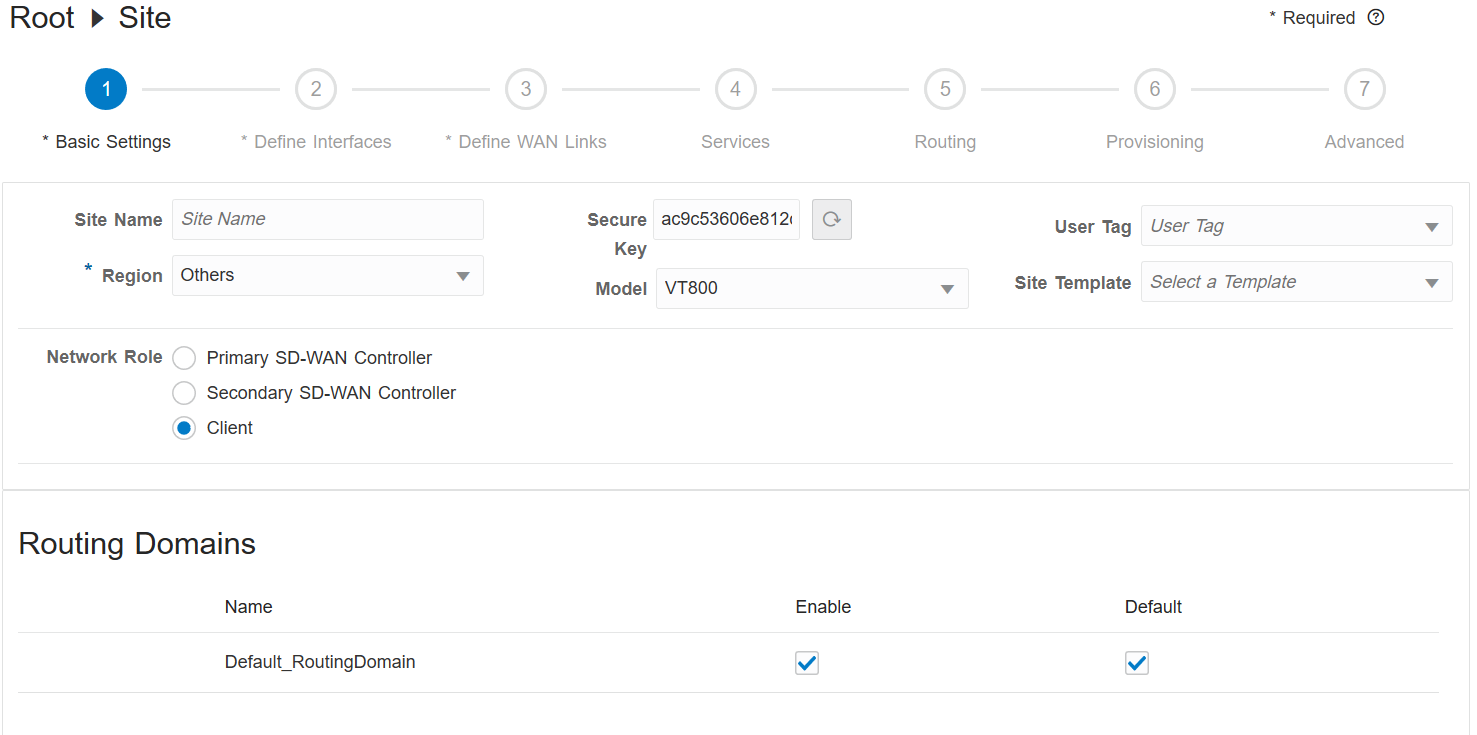
For example: An application is defined with a Normal RTT of 30ms.
However, for a specific site know to have slower performance, a site bias can be set
(within the Basic Settings for the Site) to 20ms. The outcome would be that the
Application Dashboard would not display a warning for this specific site and
application unless the RTT is >50ms. All other sites without the site bias
specified would appear with a warning on the Application Health section of the
Application Dashboard if the RTT is >30ms.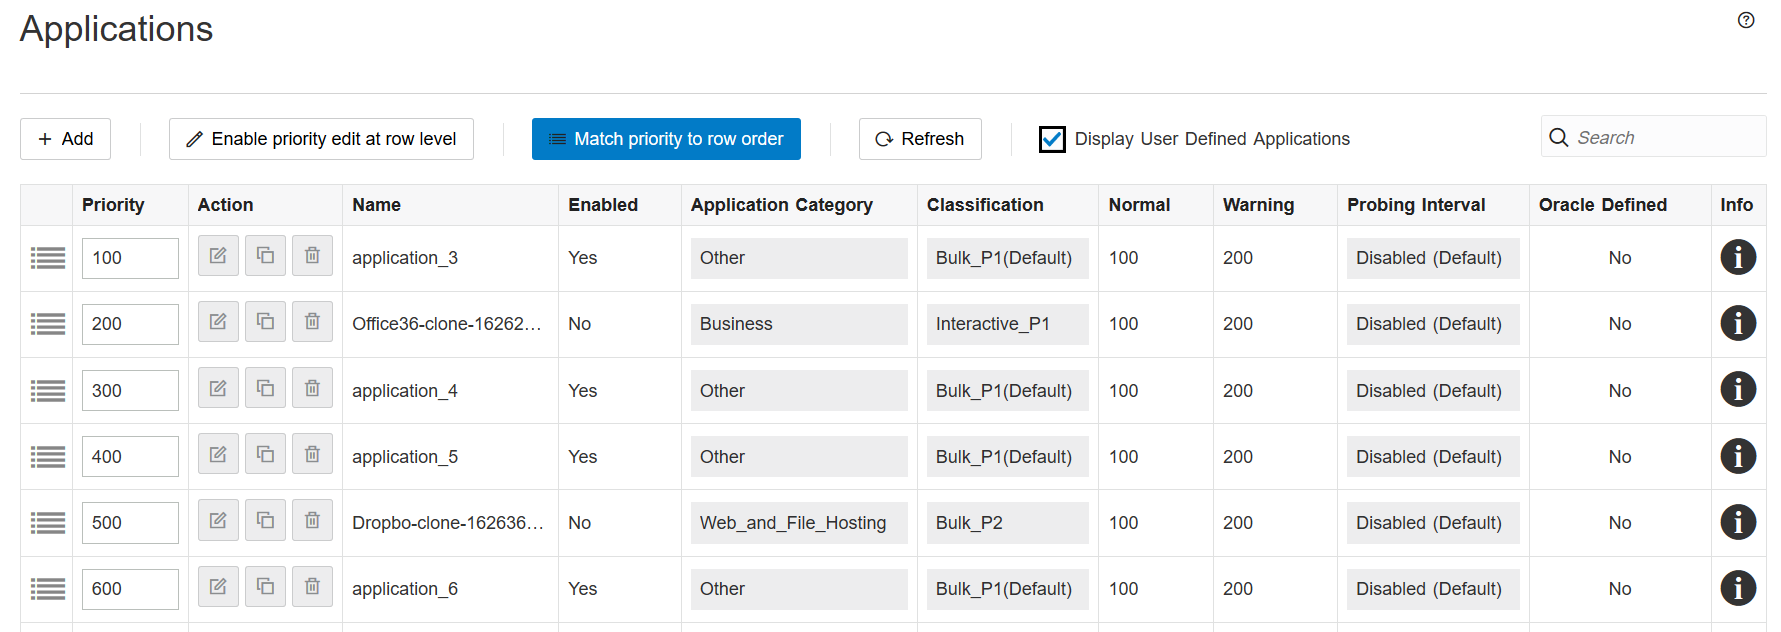
Match Criteria
- Protocol: TCP, UDP, ICMP the user has an extensive selection to choose from
- Port1/Port2: The user can define ports for a specific application if required
- Network IP Address 1/Network IP Address 2: The user can define IP addresses if required
- DSCP: The user can select from a list of default DSCP values
When the Match Criteria is “Domain Name,” all other options are greyed out and cannot be defined except for the following:
- Domain Name: Where the user would specify a domain name like yahoo.com
Note:
Any domain name defined as a match criterion will be treated for matching purposes as if it has a wildcard in front of it. Therefore, if the domain name is defined as talari.comAfter all configuration details have been specified, click Add to add the new application.
Manage Oracle Defined Applications
- To edit or remove a pre-defined application, open Application Policies, Create and Manage Applications in the Configuration Editor.
- To enable an application, click the Edit icon under Actions.
- Click the Enable checkbox then click Submit.
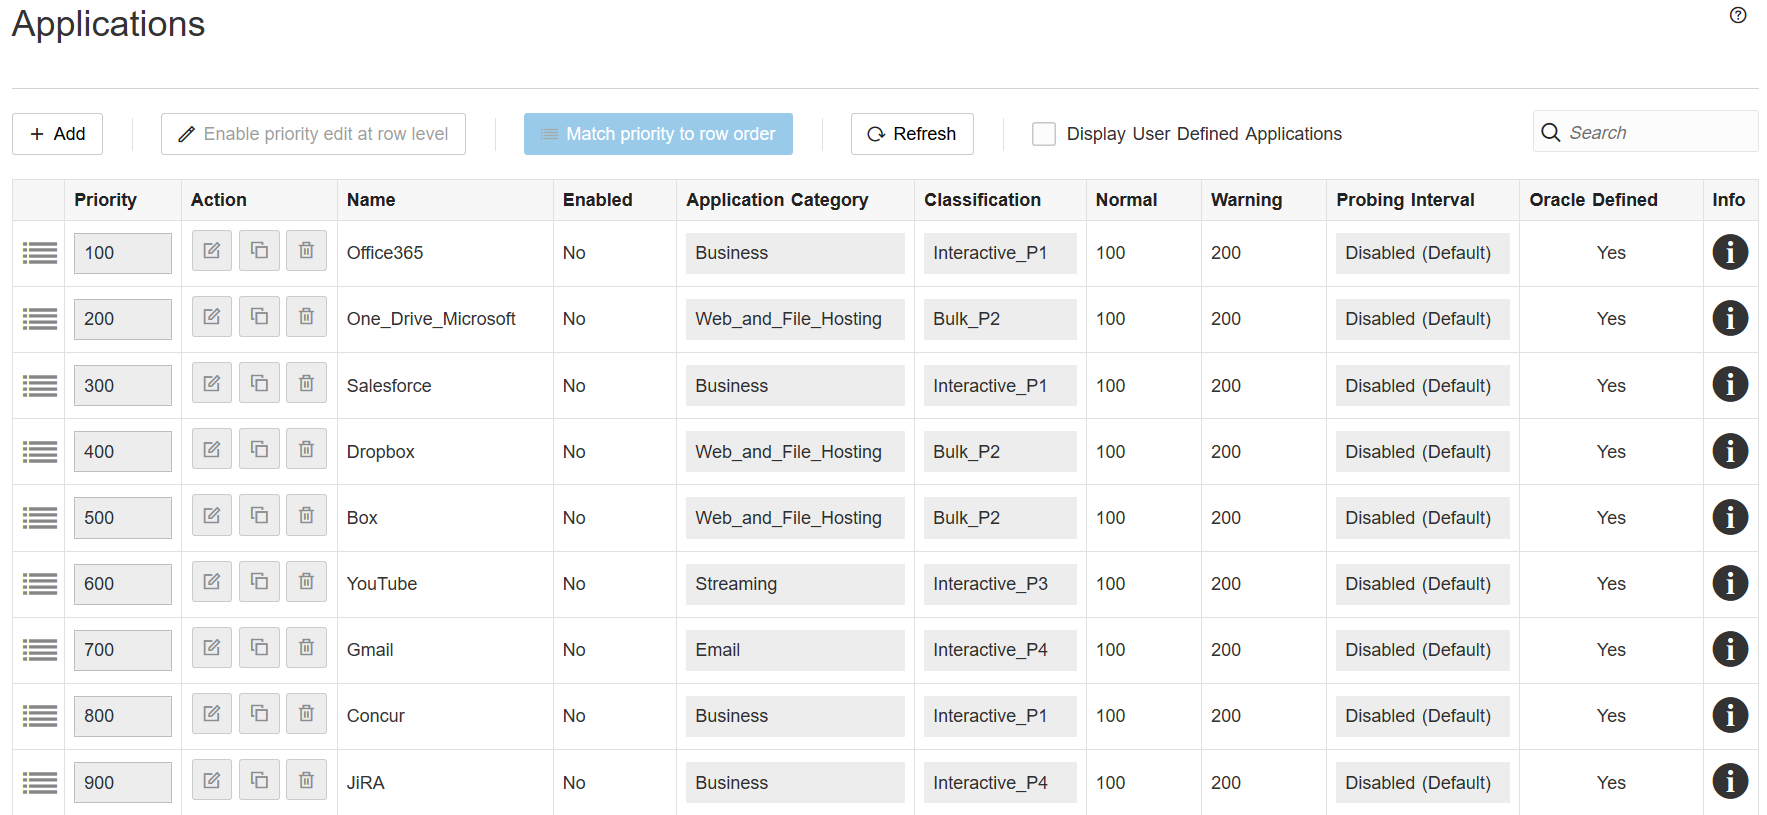
Users may not edit the application priority or name of a Defined Application. However, users may change the category, classification, response time thresholds, and probing intervals of a Defined Application, and add or delete match criteria for a pre-defined application.
Additionally, users may clone a Defined Application and further customize all
values. To clone a Defined Application, click the Clone icon
under Actions.
Once a Defined Application is cloned, it will appear as a User Defined
Application to be edited as desired.
Configure Site Groups (Optional)
Three site groups are defined by default for users to leverage. Additionally, users may create their own site groups.
- AllSites: This site group contains all of the sites in SD-WAN Edge.
- ControllerSites: This site group contains the NCN and Geo-Diverse NCN sites.
- NonControllerSites: The site group contains all client sites in SD-WAN Edge.
Default site groups may not be edited or deleted.
User created site groups may be added, edited, or deleted by opening All Sites, Site Groups in the Advanced view of the Configuration Editor.
A site may be in more than one site group. For example, if the Edge system consists of sites AG, and only sites A, E, and F use a particular application, a new site group containing those sites can be defined for use in a policy for that application.
Configure Application Policies
- In the Advanced view of the Configuration Editor open
Application Policies, Create and Manage
Policies.

- Click the + icon to add a new application
policy. The new application policy will not be assigned with an automatically
generated name - the Policy Name field will remain blank. Enter a descriptive
name here.
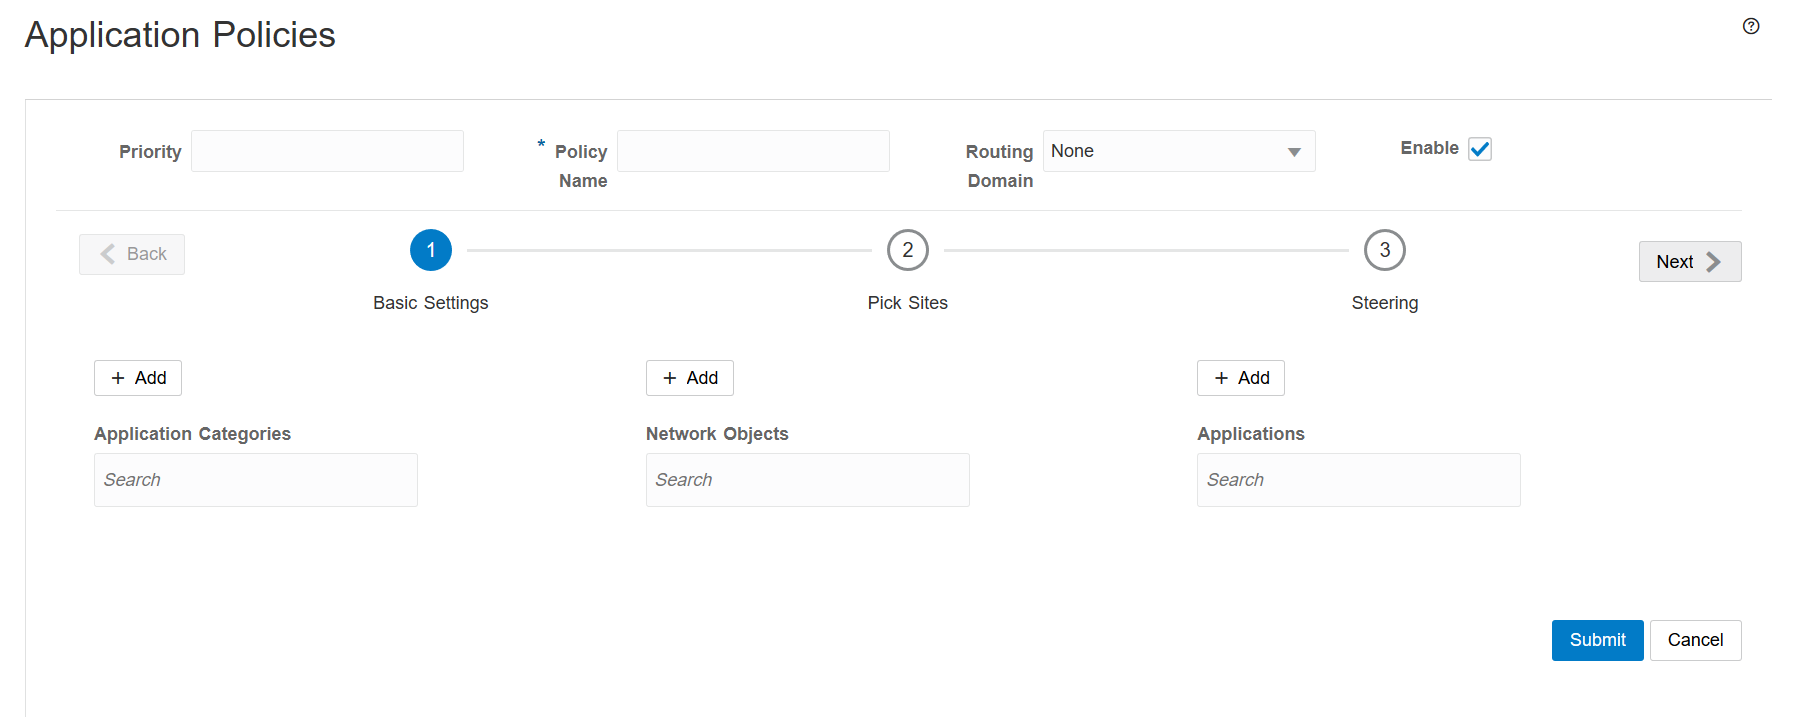
- Select a destination site (where traffic matching the policy will be sent),
service type, and service name (if applicable). By default, the QoS
classification for the policy will match the application the policy is applied
to, but the user may select a different classification from the dropdown to
override the default.
Note:
QoS classification is only applied when the application is steered to a Conduit service.A policy may have multiple match criteria defined:- Application Category Match: The user may select a category (group of applications) and steer the category to a service.
- Application Match: The user may select a specific application and steer it to a service.
- Network Object Match: The user may define source group address prefixes under Global, Network Objects and use them as a source match for the application policy.
- Site Group Match: The user may define a site group as a source match for a policy.
- Site Match: The user may define a single source site match for a policy. If the user has a single site with unique services this option can be selected for the specific site. The application policy is then only applied to that site.
- To search for a specific application match, begin typing with the
dropdown selected to find an application in the list.
Note:
Configuring duplicate application policies with the same match criteria (source network, site, and application) that steer to different services is not supported.Application priorities are automatically incremented by 100. When a user would like to re-order policy priorities, the application priority can be set to fall between any two other priorities.


Configure Site Response Time Bias
- Navigate to All Sites, [Site], Basic Settings in the Configuration Editor.
- Click the Edit icon and edit the Application Normal RTT adjust time and Application Warning RTT adjust time fields. These values will be added to the application RTT for all applications at the site.
Configuration Examples
Steer to Local Internet Service
 In the scenario pictured above, certain application traffic from the branch site
is steered directly to the local internet service. Below is a sample application policy
for this scenario:
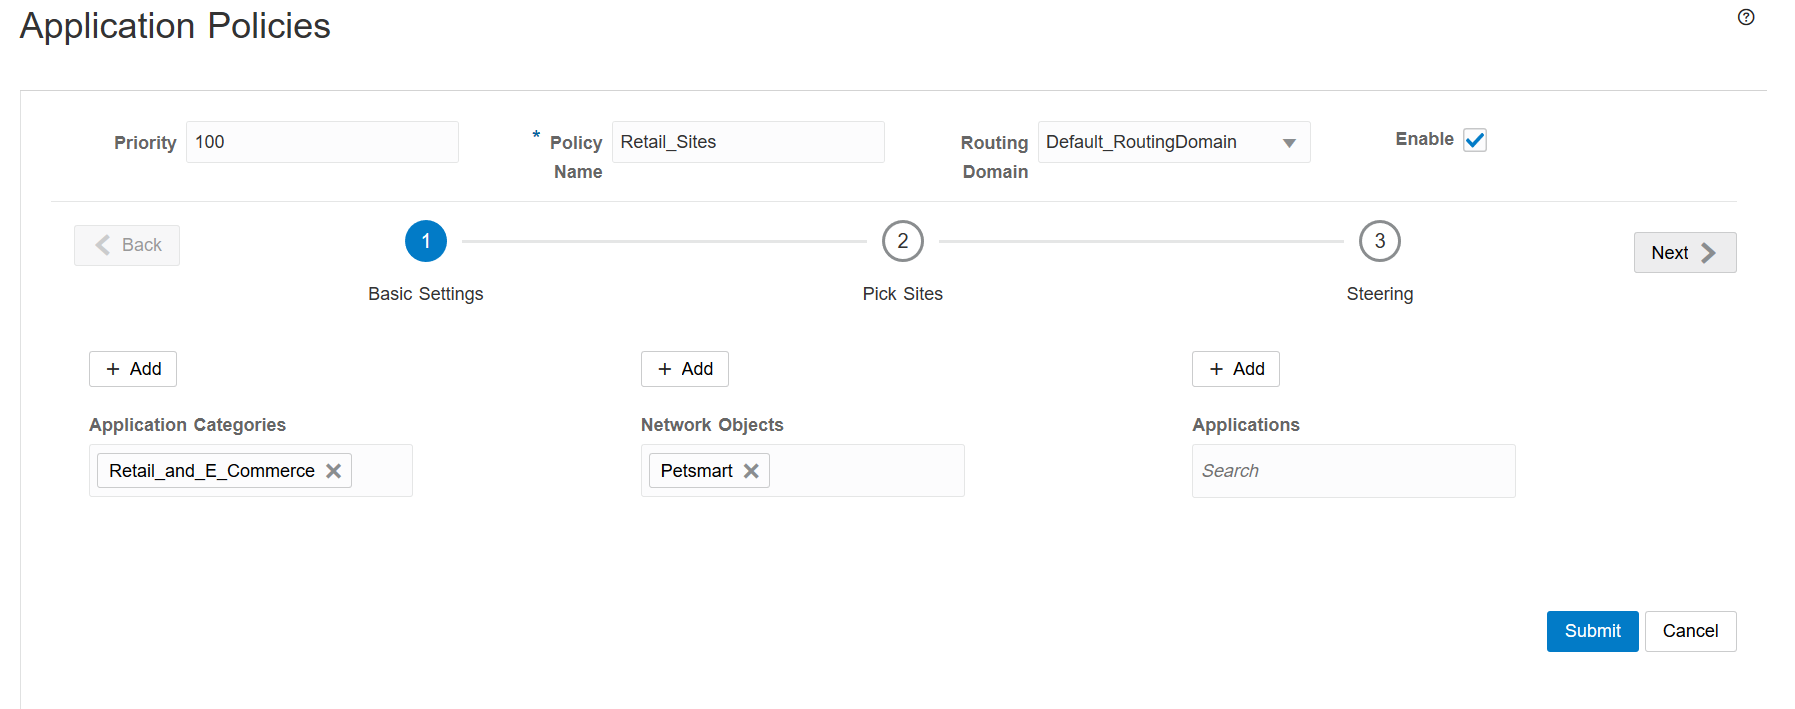
In this policy, traffic for all enabled applications in the Retail_and_E_Commerce category and the Petsmart application to/from the sites in site group Site-RS-PS will be steered to the local internet service at each site. In order for this policy to perform as intended, the sites in the chosen site group must all have a local internet service enabled which has usage allowed on at least one WAN link, and the internet service must be provisioned adequately to serve the application traffic. Further, you neet to enable "WAN-to-WAN Forwarding" or "Conduit-to-Internet Intranet Forwarding".
Hairpin to NCN or Data Center Internet Service
 In the scenario pictured above, certain application traffic from a branch site
is hairpinned to the NCN or data center for internet access. Below is a sample
application policy for this scenario.
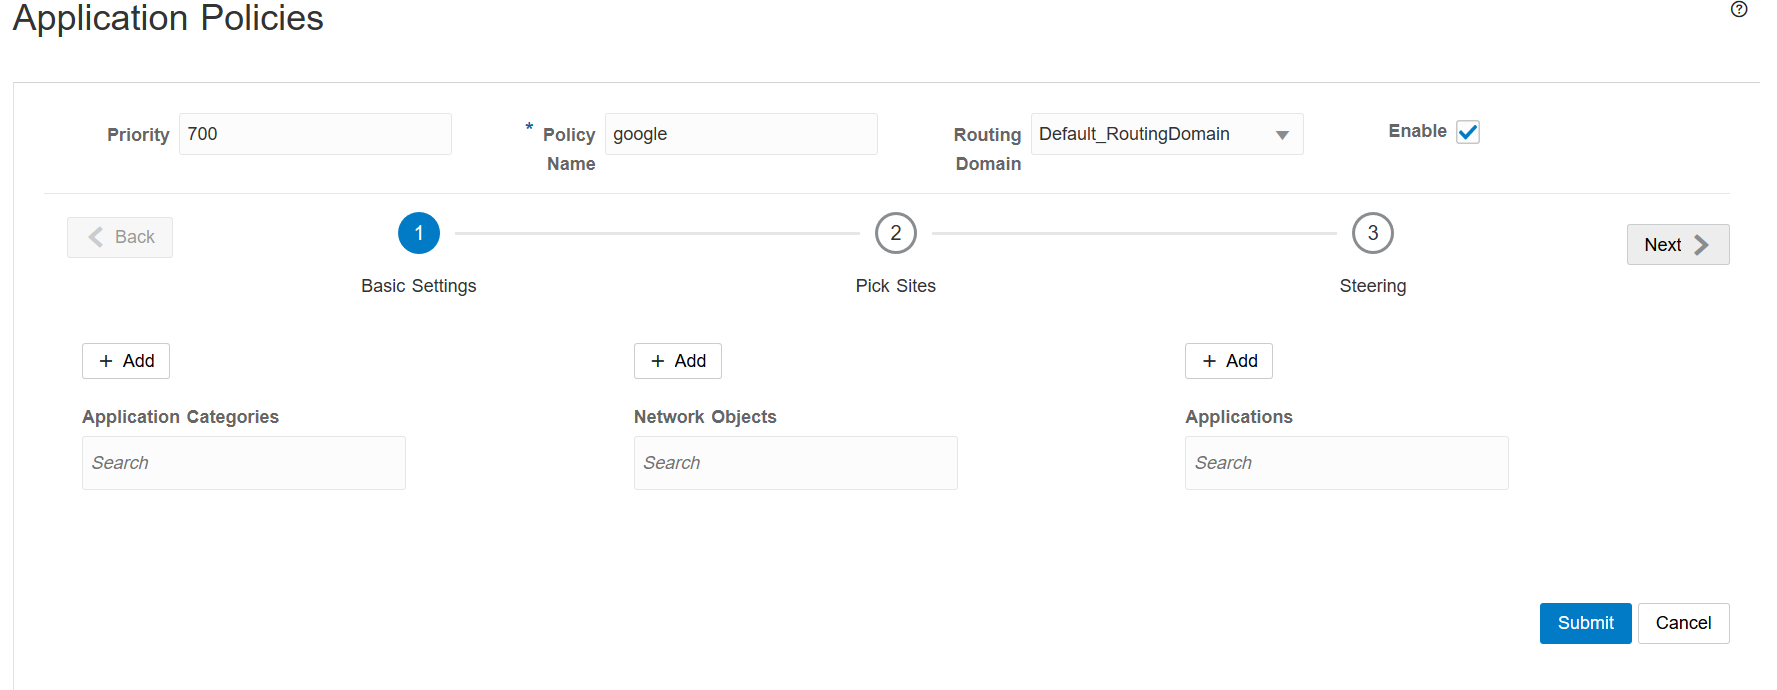
In this policy, traffic that matches the Google_G_Suite and Google_Drive applications to/from site RS is steered to destination site PPARK, where it uses the PPARK internet service. In order for this policy to perform as intended, the NCN must have a local internet service enabled which has usage allowed on at least one WAN link, and the internet service must be provisioned adequately to serve the application traffic. Further, "WAN-to-WAN Forwarding" or "Conduit to Internet Intranet Forwarding" must be enabled.
Verification
Once Application Policies have been configured, new routes and rules are automatically generated as needed in the configuration based on the policy criteria. These routes and rules are not editable by users.
Rules created based on application policies will display the parent Application Policy:
Routes created based on application policies will display the parent Application Policy and the application they apply to, as well as the service type and name (if applicable):
Import a Signature Library
To import the latest Application Presets Signature library you first create a new configuration.
- Click the Configuration Management, Configuration Editor path. A new tab opens with the Configuration Management pop-up window in the foreground.
- Ensure the baseline configuration you will add the signature library to is selected from the drop down.
- Click Import.
- The Name Conflict window appears if a selected configuration already
exits. You may
- Change the Configuration Name value and click Import.
- Check the Overwrite option and click Import.
- The screen returns to the Configuration Management window with you new or overwritten configuration selected as active.
Next, import the application presets file to this new configuration.
- Click Apply button to edit the current configuration.
- Click Application Policies located in the top bar on the screen.
- Click on Import Application Presets File located under the previously-clicked Application Policies.
- In the drop-down list "... From SD-WAN Edge", select the
latest_preset.cfg. - Ensure that the "Overwrite preset changes in current package" option is selected.
- Click Import. A status message will briefly display on the screen.
- Once imported, the new Application Signature file will be applied to any new Configuration file.
Note:
New definitions still require configuration to become active.Monitoring
The Application menu provides access to Application Identification monitoring data. The expected information is described by page and menu item within each of the sections below.
Dashboard
Note:
Timestamps may not be displayed on smaller screens.Service Type Data
The Service Type Data section at the top of the Application Dashboard
displays service data in summary with the ability for the user to view additional
details. The summary data displayed is realtime information which may change each
time the Dashboard is refreshed. This data is summarized for up to seven days or
from the last reboot/restart of the system.
Users may click on the Conduit Applications, Internet Applications, and Intranet Applications text on the top of the Service Type Data on the Application Dashboard to view additional details for Conduit Applications, Internet Applications, or Intranet Applications respectively. Additionally, if the user would like to see information for all Service Types at one time, this can be achieved by clicking on the Service Type Data header on the top of the Application Dashboard to be directed to the Service Type data page. To navigate to this same page via the left navigation menus, this page is accessible by clicking on the Application Menu, Service Type menu item.
Top 5 Applications
Within the Application Dashboard, the Top 5 Applications (Cumulative
Data) may be viewed by individual application, or by application category. The Top 5
Applications cumulative data displayed is summarized since the last reboot / restart
of the system.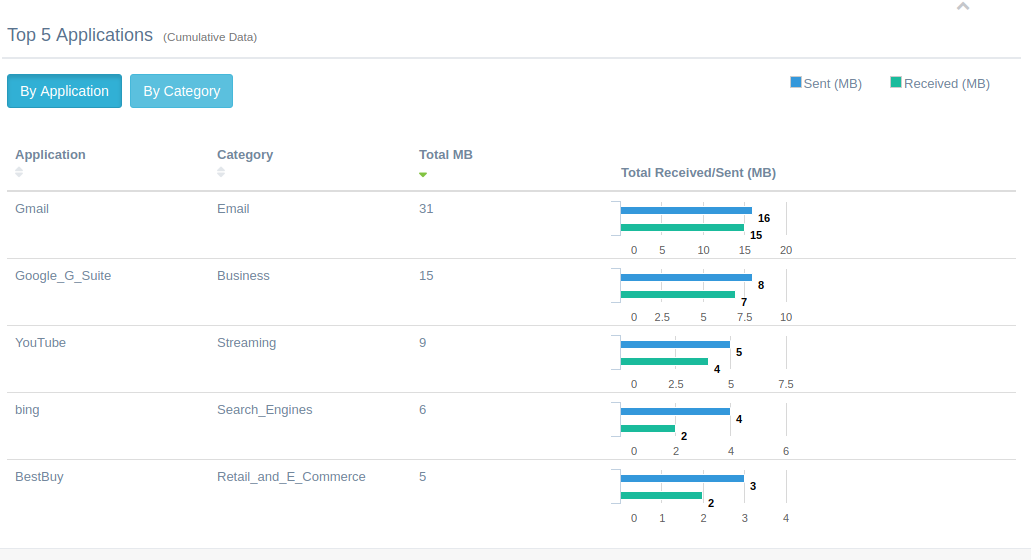
Additionally, for more information on all applications beyond the Top 5, the user may click on the text that reads Top Applications on the top of this section of the Application Dashboard, or navigate through the menus to Application, Cumulative Usage.
Application Health
The Application Health section of the Application Dashboard will provide
details on the health of up to ten applications enabled for probing. Application
Health data is realtime (i.e. not cumulative over any time frame) and is expected to
change each time the Application Dashboard is refreshed to show the latest
information.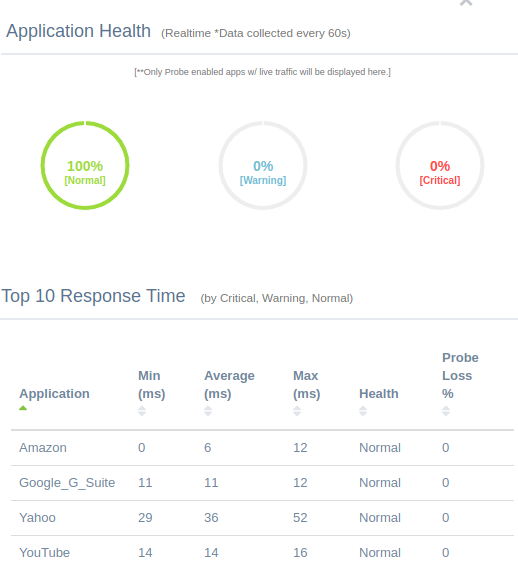
Additional applications beyond the initial ten shown on the Application Dashboard may be viewed by either clicking the Application Health text header on the Application Dashboard, or by navigating to the Application, Health and Response on the left navigation. For more details see the Health and Response Time Section.
Applications will be classified as Normal, Warning, or Critical based on the response time thresholds specified by the user for Normal and Warning. Any application that has a response time above the Normal threshold specified by the user will be classified as “Warning” under Application Health. Similarly, any application that has a response time above the Warning threshold specified by the user will be classified as “Critical” under Application Health.
The Probe Loss % column displayed for Application Health is calculated based upon the following calculation: (probing request sent - probing reply received)/(probing request sent). Probe loss is not used to determine application health.
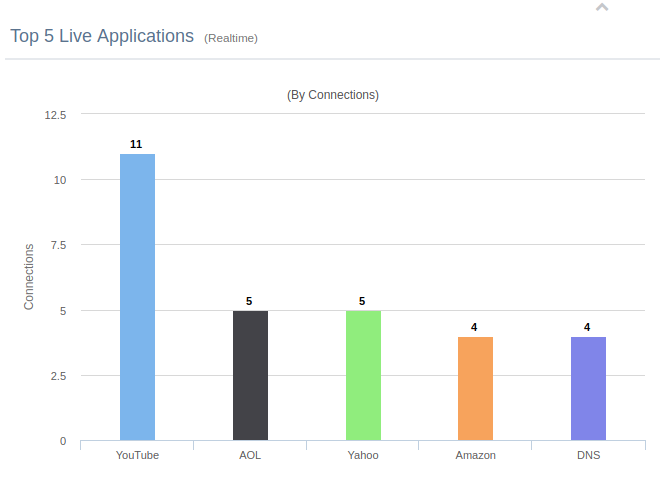
Top 5 Live Applications
The Top 5 Live Applications provides a realtime view of the top 5 live applications based upon the number of connections. The Top 5 Live Applications data is realtime (i.e. not cumulative over any time frame) and is expected to change each time the Application Dashboard is refreshed to show the latest information. To appear as a Live Application, an application must be enabled and traffic must be identified by the system.
Health and Response Time
Accessible from the navigation menu from Application,
Health & Response. The Health and Response Time screen
shows health information for all currently enabled applications: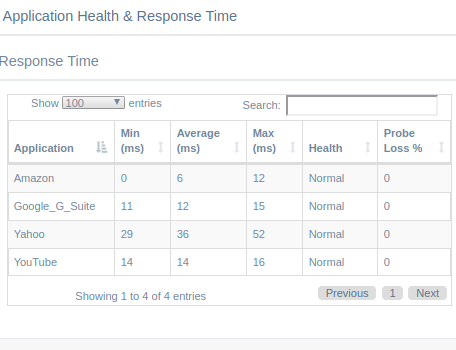
The minimum, maximum, and average RTT in milliseconds is shown for each application, along with a current health designation and percentage of lost probes.
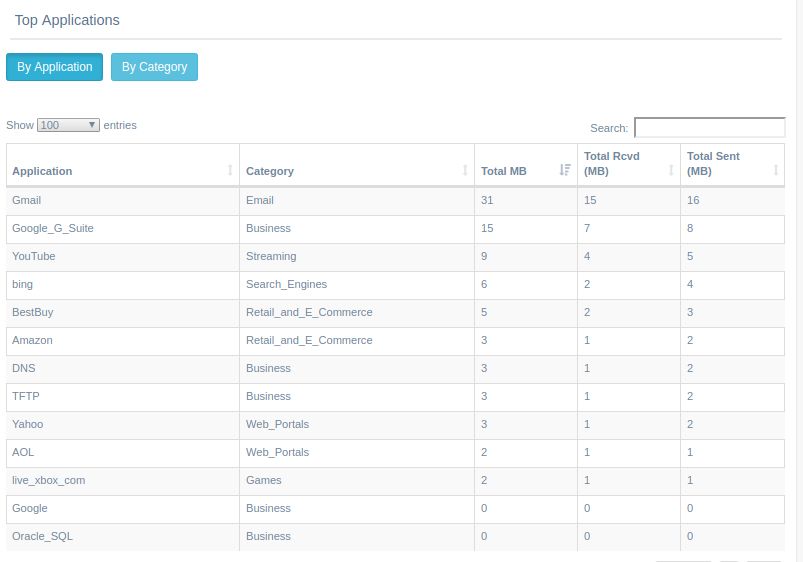
Cumulative Usage
Accessible from the navigation menu from Application, Cumulative Usage. The Cumulative Usage screen shows the overall usage per application or application category:
Live Sessions
Accessible from the navigation menu from Application, Live Sessions. The Live Sessions screen shows live application statistics and can be set to auto refresh.
