5 The Dashboard Tab Display and Operations
The Oracle® Enterprise Session Border Controller (Enterprise SBC) provides a web-based Dashboard that can display application and system data in Widgets to help you monitor and manage the system. You can add and remove Widgets from the Dashboard, specify their data sampling settings, and export the data.
Dashboard Controls and Operations
The Oracle® Enterprise Session Border Controller (Enterprise SBC) can display dynamic data about the system through Widgets that you choose to place on the Dashboard. You can decide which Widgets to display by adding, deleting, and moving them at any time. The Dashboard can display up to 18 Widgets.
Note:
The Enterprise SBC collects only SIP data for the Dashboard Widgets, including the default CPU and Memory Widgets. For this reason, you must set up a valid SIP configuration before the Enterprise SBC can display any data on a Dashboard Widget.The following screen capture shows an example of the Dashboard page and the controls you use to manage the Widgets:
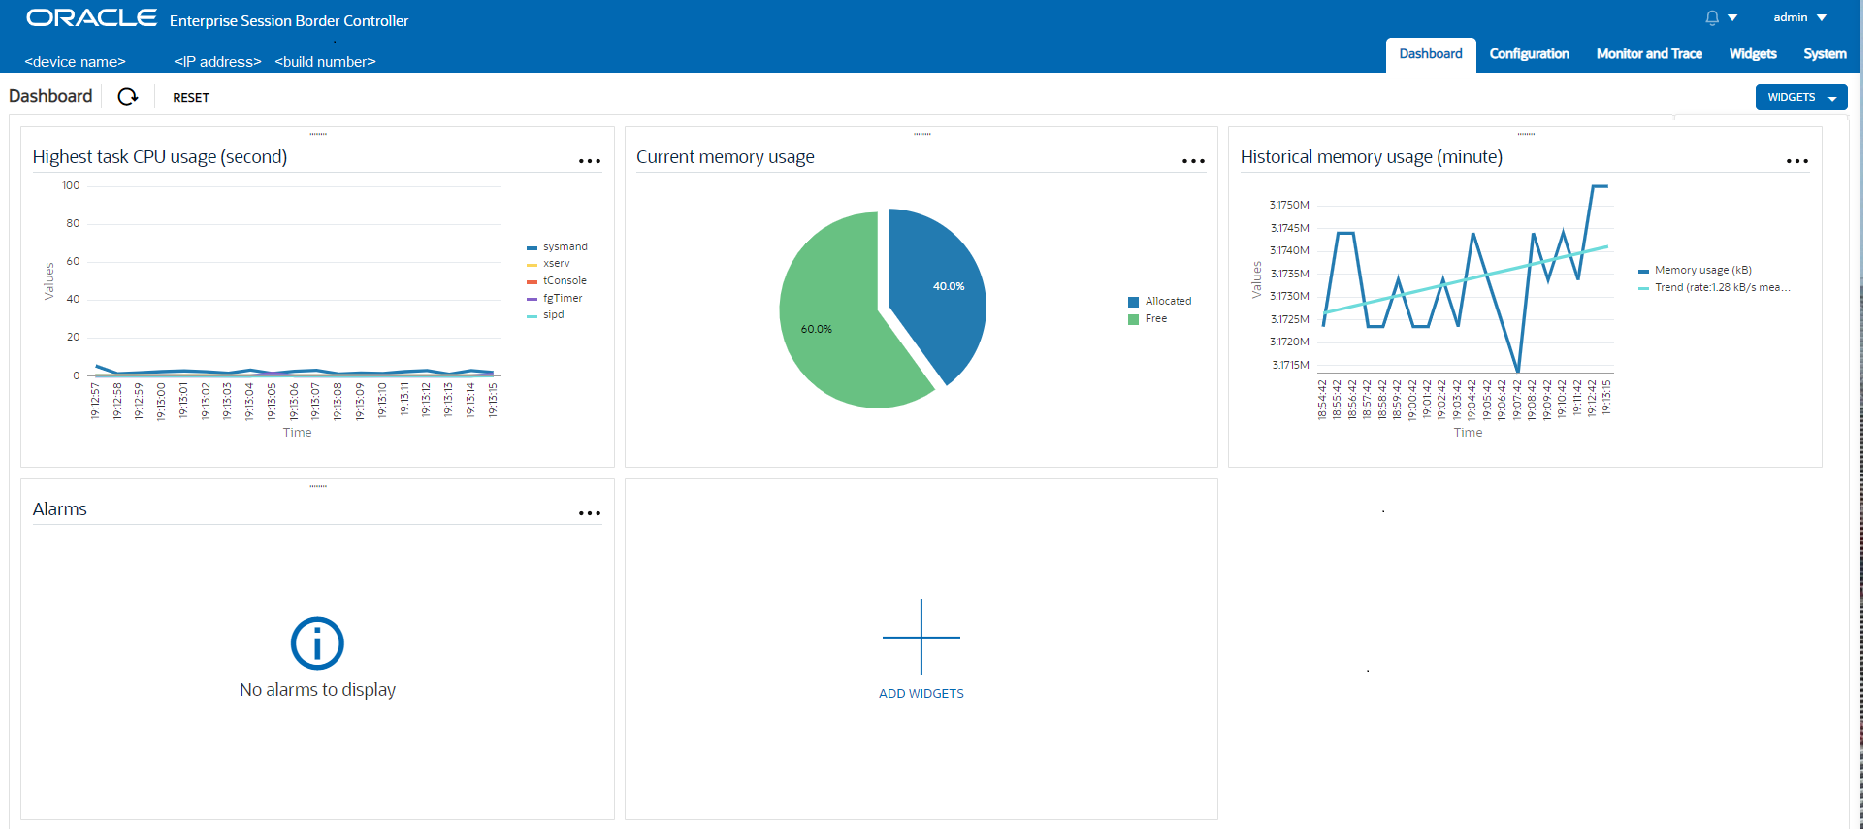
 —Shows the device name, the device IP address, and the software build number.
When you deploy your SBC in a High Availability (HA) pair, the system identification
also states whether the device is the Active or Standby peer.
![]() —Updates the data in all of the Widgets on the Dashboard.
—Updates the data in all of the Widgets on the Dashboard.
![]() —Resets the Dashboard to display the default Widgets and removes all other
Widgets from the Dashboard.
—Resets the Dashboard to display the default Widgets and removes all other
Widgets from the Dashboard.
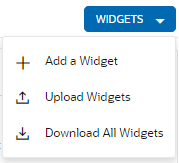
—Displays the Widgets action menu.
 —Tells you that the Widget is blank because there is no data to display.
A Widget can display a table, text, a pie graph, or a line graph depending on the type of data and the purpose of the display. For example, the SIP Realms All Widget displays an actionable table and the Recording Widget displays static text. You can access the list of Widgets from the Dashboard page by clicking Add Widget.
Most of the Widgets automatically display any available data when you click the name of the Widget, but some Widgets require further input. Such Widgets include a Settings button in their tool bar that launches a parameters dialog were you specify the data to display. For example, the Realm Specifics Widget requires you to set the name of the realm and the auto refresh interval.
Note:
The operation of Widgets, such as those that require the SIP Session module, may affect system performance. The system displays a warning when you add a Widget that may affect performance. Oracle recommends adding such Widgets at a time when the performance impact will not affect service.- Highest CPU Usage
- Current Memory Usage
- Historical Memory Usage
- Alarms
Widget Controls
Each Widget contains the controls that you use to manage its operations, according to the purpose of the Widget. The controls display when you hover over the three ellipses in the upper right corner of the Widget.
The following screen capture shows an example of the tool bar that displays in a Widget. In the Widget, you can hover over the control for a description.
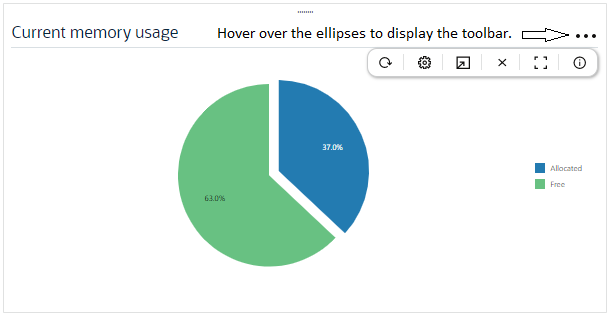
The following information describes the Widget controls.
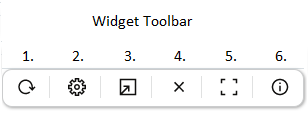
- Refresh—Updates the data in the Widget.
- Settings—Displays the dialog where you set the data sampling parameters for the Widget. When you click the icon, the Widget displays the Settings dialog, where you can set the auto-refresh interval and other parameters that apply to the particular Widget. Widgets can display up to 100 data samples in intervals of 1 hour, 1 minute, or 1 second.
- Export—Downloads the data displayed in the Widget.
- Remove—Removes the Widget from the Dashboard. When you remove all Widgets from the Dashboard, the GUI displays the following message: " Your Dashboard is empty, please add a Widget or reset to restore the original Dashboard."
- Maximize—Displays the Widget in full-screen size.
- Show Information—Describes the data display. For example, in the Current Memory Usage Widget, the information icon says, "Pie graph displays current percentage of free and allocated memory."
About the Add Widgets Page
After you click either the +Widget button or the Add Widget card on the Dashboard, the Web GUI displays the Add Widget page. On the Add Widget page, you can search for Widgets to add to the Dashboard and you can see which Widgets exist on the Dashboard. You can also see descriptions of the Widgets and change the display from card view to list view.
The following screen capture shows the default view of the Add Widgets page, called card view.
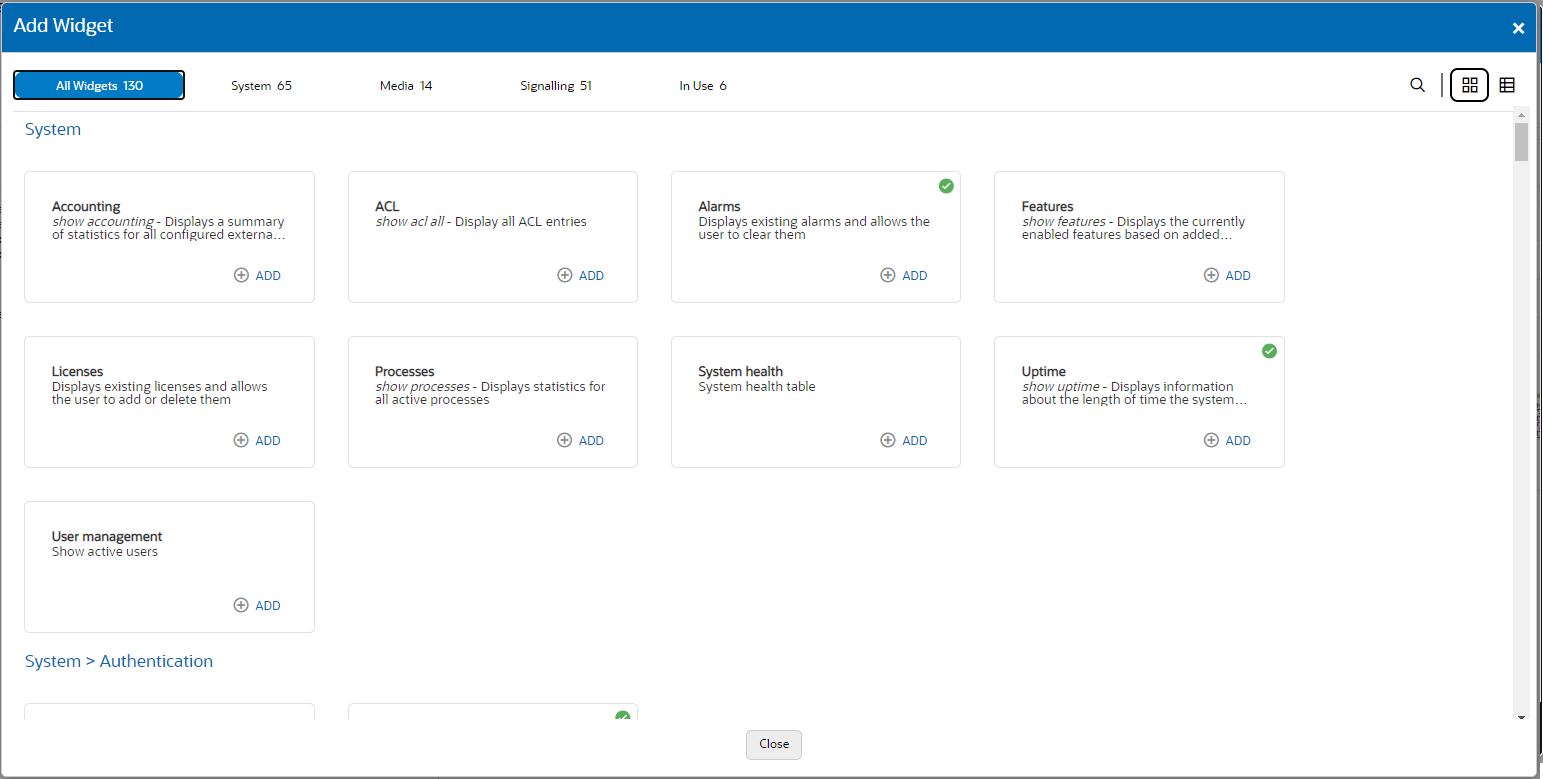
In the top row of the preceding screen capture, the Alarms card and the Licenses card each display a green circle around a check mark. The check mark means that those Widgets currently display on the Dashboard.
The following screen capture shows the list view of the Add Widgets page.
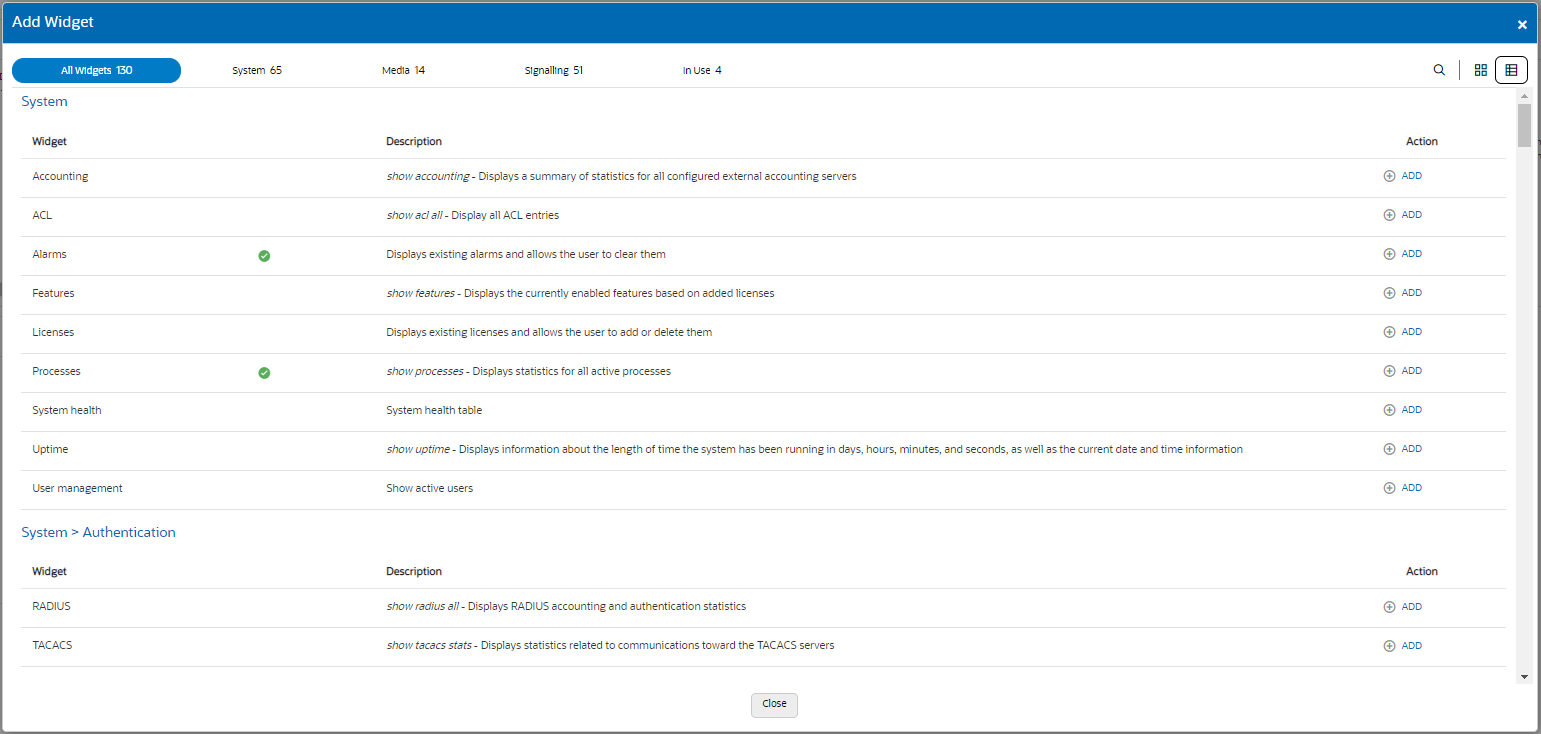
In the preceding screen capture, the Alarms row and the Licenses row each display a green circle around a check mark in the column between the Widget and Description. The check mark means that those Widgets currently display on the Dashboard.
Action Controls on the Banner
 Search—Click to display the Search field, where you enter the name
of a Widget.
 Card view—Click to display the card view.
 List view—Click to display the list view.
 Close—Click to close the Add Widgets page.
Search Filters
 All widgets—Click to see a list of all Widgets in alphabetical
order.
 System—Click to see only a list of System-related Widgets.
 Media—Click to see only a list of Media-related Widgets.
 Signaling—Click to see only a list of Signaling-related
Widgets.
 In Use—Click to see a list of Widgets currently displayed on the
Dashboard.
Note:
All of the lists display a scroll bar when the list exceeds the page space.Add a Dashboard Widget
You can add up to eighteen Widgets to the Web GUI Dashboard to display SIP and System statistics to help you monitor and manage the system.
- See "Configure Data Sampling Settings for a Dashboard Widget."
Configure the Data Sampling Settings for a Dashboard Widget
To display SIP and System statistics on a Dashboard Widget, the system requires a setting for how often to refresh the display. You can use the default interval or select one from the Auto-refresh interval drop-down list on the Widget.
- Confirm that the Widget that you want to configure is on the Dashboard. If not, see Add a Dashboard Widget.
- Click the Dashboard tab.
- On the Widget, hover over the ellipses to display the toolbar, and click the Settings icon.
- Select a Widget display refresh frequency from the Auto-Refresh Interval (seconds) drop down list.
- If the Widget displays the Table Name drop-down list, select a data sampling increment for the Widget display. Valid values: Seconds | Minutes | Hours.
- Click OK.
- Click Close.
Copy the Dashboard Widgets Display from one Enterprise SBC to Another
When you want the Dashboard Widgets display to be the same on multiple Enterprise SBC's, you can download an XML file of the Widgets from one Enterprise SBC and upload it to another one by way of the Widgets button on the Dashboard.
Note:
When viewing the Dashboard tab, which displays the Widgets button, you can also see the Widgets tab. The following procedure refers to the Widgets button on the Dashboard tab.