1 Cloud Deployment

The cloud native Oracle Communications Converged Application Server is deployed on a Kubernetes cluster using container images from the Oracle Container Registry. Use these images to deploy the Converged Application Server Admin and Managed servers as Kubernetes Pods.

The high-level steps to deploy the Converged Application Server include:

  1. Install the dependencies.
  2. Install Podman.
  3. Log in to the Oracle Container Registry.
  4. Pull the Converged Application Server image from the Oracle Container Registry.
  5. Install Kubernetes.
  6. Install the WebLogic Kubernetes Operator.
  7. Create a Persistent Volume
  8. Deploy the domain.

Optional steps include:

  • Bring up another managed server.
  • Install the EFK stack (ElasticSearch, FluentD, Kibana).
  • Install Prometheus and Grafana
  • Apply a patch

Install Dependencies

The java-devel and iproute-tc packages are required dependencies for the Converged Application Server. The git package is required to clone the Kubernetes WebLogic Operator.

  1. Install the required dependencies.
    sudo dnf install podman git java-devel iproute-tc
  2. Set the JAVA_HOME variable.
    For example:
    export JAVA_HOME=/etc/alternatives/jre

    Append this line to your ~/.bashrc file.

Log in to Oracle Container Registry

Before deploying the Converged Application Server, you must log in to the Oracle Container Registry and accept the Java License Agreement for the JDK and the Middleware License Agreement for the Oracle Communications Converged Application Server.

Oracle provides access to the Oracle Container Registry for customers that have a Single Sign-On account at Oracle. The Oracle Container Registry contains Docker images for licensed commercial Oracle software products that you may use in your enterprise. Images may also be used for development and testing purposes. The license covers both production and non-production use. The Oracle Container Registry provides a web interface where customers are able to select Oracle Docker images and agree to terms of use before pulling the images using the standard Docker client software.
If necessary, create an account.
  1. Navigate to the Oracle Container Registry.
  2. In the top-right corner, click Sign In.
  3. Enter your Oracle credentials and click Submit.
  4. Click Middleware and then click occas.
  5. Select your language and click Continue.
  6. Scroll to the end of the License Agreement and click Accept.
  7. From the server where you are installing the Converged Application Server, log in to the Oracle Container Registry.
    podman login container-registry.oracle.com

    Note:

    If you are behind a proxy, follow these steps to set up the http_proxy and https_proxy variables for your docker client.

Download Domain Creation Files

In addition to downloading the occas_generic.jar file, you need to download the domain creation files.

  1. Sign in to My Oracle Support.
  2. Search for "Docker Script for OCCAS 8.1 Installation" (Doc ID 3007597.1).
  3. Under the Details section, click the link to download occas81.zip.
  4. Unzip the file.
    unzip occas81.zip
    This creates the occas81/ directory.

Choose the Image

The Oracle Communications Converged Application Server image is located on the Oracle Container Registry.

  1. If using JDK 8, use the JDK 8 container.
    container-registry.oracle.com/middleware/occas:8.1.0.0.0-generic-8
  2. If using JDK 11, use the JDK 11 container.
    container-registry.oracle.com/middleware/occas:8.1.0.0.0-generic-11

Install Kubernetes

Kubernetes orchestrates the Converged Application Server containers, deploying and scaling them as necessary. Because Kubernetes is complex with many customer-specific requirements, you should consider either using a hosted solution or reading the Kubernetes documentation in full to find the right solution for your needs. To use kubeadm, see Installing kubeadm for prerequisites, installation steps, and troubleshooting.
  1. After Kubernetes is installed, run kubeadm init to start Kubernetes.
  2. Follow the instructions returned by the kubeadm command.
    mkdir -p $HOME/.kube
    sudo cp -i /etc/kubernetes/admin.conf $HOME/.kube/config
    sudo chown $(id -u):$(id -g) $HOME/.kube/config
  3. Deploy a Pod network to the cluster.
    Converged Application Server supports Calico as the Pod network.

Install the Kubernetes Weblogic Operator

The WebLogic Kubernetes Operator supports running your WebLogic Server domains on Kubernetes, an industry standard, cloud neutral deployment platform. It lets you encapsulate your entire WebLogic Server installation and layered applications into a portable set of cloud neutral images and simple resource description files. You can run them on any on-premises or public cloud that supports Kubernetes where you’ve deployed the operator.

Kubernetes must be installed before following the procedure below. If you have not yet installed Kubernetes, see the Kubernetes documentation.
  1. Install Helm, a package manager for Kubernetes.
    1. Download Helm.
      curl -O https://get.helm.sh/helm-v3.6.3-linux-amd64.tar.gz

      See the Releases page for other Linux architectures.

    2. Extract Helm.
      tar xf helm-v3.6.3-linux-amd64.tar.gz
    3. Move the Helm binary into your PATH.
      sudo install linux-amd64/helm /usr/local/bin/helm
  2. Install the Oracle Weblogic Kubernetes Operator.
    The Oracle Weblogic Kubernetes Operator is used to configure the lifecycle of the Converged Application Server images. See the Oracle Weblogic Kubernetes Operator documentation.
    1. Clone the Weblogic Kubernetes Operator git repository.
      git clone --branch v4.0.5 https://github.com/oracle/weblogic-kubernetes-operator
    2. Navigate to the weblogic-kubernetes-operator directory.
      cd weblogic-kubernetes-operator

      Note:

      Subsequent commands will assume your current directory is weblogic-kubernetes-operator.
  3. Pull the Docker image for the WebLogic Kubernetes Operator and copy that image to all the nodes in your cluster.
    podman pull ghcr.io/oracle/weblogic-kubernetes-operator:4.0.5
  4. Create the namespace for the Weblogic Kubernetes Operator.

    The syntax for the command is: kubectl create namespace <unique name>. For example:

    kubectl create namespace sample-weblogic-operator-ns
  5. Create the service account within that namespace for the WebLogic Kubernetes Operator.
    kubectl create serviceaccount -n sample-weblogic-operator-ns sample-weblogic-operator-sa
  6. Update the following parameters in the file weblogic-kubernetes-operator/kubernetes/charts/weblogic-operator/values.yaml.

    If you plan on installing the EFK stack, set elkIntegrationEnabled to true; otherwise, leave elkIntegrationEnabled as false.

    • serviceAccount—Set this to the previously created service account for the WebLogic Kubernetes Operator.
      serviceAccount: "sample-weblogic-operator-sa"
    • domainNamespaces—Set this to the previously created namespace for the WebLogic Kubernetes Operator.
      domainNamespaces:
      - "sample-weblogic-operator-ns"
    • elkIntegrationEnabled—Set this to true if you plan on installing the EFK stack; leave as false if you do not plan on installing the EFK stack.
      elkIntegrationEnabled: true
    • elasticSearchHost—Change the word 'default' in 'elasticsearch.default.svc.cluster.local' to the namespace previously created for the WebLogic Kubernetes Operator.
      elasticSearchHost: "elasticsearch.sample-weblogic-operator-ns.svc.cluster.local"
  7. Paste the following role-based access control (RBAC) definition into a YAML file called rbac.yaml.

    See Using RBAC Authorization.

    apiVersion: rbac.authorization.k8s.io/v1
    kind: ClusterRoleBinding
    metadata:
      name: helm-user-cluster-admin-role
    roleRef:
      apiGroup: rbac.authorization.k8s.io
      kind: ClusterRole
      name: cluster-admin
    subjects:
    - kind: ServiceAccount
      name: default
      namespace: kube-system
  8. Apply the RBAC file.
    kubectl apply -f rbac.yaml
  9. From the weblogic-kubernetes-operator directory, start the operator.
    helm install sample-weblogic-operator kubernetes/charts/weblogic-operator \
      --namespace sample-weblogic-operator-ns \
      --set image=ghcr.io/oracle/weblogic-kubernetes-operator:4.0.5 \
      --set serviceAccount=sample-weblogic-operator-sa \
      --set "enableClusterRoleBinding=true"\
      --set "domainNamespaceSelectionStrategy=LabelSelector"\
      --set "domainNamespaceLabelSelector=weblogic-operator\=enabled"\
      --wait
You can verify the pod is running with the following command:
kubectl get pods -n sample-weblogic-operator-ns
For example:

Note:

If you are installing the EFK stack and set elkIntegrationEnabled to true, then the READY column will display 2/2 when both containers are ready. If you are not installing the EFK stack and left elkIntegrationEnabled as false, then the READY column will display 1/1 when the container is ready.
[weblogic-kubernetes-operator]$ kubectl get pods -n sample-weblogic-operator-ns
NAME                                 READY   STATUS    RESTARTS   AGE
weblogic-operator-7885684685-4jz5l   2/2     Running   0          2m32s
[weblogic-kubernetes-operator]$

Create the Persistent Volume

Converged Application Server uses a Persistent Volume (PV) to store logs that can be viewed with Kibana. The PV may be either a local path on the master node or a NFS location.

  1. Create and label a namespace that can host one or more domains.
    kubectl create namespace sample-domain1-ns
    kubectl label ns sample-domain1-ns weblogic-operator=enabled
  2. On the server where you'll store the log files, create the PV directory with open permissions.
    mkdir /u01/pv
    chmod 777 /u01/pv

    Note:

    See Persistent Storage for details about permissions.
  3. On the master node, navigate to the occas81/dockerfiles/8.1.0.0.0/occas-domain-home-on-pv directory.
  4. Open the sample-domain1-weblogic-sample-pv.yaml file.
  5. Set the storage parameter to the number of gigabytes to allocate to the persistent volume.
    storage: 50Gi
  6. Update the hostPath parameter.
    • If using a local PV, set the path parameter to the local path.
        hostPath:
          path: "/u01/pv"
    • If using a remote PV, uncomment the nfs parameter and set the server and path parameters to the NFS server where the PV is located.
        nfs:
          server: 10.0.0.1
          path: "/mnt/share/pv"
  7. Use the kubectl create command to create the persistent volume and the persistent volume claim.
    kubectl create -f sample-domain1-weblogic-sample-pv.yaml
    kubectl create -f sample-domain1-weblogic-sample-pvc.yaml
  8. Use the kubectl get command to verify the persistent volume and persistent volume claim was created.
    [doc@docker:occas-persistant-volume]$ kubectl get pv -n sample-domain1-ns
    NAME                                CAPACITY   ACCESS MODES   RECLAIM POLICY   STATUS   CLAIM                                                  STORAGECLASS                                   REASON   AGE
    sample-domain1-weblogic-sample-pv   50Gi       RWX            Retain           Bound    sample-domain1-ns/sample-domain1-weblogic-sample-pvc   sample-domain1-weblogic-sample-storage-class            23m
    [doc@docker:occas-persistant-volume]$ kubectl get pvc -n sample-domain1-ns
    NAME                                 STATUS   VOLUME                              CAPACITY   ACCESS MODES   STORAGECLASS                                   AGE
    sample-domain1-weblogic-sample-pvc   Bound    sample-domain1-weblogic-sample-pv   50Gi       RWX            sample-domain1-weblogic-sample-storage-class   8m11s
    [doc@docker:occas-persistant-volume]$

Deploy the Replicated Domain

The Converged Application Server replicated domain is a logically related group of resources. Domains include the administration server and all managed servers. Converged Application Server domains extend Oracle WebLogic Server domains to support SIP and other telecommunication protocols.

  1. Navigate to the occas8/dockerfiles/8.1.0.0.0/occas-domain-home-on-pv directory.
  2. Run the create-weblogic-credentials.sh script to create the Secret for Weblogic.

    Kubernetes Secrets contain sensitive information like passwords. See Secrets.

    ./create-weblogic-credentials.sh -u weblogic -p <password> -n sample-domain1-ns -d sample-domain1 -s sample-domain1-weblogic-credentials
  3. Navigate to the domain-home-on-pv folder.
    cd ~/occas8/dockerfiles/8.1.0.0.0/occas-domain-home-on-pv/domain-home-on-pv
  4. Open the create-domain-inputs.yaml file.
  5. Set the following parameters.
    • domainHome—If you set the path parameter of the persistent volume to /u01/pv, then set the domainHome parameter to /u01/pv/domains/sample-domain1.
    • logHome—If you set the path parameter of the persistent volume to /u01/pv, then set the logHome parameter to /u01/pv/logs/sample-domain1.
    • domainPVMountPath—The domainPVMountPath parameter should match the path parameter of the persistent volume.
  6. Use the create-domain.sh script to create the domain.
    The command requires two arguments: the input YAML file and the output directory.
    ./create-domain.sh \
        -i create-domain-inputs.yaml \
        -o ~/occas8/dockerfiles/8.1.0.0.0/occas-domain-home-on-pv/domain-home-on-pv
  7. Navigvate to the sample-domain1 folder.
    cd weblogic-domains/sample-domain1/
  8. Deploy the WebLogic domain in the Kubernetes cluster.
    kubectl apply -f domain.yaml
    The domain will now be managed by the Weblogic Operator.
  9. Open a browser and navigate to http://<IP address>:30701/console to visit the WebLogic Server's management interface.

For information on building a custom application router, see Configuring a Custom Application Router in the Developer Guide.

Modify the Domain File

For quick, on-demand changes to your domain, modify the domain.yaml file directly and use kubectl to apply your changes. By modifying the domain file you can scale up or down the number of managed servers, change JMV options, or update the mountPath for your PV.

Follow the steps below to manually add a second managed server.
  1. Navigate to the sample-domain1 directory.
    cd ~/occas81/dockerfiles/8.1.0.0.0/occas-domain-home-on-pv/domain-home-on-pv/weblogic-domains/sample-domain1
  2. Open the file domain.yaml.
  3. Set the replicatas attribute to the number of managed servers you want.
    For example:
    replicas: 2
  4. Reapply the domain.yaml file.
    kubectl apply -f domain.yaml

Monitoring Tools

Converged Application Server can integrate with several third-party monitoring tools.

  • The EFK stack—The EFK stack is the combination of Elasticsearch, FluentD, and Kibana working together to centralize log files for easy monitoring. FluentD gathers logs files from multiple nodes and sends them to Elasticsearch, which stores and indexes them, while Kibana provides the front-end web interface.
  • Prometheus and Grafana—Converged Application Server can use the WebLogic Monitoring Exporter to export Prometheus-compatible metrics that are then exposed to Grafana, which visualizes the metrics over time to provide futher insights into the data.

Deploy the EFK Stack

Customers may deploy the EFK stack to increase visibility into the state of their Converged Application Server instances. Once the EFK stack is deployed, the Kibana web interface displays multiple Converged Application Server metrics.

Note:

Converged Application Server does not require the EFK stack and its installation is optional.

Note:

The FluentD pod runs in the sample-domain1-ns namespace and the ElasticSearch and Kibana pods run in the sample-weblogic-operator-ns namespace.
  1. Download the Docker images for FluentD, busybox, ElasticSearch, and Kibana.
    podman pull fluent/fluentd-kubernetes-daemonset:v1.16-debian-elasticsearch8-1
    podman pull busybox
    podman pull logstash:8.7.1
    podman pull elasticsearch:8.7.1
    podman pull kibana:8.7.1
  2. Navigate to the occas81/dockerfiles/8.1.0.0.0/occas-efk-pv/FluentD/ directory.
  3. Open the file configmap.yml and confirm your domain and namespace settings.
    • weblogic.domainUID: sample-domain1
    • namespace: sample-domain1-ns

    These two parameters identify the domain and namespace where the EFK stack will be deployed. They must match the domainUID and namespace parameters from the create-domain-inputs.yaml file that you used to create the domain.

  4. Apply the FluentD ConfigMap.
    kubectl apply -f configmap.yml
  5. Open the file FluentD domain file fluentd.yml and set the following values.
    • weblogic.domainUID—Confirm this is the same value in the ConfigMap.
    • namespace—Confirm this is the same value in the ConfigMap.
    • LOG_PATH—Set the beginning of the value parameter to your persistent volume. This value should match the logHome parameter in the create-domain-inputs.yaml file.
        - name: LOG_PATH                                                                                                                                                                    
          value: /u01/pv/logs/sample-domain1
    • ADMIN_LOG_PATH—Set your admin log path.
        - name: ADMIN_LOG_PATH
          value: /u01/pv/logs/sample-domain1/servers/admin-server/logs
    • MS_LOG_PATH—Set your managed server log path.
        - name: MS_LOG_PATH
          value: /u01/pv/logs/sample-domain1/servers/managed-server*/logs
    • SIP_MESSAGES_LOG_PATH—Set the beginning of the value parameter to your persistent volume.
        - name: SIP_MESSAGES_LOG_PATH                                                                                                                                                                    
          value: /u01/pv/domains/sample-domain1/servers/managed-server*/logs/sip-messages*.log*
    • claimName—Confirm this matches your persistent volume claim
      claimName: sample-domain1-weblogic-sample-pvc
    • mountPath—Set the mount path for occas-domain-storage-volume to your persistent volume.

      Note:

      There is more than one mountPath parameter. Make sure you edit the mount path for occas-domain-storage-volume.
       - mountPath: /u01/pv
         name: occas-domain-storage-volume
  6. Base64 encode the values of elasticSearchHost and elasticSearchPort from the file weblogic-kubernetes-operator/kubernetes/charts/weblogic-operator/values.yaml.
    [k8smain:~]$ grep ^elasticSearch[HP] ~/weblogic-kubernetes-operator/kubernetes/charts/weblogic-operator/values.yaml 
    elasticSearchHost: "elasticsearch.sample-weblogic-operator-ns.svc.cluster.local"
    elasticSearchPort: 9200
    [k8smain:~]$ echo -n elasticsearch.sample-weblogic-operator-ns.svc.cluster.local | base64
    ZWxhc3RpY3NlYXJjaC5zYW1wbGUtd2VibG9naWMtb3BlcmF0b3ItbnMuc3ZjLmNsdXN0ZXIubG9j
    YWw=
    [k8smain:~]$ echo -n 9200 | base64
    OTIwMA==
    [k8smain:~]$ 
  7. Add those base64 encoded values to the sample-domain1-weblogic-credentials Kubernetes secret.
    kubectl edit secret sample-domain1-weblogic-credentials -n sample-domain1-ns

    The top of the resulting YAML:

    apiVersion: v1
    data:
      password: VGhpcyBpcyBub3QgcmVhbGx5IHRoZSBwYXNzd29yZC4K
      username: d2VibG9naWM=
      elasticsearchhost: ZWxhc3RpY3NlYXJjaC5zYW1wbGUtd2VibG9naWMtb3BlcmF0b3ItbnMuc3ZjLmNsdXN0ZXIubG9jYWw=
      elasticsearchport: OTIwMA==
    kind: Secret
    . . .
  8. Navigate to the weblogic-kubernetes-operator/kubernetes/samples/scripts/elasticsearch-and-kibana directory.
    cd ~/weblogic-kubernetes-operator/kubernetes/samples/scripts/elasticsearch-and-kibana
  9. Update the value of the namespace parameter in the file elasticsearch_and_kibana.yaml.

    Kibana and ElasticSearch must use the same namespace as the Kubernetes WebLogic Operator.

      namespace: "sample-weblogic-operator-ns"
      image: busybox       
      image: "elasticsearch:8.7.1"       
      image: "kibana:8.7.1"
  10. Deploy ElasticSearch and Kibana in the Kubernetes WebLogic Operator namespace.
    kubectl apply -f elasticsearch_and_kibana.yaml
  11. Verify the pods were created with the command kubectl get pods -n sample-weblogic-operator-ns.
    [k8smain]$ kubectl get pods -n sample-weblogic-operator-ns
    NAME                                 READY   STATUS    RESTARTS      AGE
    elasticsearch-f7b7c4c4-zkhp8         1/1     Running   2 (52s ago)   2m26s
    kibana-57f6685789-25zsn              1/1     Running   0             2m26s
    weblogic-operator-5789ddb9fc-jgdh6   2/2     Running   0             15h
  12. Enter the ElasticSearch pod and verify that ElasticSearch is running by making a curl request to "http://elasticsearch:9200/". Then exit the ElasticSearch pod.
    [k8smain]$ kubectl exec -it elasticsearch-f7b7c4c4-wd94v -n sample-weblogic-operator-ns -- /usr/bin/curl "http://elasticsearch:9200/"
    Defaulted container "elasticsearch" out of: elasticsearch, set-vm-max-map-count (init)
    {
      "name" : "elasticsearchhost1",
      "cluster_name" : "docker-cluster",
      "cluster_uuid" : "kkqeHA0LSUafAfHZ6MEktw",
      "version" : {
        "number" : "8.7.1",
        "build_flavor" : "default",
        "build_type" : "docker",
        "build_hash" : "f229ed3f893a515d590d0f39b05f68913e2d9b53",
        "build_date" : "2023-04-27T04:33:42.127815583Z",
        "build_snapshot" : false,
        "lucene_version" : "9.5.0",
        "minimum_wire_compatibility_version" : "7.17.0",
        "minimum_index_compatibility_version" : "7.0.0"
      },
      "tagline" : "You Know, for Search"
    }
  13. Deploy FluentD.
    kubectl apply -f ~/occas81/dockerfiles/8.1.0.0.0/occas-efk-pv/FluentD/fluentd.yml
  14. After a few minutes, verify the pods are running.
    [k8smain:~]$ kubectl get pods -n sample-domain1-ns
    NAME                                 READY   STATUS    RESTARTS   AGENAME                                                        READY   STATUS      RESTARTS   AGE
    fluentd-container-d658498c7-6bd7q    1/1     Running   0          87m
    sample-domain1-admin-server          1/1     Running   0          21h
    sample-domain1-managed-server1       1/1     Running   0          21h
  15. To view the Kibana interface, first use the kubectl describe service command to find the port number for Kibana. Then navigate to http://<IP address>:<port number>/status where <IP address> is the IP address of the master node.
    [k8smain]$ kubectl describe service kibana -n sample-weblogic-operator-ns
    Name:                     kibana
    Namespace:                sample-weblogic-operator-ns
    Labels:                   app=kibana
    Annotations:              <none>
    Selector:                 app=kibana
    Type:                     NodePort
    IP Family Policy:         SingleStack
    IP Families:              IPv4
    IP:                       10.96.76.176
    IPs:                      10.96.76.176
    Port:                     <unset>  5601/TCP
    TargetPort:               5601/TCP
    NodePort:                 <unset>  32488/TCP
    Endpoints:                172.16.145.212:5601
    Session Affinity:         None
    External Traffic Policy:  Cluster
    Events:                   <none>
  16. From the Kibana interface, click Management, and then Index Management.
    The following default patterns are available with Converged Application Server:

    Table 1-1 Index Patterns

    Name Description
    occas-generic-index Fluentd reads all log files under the log folder logHome and exports to this index.
    engine-stdout-log Fluentd reads Converged Application Server engine stdout logs and filters 'stdout'.
    admin-server-critical-warnings Fluentd reads Converged Application Server admin-server logs and filters critical/warning messages.
    engine-all-log Fluentd reads all engine logs and exports to this index.
    occas-log Fluentd reads engine logs and filters 'wlss' or 'msg' to get Converged Application Server specific logs.
    occas-error-log Fluentd reads engine logs and filters 'error' to get Converged Application Server error logs.
    occas-warning-log Fluentd reads engine logs and filters 'warning' to get Converged Application Server warning logs.
    occas-sip-message-log Fluentd reads engine/sip-message logs and filters 'CSeq' to get Converged Application Server SIP logs.
  17. To create your own index patterns:
    1. From the Kibana interface, click Management, and then Stack Management, and then Kibana, and then Data Views, and then Create Data View.
    2. Enter a name.
    3. Enter an Index pattern.
    4. Click Save data view to Kibana.

    After creating an index pattern, click Discover to view the log.

Deploy Prometheus and Grafana

Prometheus and Grafana are optional third-party monitoring tools that you can install to gather metrics on your Converged Application Server installation. When both are installed, Converged Application Server uses the WebLogic Monitoring Exporter to export Prometheus-compatible metrics that are then exposed to Grafana, which visualizes the metrics over time to provide futher insights into the data.

Figure 1-1 Cluster Architecture with Monitoring Tools
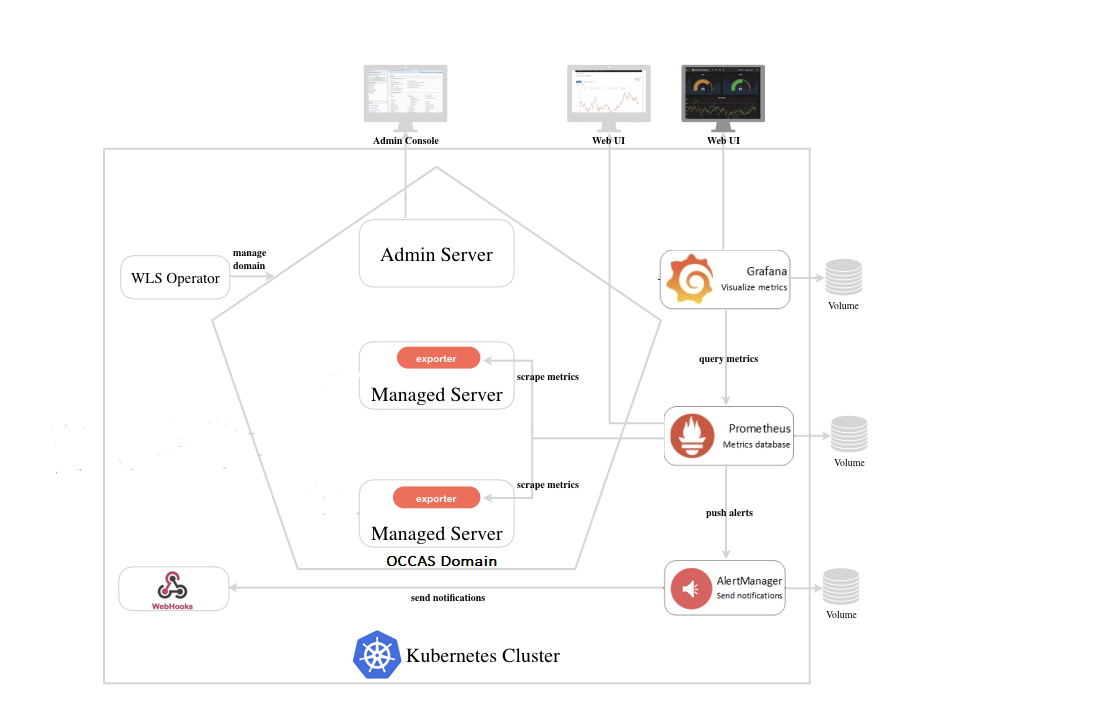
Cluster Architecture with Monitoring Tools
  1. Pull the WebLogic Monitoring Exporter Docker image.
    podman pull ghcr.io/oracle/weblogic-monitoring-exporter:2.1.3
  2. Navigate to the directory occas81/dockerfiles/8.1.0.0.0/monitoring.
  3. Open the file domain.yaml and confirm the image, namespace,domainUID, and domainHome are correct.
    • image: "oracle/occas:8.1.0.0.0-generic-8"
    • namespace: sample-domain1-ns
    • weblogic.domainUID: sample-domain1
    • domainHome: /u01/pv/domains/sample-domain1
  4. Depoy the WebLogic Monitoring Exporter .
    kubectl apply -f domain.yaml
  5. Configure the Persistent Volume (PV) paths for Prometheus and Grafana.

    In this example, /u01/pv is the root PV directory.

    export PV_ROOT=/u01/pv
    sed -i 's@%PV_ROOT%@'"$PV_ROOT"'@' prometheus/persistence.yaml
    sed -i 's@%PV_ROOT%@'"$PV_ROOT"'@' prometheus/alert-persistence.yaml
    sed -i 's@%PV_ROOT%@'"$PV_ROOT"'@' grafana/persistence.yaml
  6. Create a new namespace monitoring.
    kubectl create ns monitoring
  7. Deploy the PV and PVC files for Prometheus and Grafana.
    kubectl apply -f prometheus/persistence.yaml
    kubectl apply -f prometheus/alert-persistence.yaml
    kubectl apply -f grafana/persistence.yaml
  8. Add the Helm repositories for Prometheus and Grafana.
    helm repo add prometheus-community https://prometheus-community.github.io/helm-charts
    helm repo add grafana https://grafana.github.io/helm-charts
  9. Update the extraScrapeConfigs/basic_auth values in the file prometheus/values.yaml.
  10. Install the Prometheus chart.
    helm install --wait prometheus \
      --namespace monitoring \
      --values prometheus/values.yaml prometheus-community/prometheus \
      --version 17.0.0
  11. Create the Grafana administrative credentials.
    kubectl --namespace monitoring create secret generic grafana-secret \
      --from-literal=username=admin --from-literal=password=<password>
  12. Install the Grafana chart.
    helm install grafana \
      --namespace monitoring \
      --values grafana/values.yaml grafana/grafana \
      --version 6.52.9
  13. (Optional) In versions 4.0.5 and higher, the Weblogic Kubernetes Operator sets the enableRest parameter to false. To enable it for autoscaling managed servers, run this command:
    helm upgrade sample-weblogic-operator weblogic-operator/weblogic-operator  \
      --version 4.0.5 \
      --namespace sample-weblogic-operator-ns \
      --set serviceAccount=sample-weblogic-operator-sa \
      --set "enableRest=true" \
      --wait

Refer to the Prometheus documentation and the Grafana documentation for how to configure and use those products.

Configure Grafana Data Sources

Once the WebLogic Monitoring Exporter starts exporting Converged Application Server metrics to Prometheus, configure Grafana to use Prometheus as its own source of data.

  1. Navigate to the Grafana web interface.
    The URL is http://<IP address>:80/.
  2. Click Configuration, and then Data Source, and then Add Data Source .
  3. Select Prometheus.
  4. Fill in the URL with the port number.
    The default URL for Prometheus is http://<IP address>:80/.
  5. Click Save & test.
  6. Click Dashboards, and then Manage, and then Import .
  7. On the Import page, click Upload .json File and upload the file oiccas81/dockerfiles/8.1.0.0.0/monitoring/grafana/OCCAS-DashBoard.json.

Apply a Patch

The Dockerfile in the occas81/dockerfiles/8.1.0.0.0/patch-opatch-update directory extends the Converged Application Server image by updating OPatch and applying a patch. If an update is released for the Converged Application Server or one of its components (like WebLogic or Confluence), use OPatch to patch your system.

See Security Alerts to register for security notifications.
  1. Log in to My Oracle Support.
  2. Download the patches for the Converged Application Server or one of its components.
  3. Identify the top-level folder name within the archive file.
    Syntax:
    unzip -l <zip file> | head

    For example:

    [user@host:~]$ unzip -l p33286174_141100_Generic.zip | head
    Archive:  p33286174_141100_Generic.zip
      Length      Date    Time    Name
    ---------  ---------- -----   ----
            0  09-22-2021 13:08   33286174/
            0  09-21-2021 19:11   33286174/etc/
            0  09-21-2021 19:11   33286174/etc/config/
            0  09-21-2021 19:11   33286174/files/
            0  09-21-2021 19:11   33286174/files/coherence/
            0  09-21-2021 19:11   33286174/files/coherence/bin/
            0  09-21-2021 19:11   33286174/files/coherence/lib/

    In this example, the top-level folder is 33286174.

  4. Move the patch files into the occas81/dockerfiles/8.1.0.0.0/patch-opatch-update directory.
    For example:
    mv ~/Downloads/p28186730_139426_Generic.zip ~/occas81/dockerfiles/8.1.0.0.0/patch-opatch-update
  5. Update PATCH_PKG variables in the Dockerfile to match the filename of patch files.
    ENV PATCH_PKG0="p28186730_139426_Generic.zip"
    ENV PATCH_PKG1="p33286174_141100_Generic.zip"
    ENV PATCH_PKG2="p33416881_141100_Generic.zip"
  6. Update the /u01/<folder> directories within the Dockerfile with the top-level folder names of the patches you're installing.
  7. Build the image.
    podman build --force-rm=true --no-cache=true -t oracle/occas:occas-generic-oct2021cpupatch-upgrade -f Dockerfile .