Exadata Database Machine Topology
Database Machine management simplifies monitoring and managing tasks by integrating all hardware and software components into one entity. You do not need to monitor each target individually, but instead you can view the whole Exadata Database Machine as a single target. You can view all critical issues in the system, monitor performance, and drill down to individual targets from the Database Machine target home page.
The following topology topics are presented in this section:
Use the Topology page of Database Machine to view the topology of the system by Cluster or by Database. Clusters are a complete software system starting with a RAC database, the underlying ASM, and CRS. Clusters define one logical entity that is interconnected. The Database Machine could include several clusters, one cluster, or could just be a number of individual databases. While hardware racks define the hardware topology of the Database Machine, clusters define the logical or system topology of the Database Machine.
You can view the Topology by Cluster or Database. Click an element in the Topology and view alert data associated with the element.
You can monitor all components of the Database Machine. Database Machine monitors all subcomponent targets, whether hardware or software. This includes the database, ASM, CRS, hosts, Exadata and the InfiniBand network.
To view the topology of an existing Database Machine target:
Drilling Down to Individual Targets of Database Machine
You can drill down immediately to a subcomponent target of the Database Machine (such as RAC, a database instance, or an Exadata Storage Server).
To drill down to individual targets:
Viewing Virtual Exadata Targets
Once discovered, the Exadata plug-in shows the virtual machines monitored by Enterprise Manager:

Note:
The schematic diagram in the Database Machine home page is based on the content of the databasemachine.xml file found during discovery. The virtual platforms (Dom0) are displayed as compute nodes in the rack in the schematic diagram.
The Database Machine Software topology diagram will not display the physical Oracle Server, virtual Oracle Server targets (DomU), and Virtual Platform target (Dom0) targets. However, it will continue to show the host targets which are running in DomU.
The Software tab for the Exadata Database Machine target shows all clusters, ASM, and Database targets in the whole physical Database Machine grouped by clusters:

Viewing Critical Hardware Information for the Database Machine
You can view critical metrics for all the hardware subcomponents of the Database Machine such as DB hosts, Exadata Storage Servers, InfiniBand switches and so on. These metrics vary for different component targets. For example, database server nodes and Exadata servers include the CPU, I/O, and storage metrics.
To view critical hardware-centric information for the entire Database machine:
Viewing Exadata Resource Utilization
Access the utilization graphs of compute and storage resources for cluster placement, database placement, database CPU utilization, database memory utilization, database I/O utilization, and disk group space allocation. From the Oracle Exadata Database Machine home page, select the type of resources and view the graphs accordingly.
Compute Resources
From Oracle Exadata Database Machine home page, click the Database Machine drop down > select Resource Utilization > click Compute Resources.
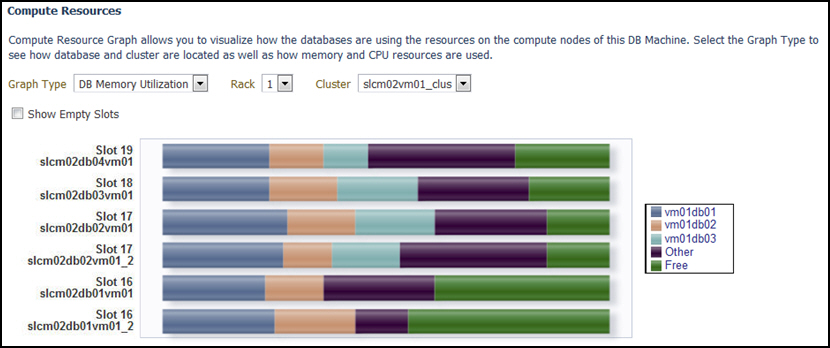
The following compute resource allocation graphs are available in virtualized Exadata. These graphs are dependent on the virtual machine hierarchy and metric data from the VI plug-in:
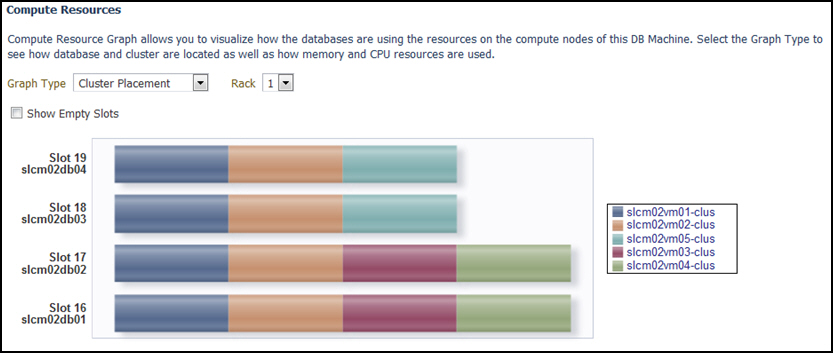
Cluster Placement
This graph shows the ClusterWare cluster placement on physical servers in a particular Exadata Database Machine rack. Since this is a placement graph, the widths of the data series reflect the number of clusters on the physical server that has the most number of clusters.
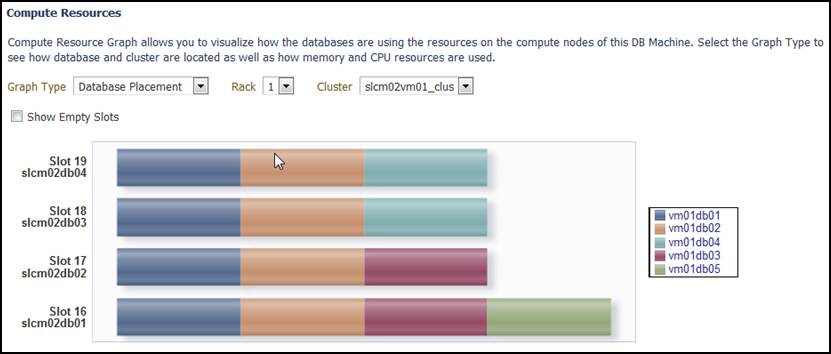
Database Placement
This graph shows the database placement on physical servers in a particular Exadata Database Machine rack for a particular DB cluster. Since this is a placement graph, the widths of the data series reflect the number of DB on the physical server that has the most number of databases for a particular DB cluster.
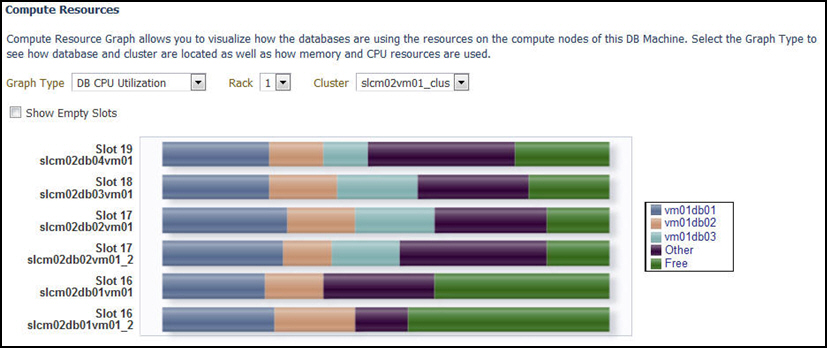
Database CPU Utilization
This graph shows the database CPU utilization per database per VM host for a particular DB cluster.
Storage Resources
From Oracle Exadata Database Machine home page, click the Database Machine drop down > select Resource Utilization > click Storage Resources.
The following storage resource allocation graphs are available in virtualized Exadata for Exadata Storage Servers and Exadata Storage Server Grid:
Exadata Storage Servers
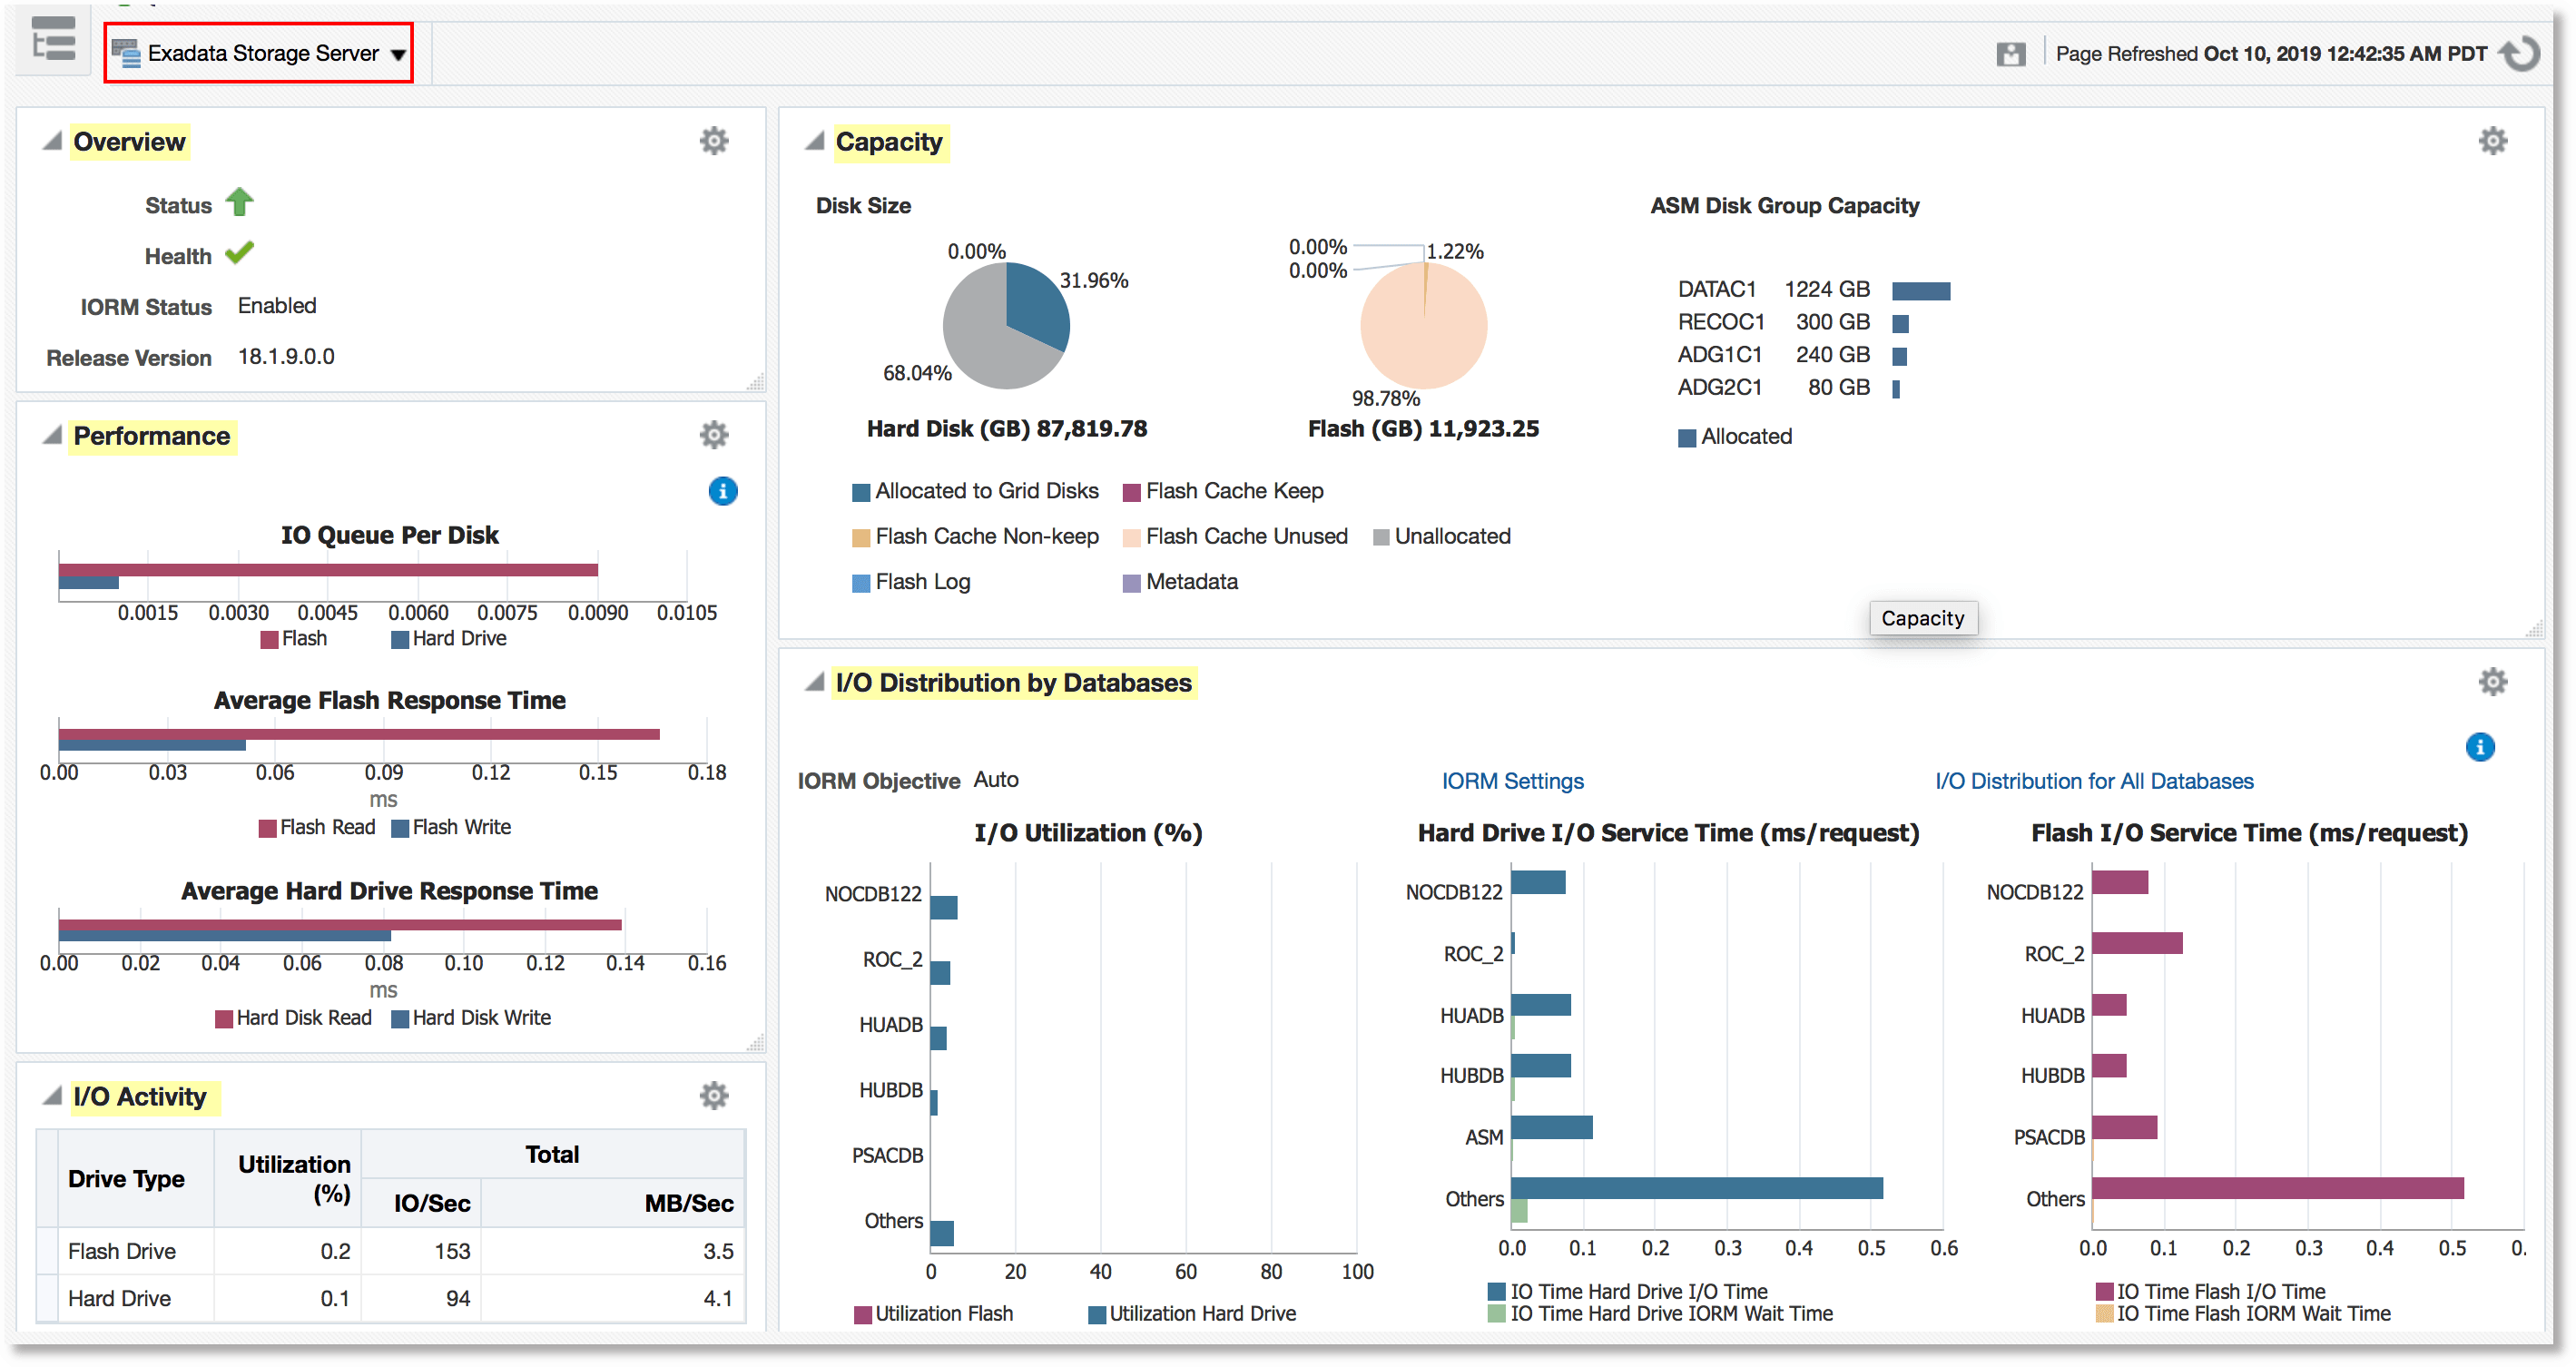
Exadata Storage Server home page has the following sections that provide graphs and detailed information about status and performance of the target:
-
Overview: Provides details of Exadata Storage Server availability status, health details, I/O Resource Manager status, and server version
-
Performance: Provides hard drive and flash response time to IO requests, number of I/O’s in the queue averaged per disk type.
-
Capacity: Provides capacity details of different storage types available on the storage server
-
Total available capacity of Hard drive and Flash
-
Flash Cache space information about keep objects, non-keep objects, unused space. This section also provides information about the size of the flash used for logging.
-
Capacity information for ASM disk groups
-
-
I/O Activity: Provides performance information like Utilization, Latency, and Throughput for that available storage drives. This section also provides Flash Cache read and write, Smart Scan I/O throughput, InfiniBand Network throughput, Smart Log Efficiency, and IORM Boost.
-
I/O Distribution by Database: Displays information about databases that are ranked top 5 in I/O Utilization for the available storage drives. other is an aggregation of remaining databases. This section also displays the Hard Drive I/O Service Time and Flash I/O Service Time for top 5 databases and other databases.
-
Incidents and Problems: Lists alerts for the target
Database I/O Utilization
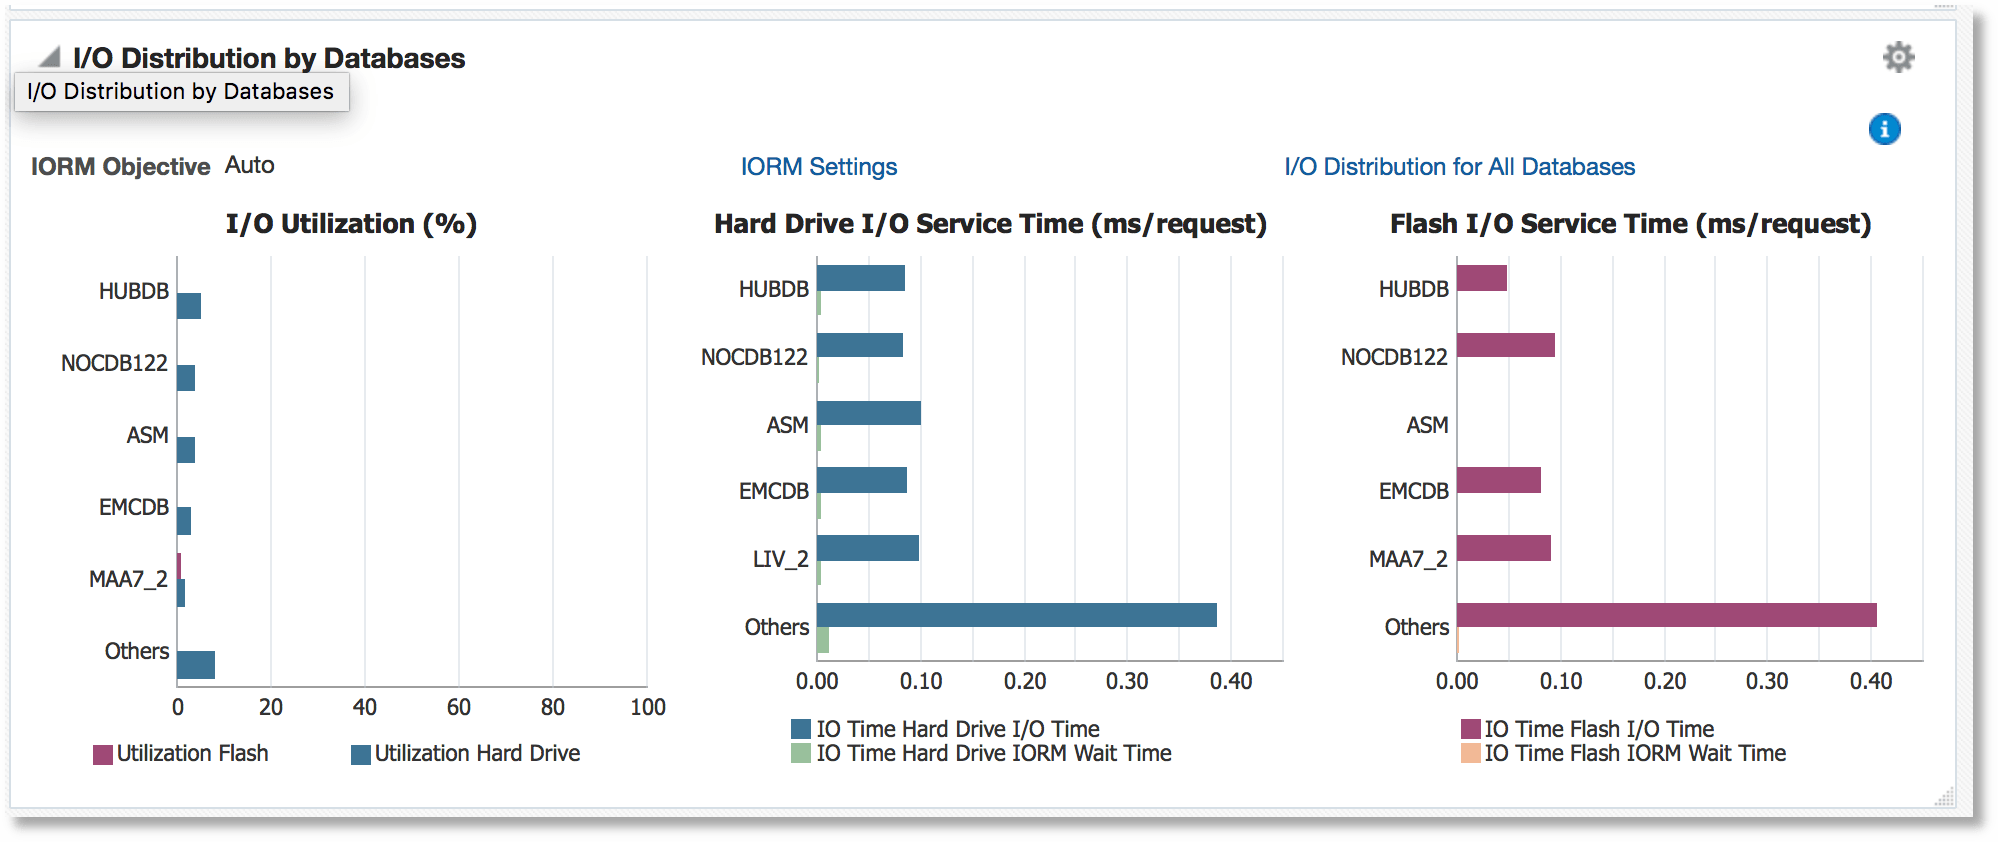
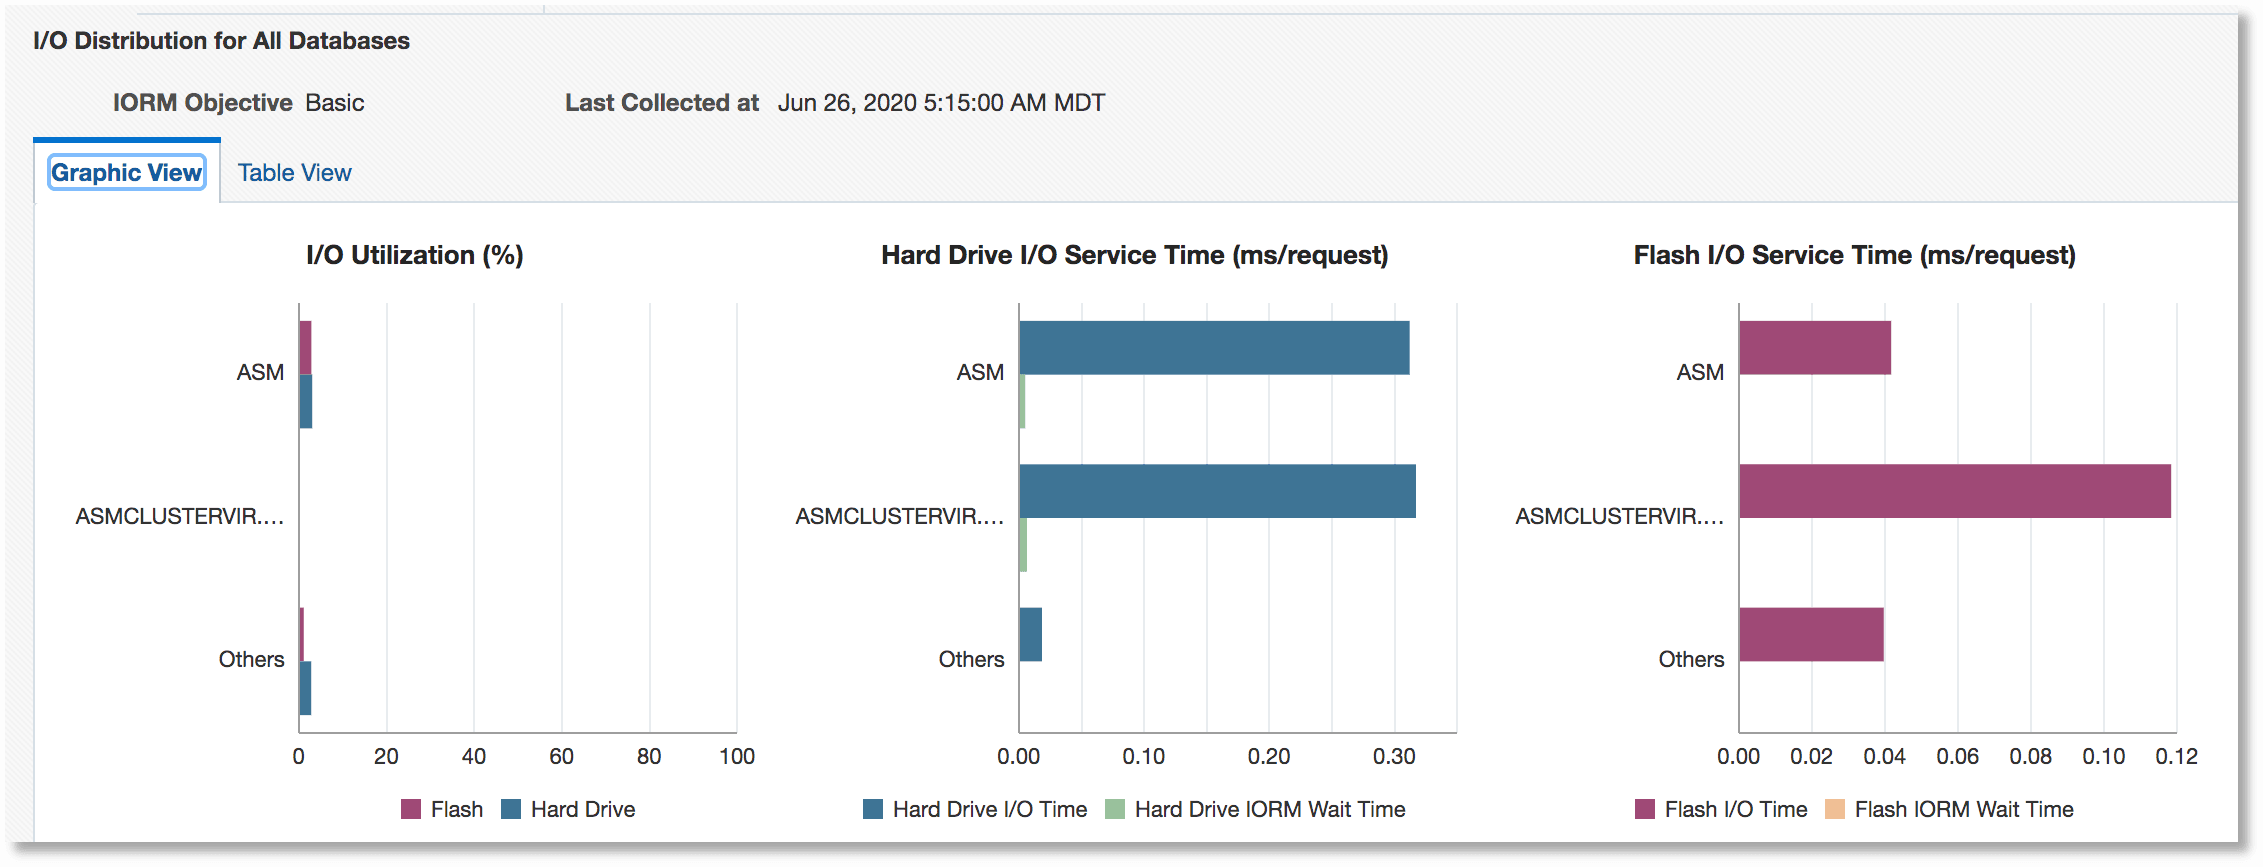
The Database I/O utilization graph shows the database I/O utilization per Exadata Storage Server of this Exadata Database Machine.
To access the Database I/O Utilization graph, from the Exadata Storage Servers home page, go to the section I/O Distribution by Databases > click I/O Distribution for All Databases.
I/O Distribution by Databases:
I/O Distribution for All Databases - Graphic View:
I/O Distribution for All Databases - Tabular View:

Workload Distribution by Databases
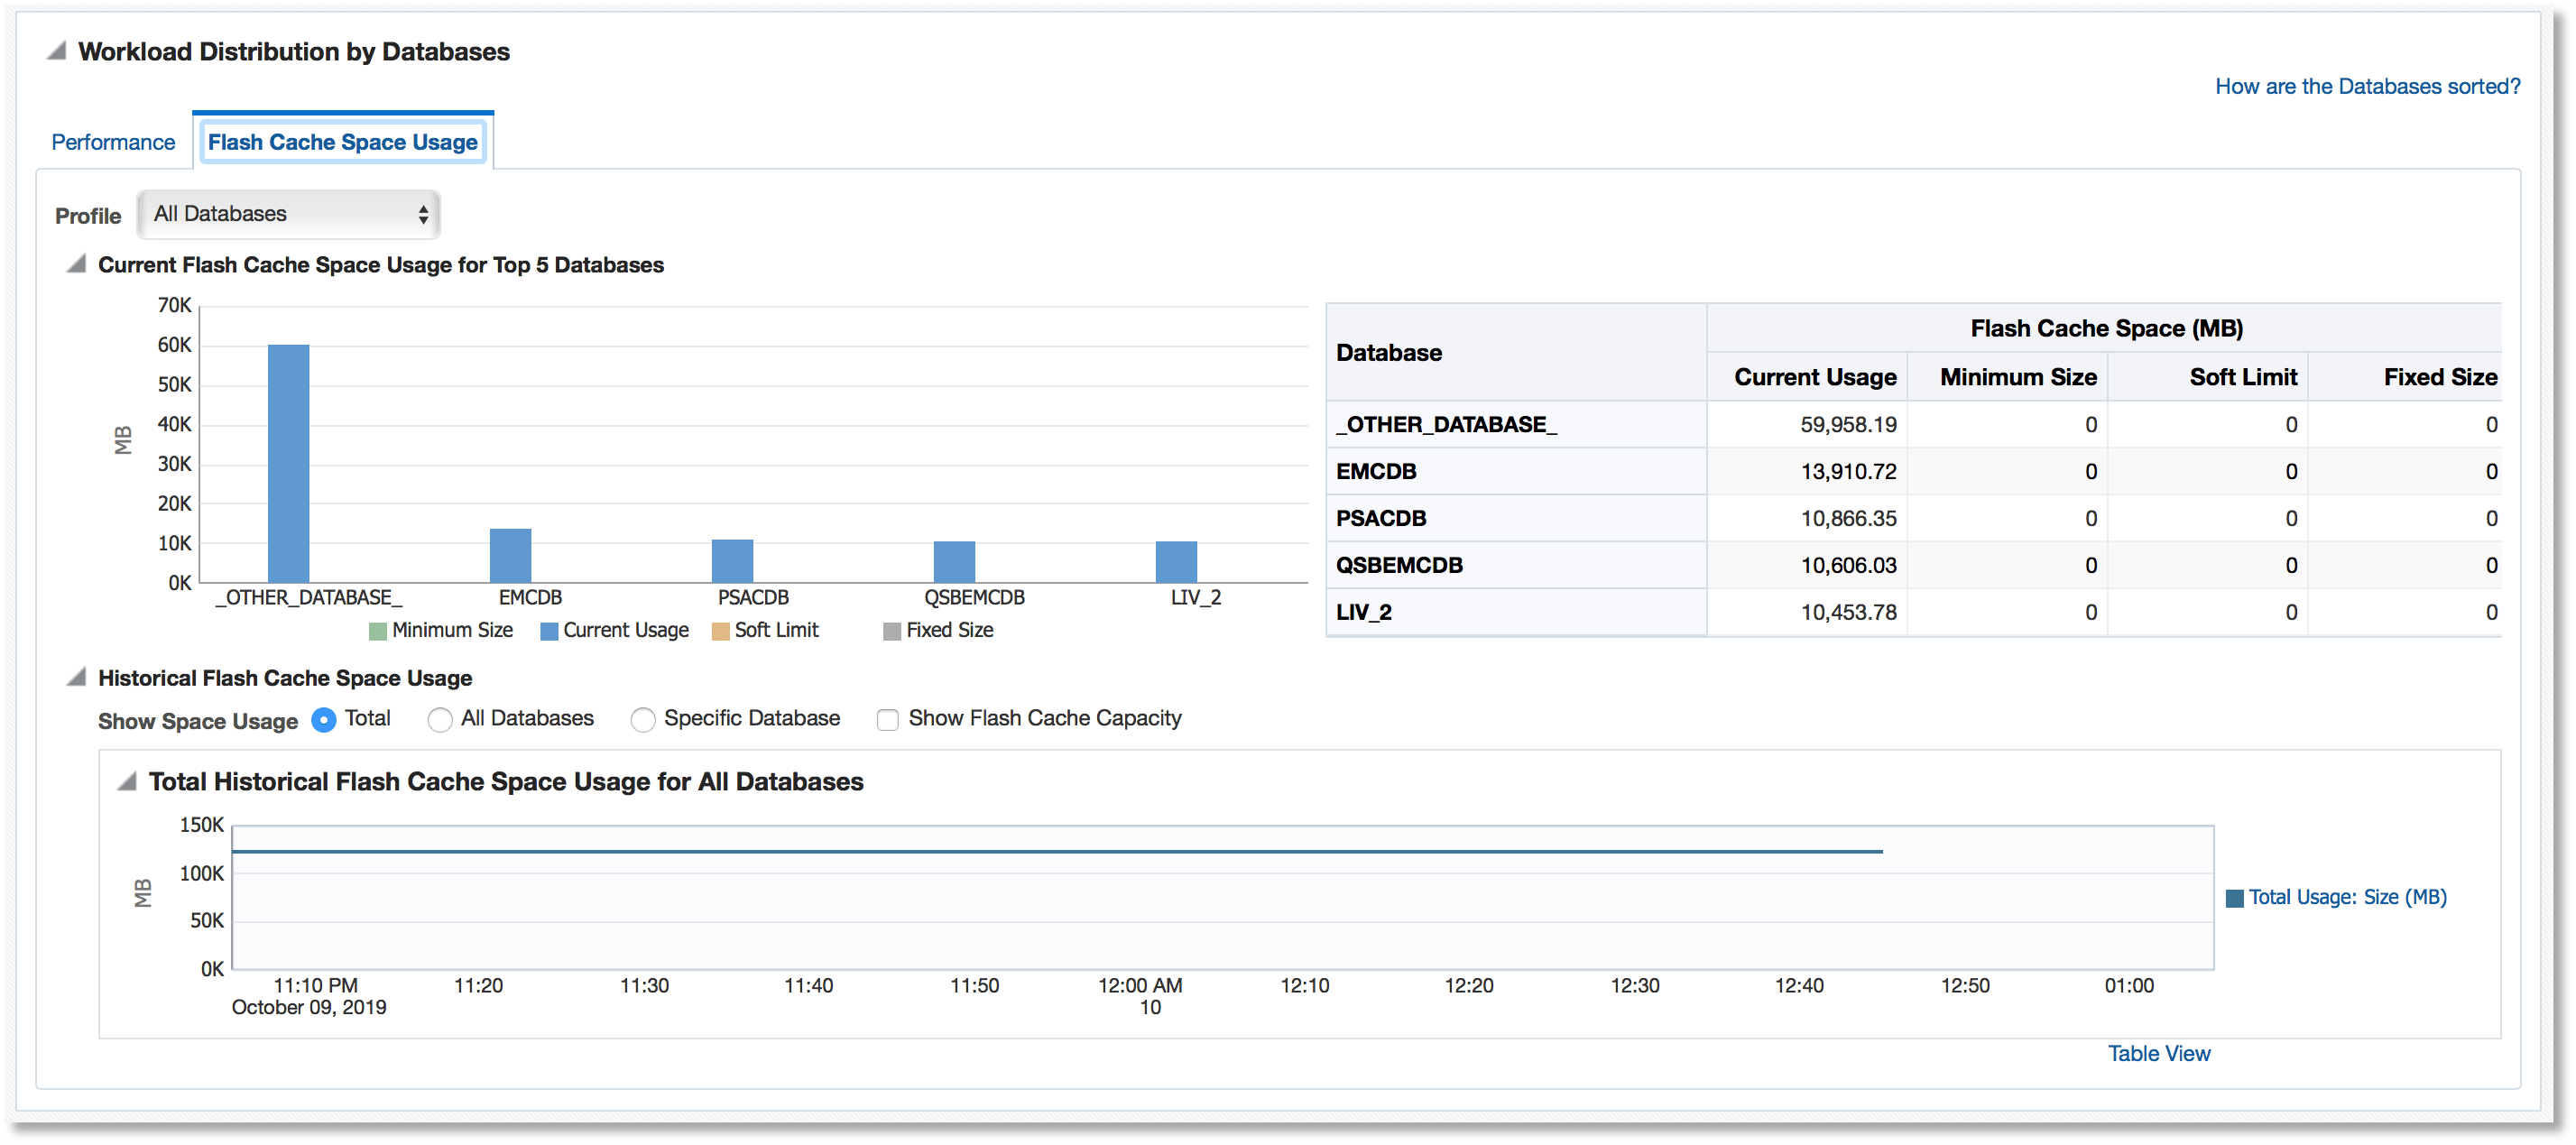
The Workload Distribution by Databases graphs show database workload performance on the hard drive and flash and the flash cache space usage.
To access the Workload Distribution by Databases graphs, from the Exadata Storage Servers home page, go to the section I/O Distribution by Databases > click IORM Settings.
To access the Flash Cache Space Usage graph, click the Flash Cache Space Usage tab.
Flash Cache Space Usage:
To view the graphs that correspond to the performance of hard drives and Flash, click the Performance tab.
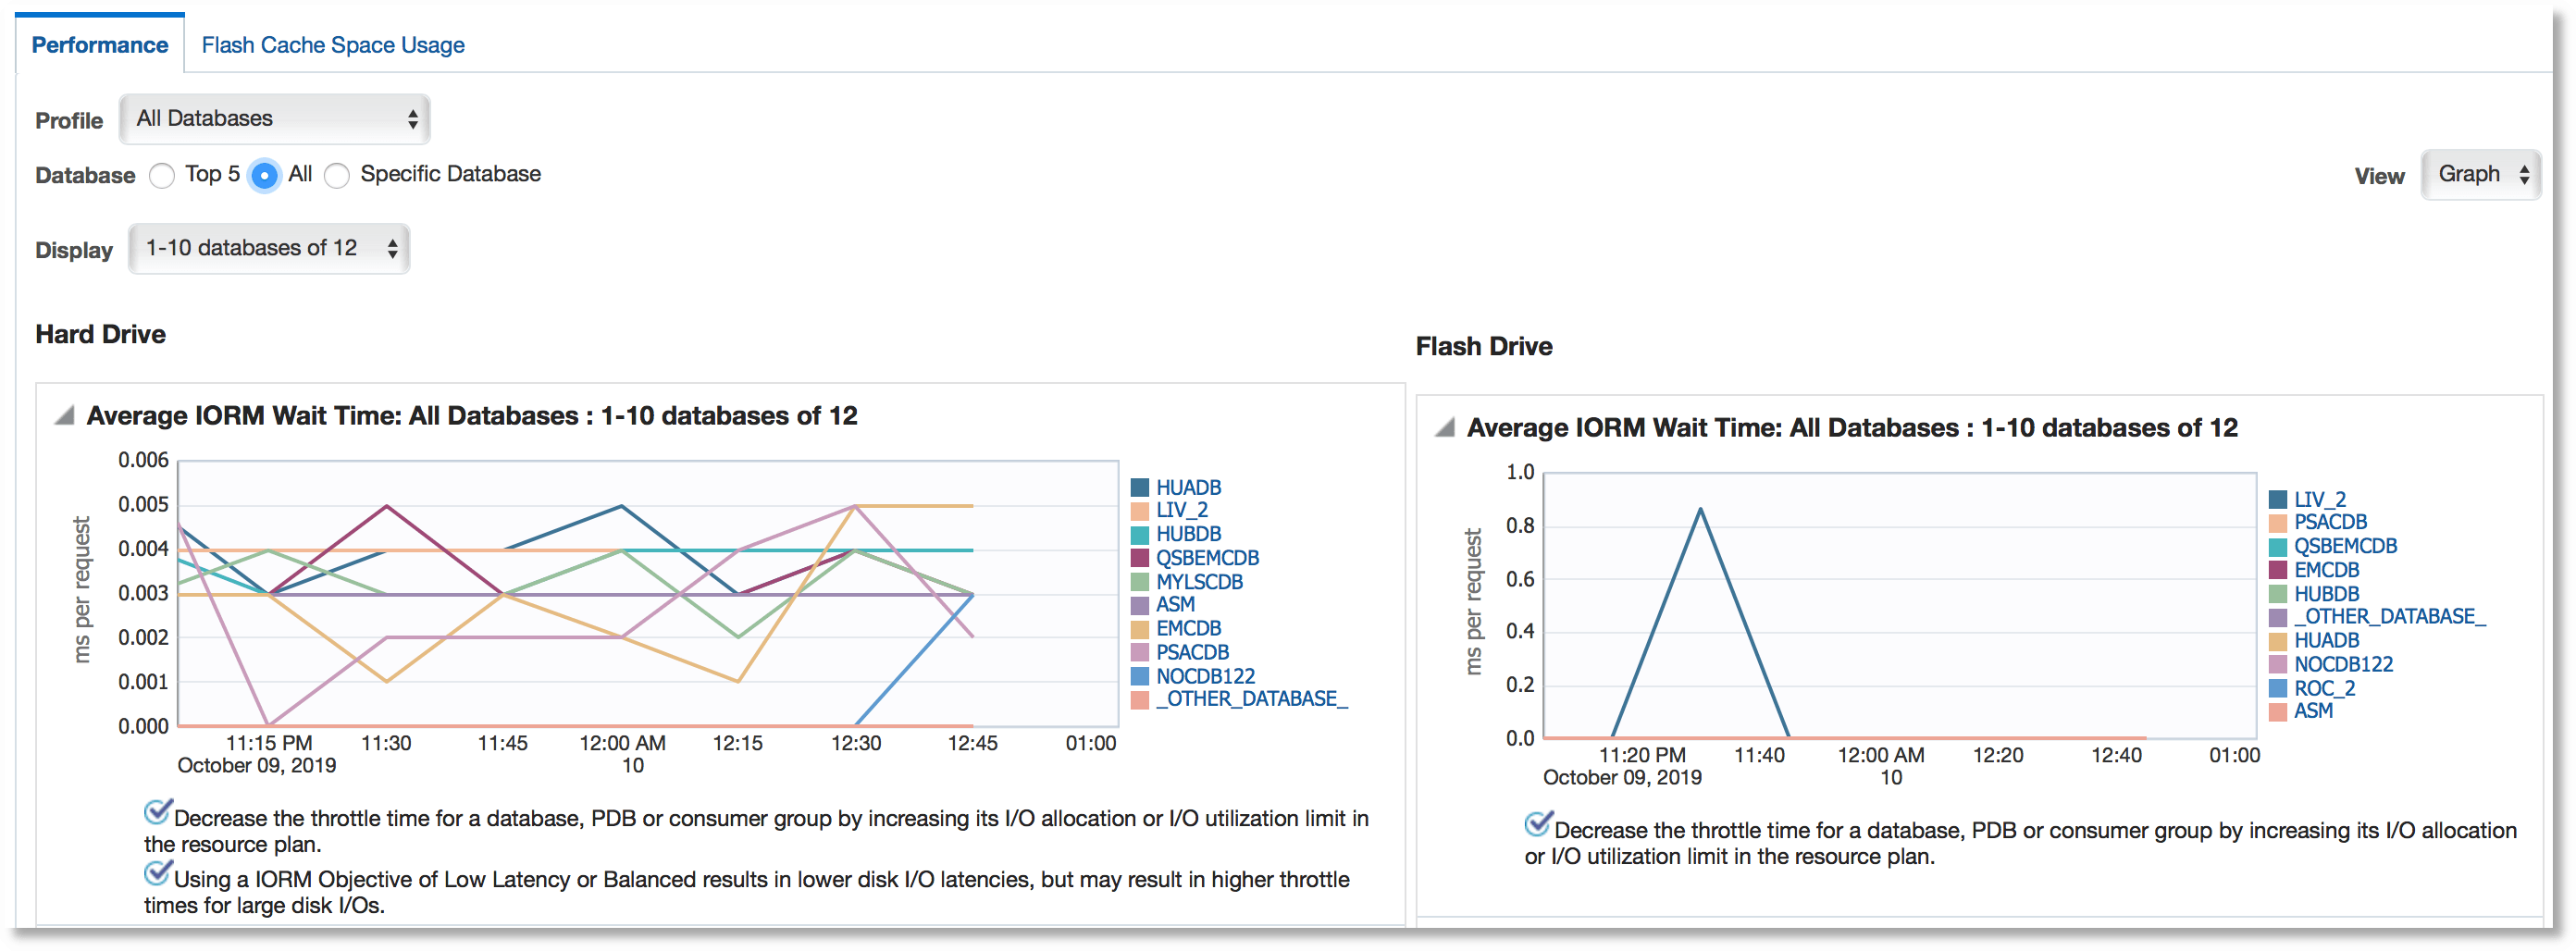
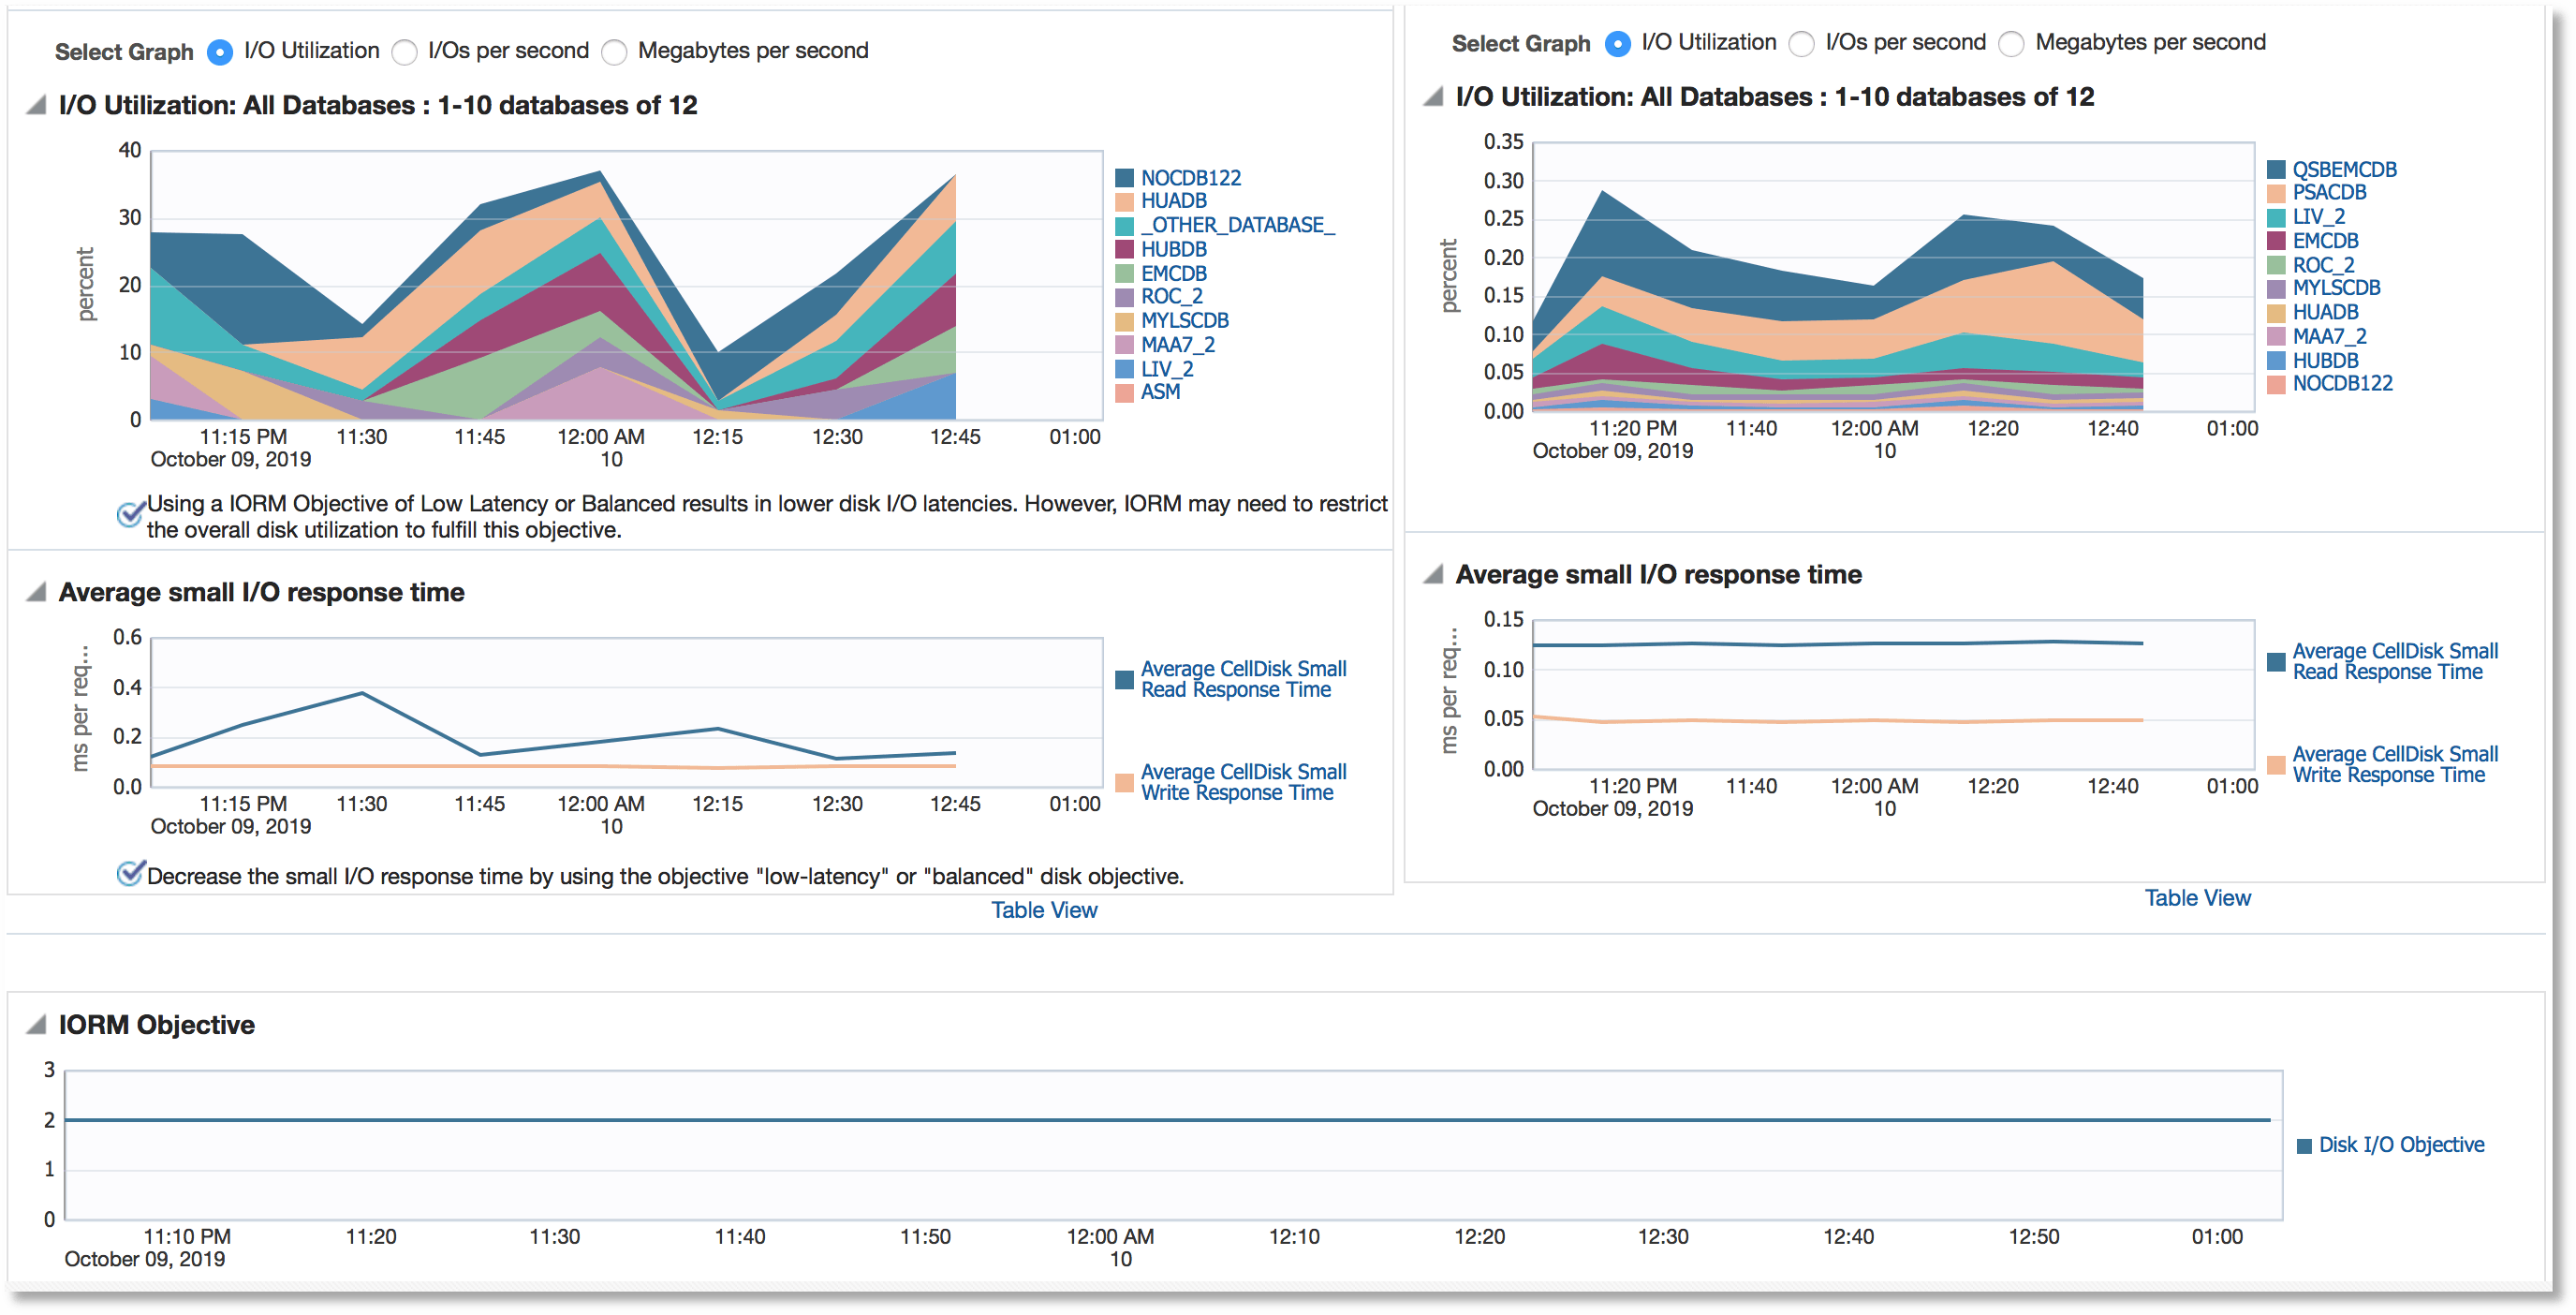
This section provides database workload performance on Hard Drive and Flash. You can filter databases based on their workload performance rankings. You can view the graphs for the filters like top 5 databases, rank based pagination, or a specific database. You can drill down from database workload performance monitoring to pluggable database and consumer groups. Following are some of the example graphs:
IORM Wait Time for All Databases (Hard Drive and Flash Drive):
I/O Utilization and Average small I/O response time for All Databases (Hard Drive and Flash Drive):
Exadata Storage Server Grid
Exadata Storage Server Grid home page displays the aggregated status and performance data for all the Exadata Storage Servers. The sections are similar to those that are listed for individual Exadata Storage Server targets.
An example Exadata Storage Server Grid home page:
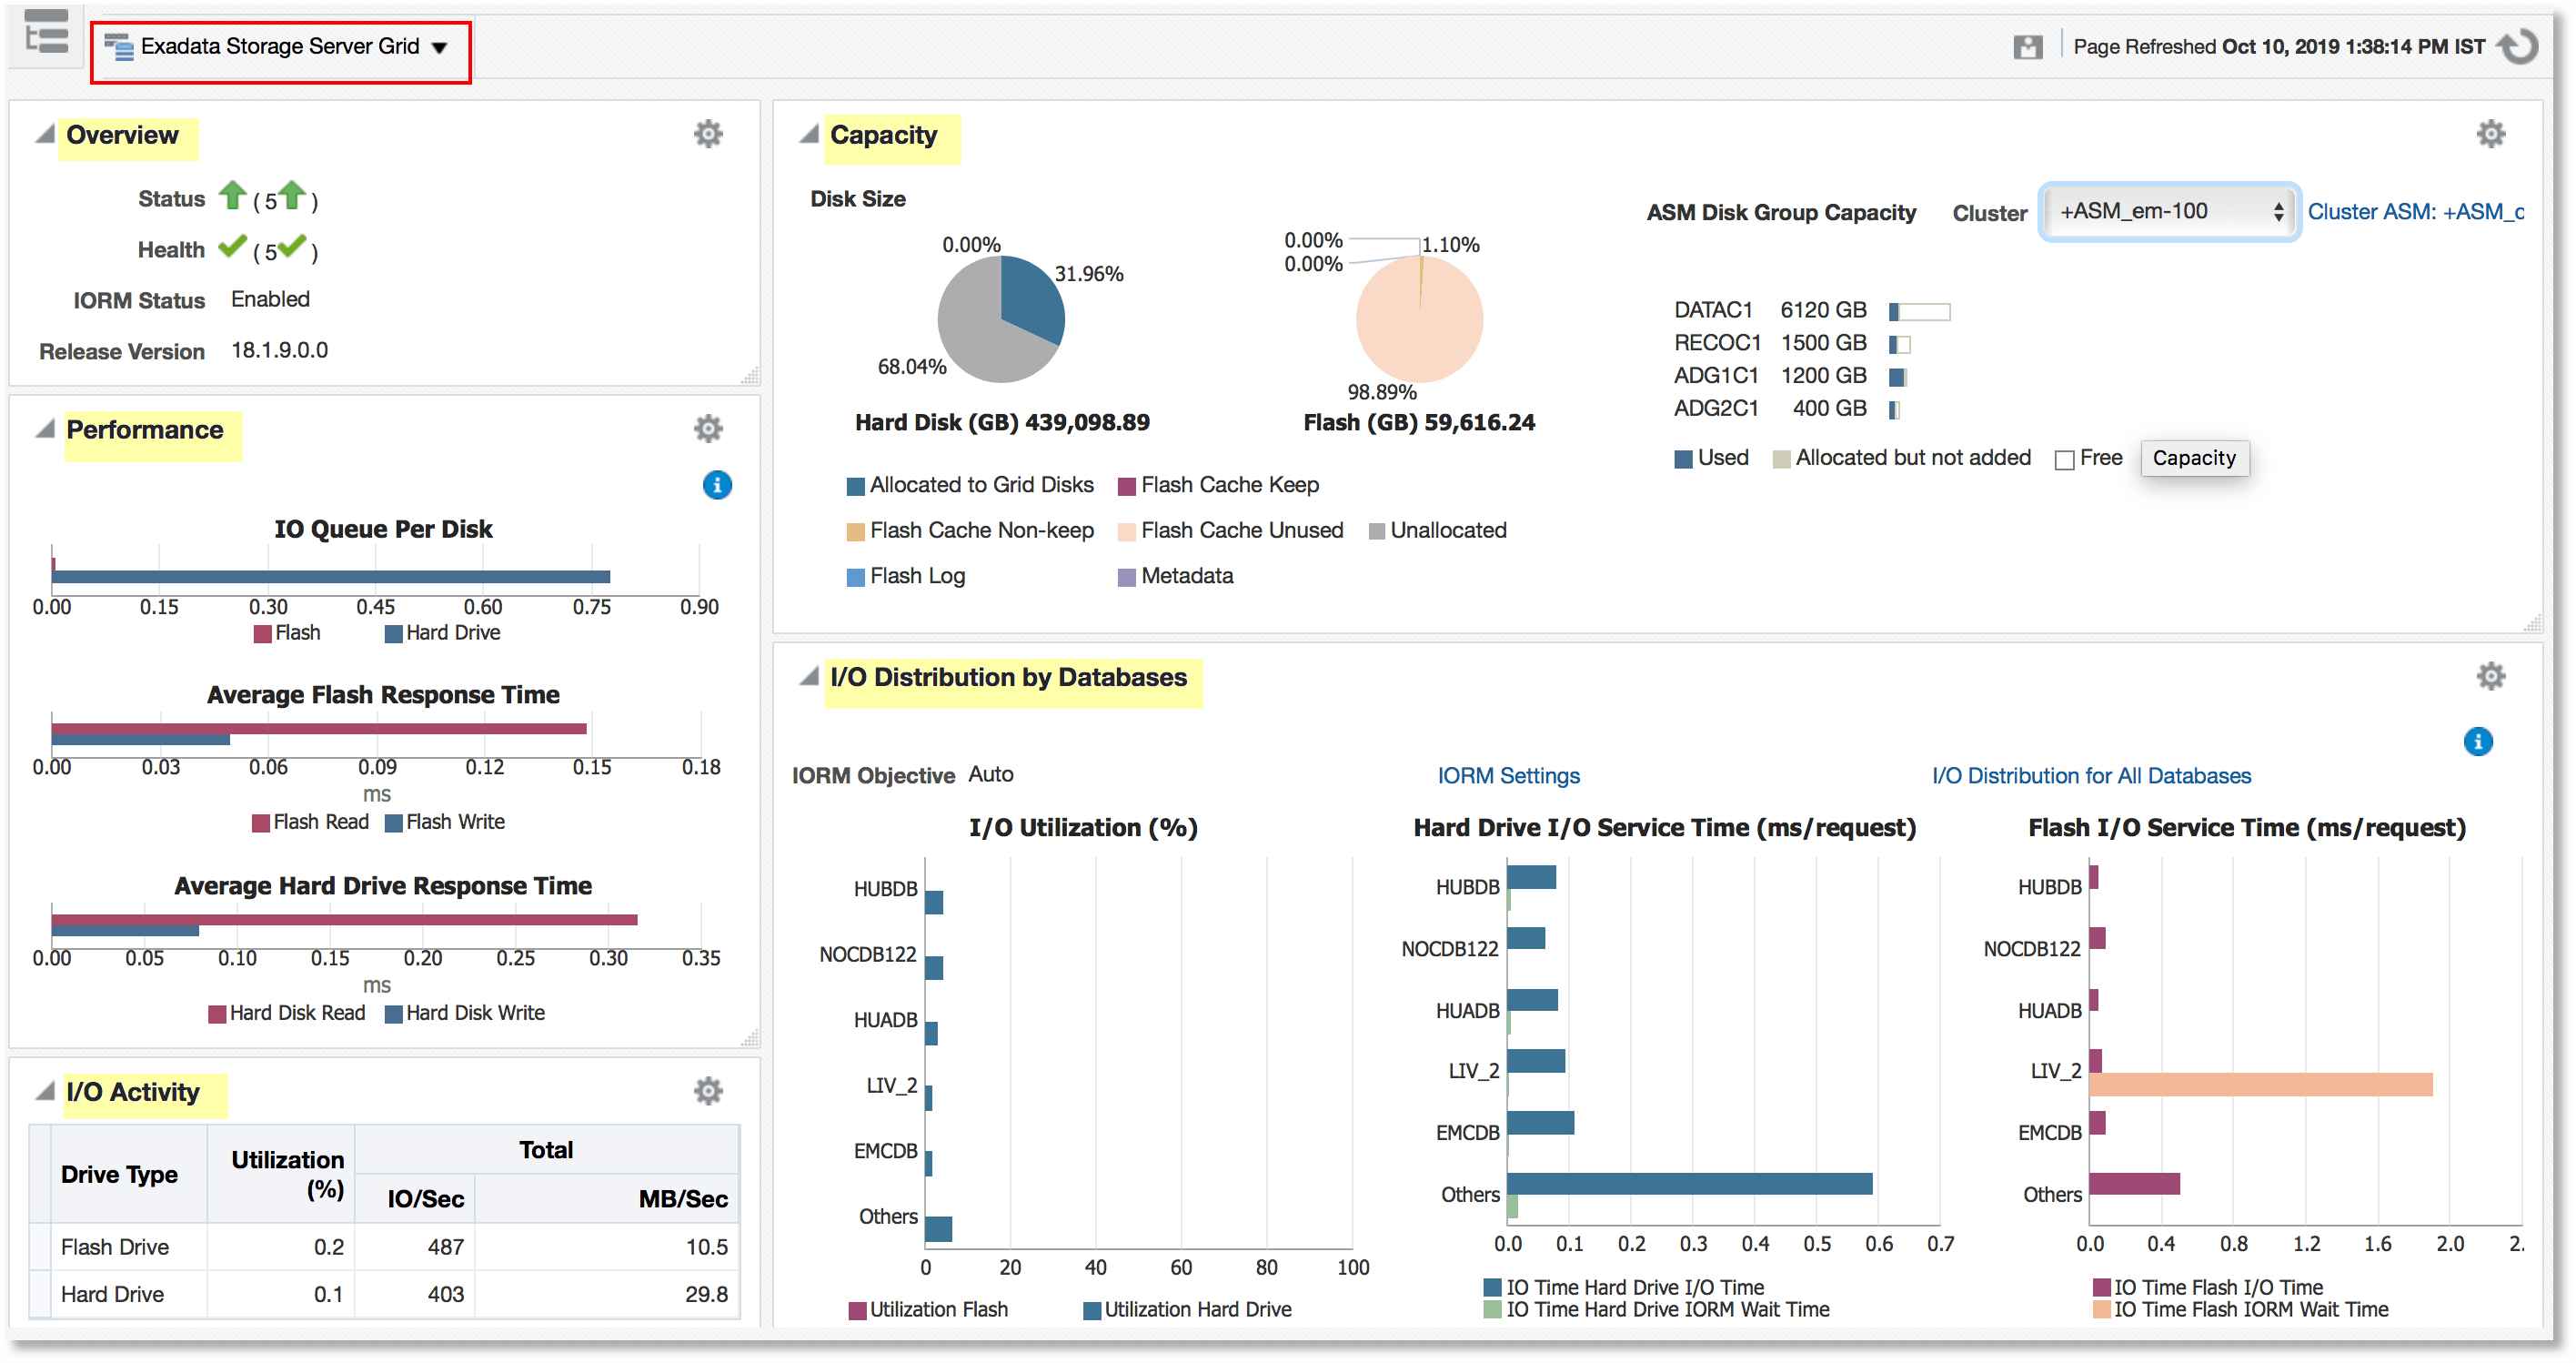
In the Capacity section of the Exadata Storage Server Grid home page, the ASM disk group capacity is displayed for the selected cluster.
You can view the I/O Utilization graph and Workload Distribution of Databases graph by clicking on the links I/O Distribution for All Databases and IORM Settings in the section I/O Distribution by Databases. The graphs that are displayed are the aggregated information from the Exadata Storage Server member targets of the grid. For details of the graphs, see Database I/O Utilization and Workload Distribution by Databases.
Viewing Metrics
Metrics can be viewed at the component level of Exadata Database Machine. To view the Exadata Storage Server metrics:
Adding Exadata Database Machine Components Manually
You can add Exadata Database Machine components manually using the following steps:
Removing an Exadata Database Machine Target
-
Remove all members of the Oracle Exadata Database Machine. If the member target is shared with another Database Machine target, then the member target will not be deleted and will continue to be monitored. In other words, the member targets will be deleted if they are associated with only this Database Machine target.
-
Remove only system members of the Oracle Exadata Database Machine. The other member targets will not be deleted and will continue to be monitored. They can be associated to another Oracle Exadata Database Machine, if required.
Note:
You must remove the SNMP configuration on the InfiniBand switch, ILOM, Cisco switches (RoCE and Admin), and PDU manually if you remove these targets from Enterprise Manager.
SNMP unsubscription is performed automatically for the targets like Oracle Exadata Storage Servers and Oracle Exadata Compute Nodes based on the options selected.
To remove an Exadata Database Machine target:
Note:
Host targets for the compute nodes and any targets that are also member targets of another Oracle Exadata Database Machine target will not be removed. System and non-system targets include:
System Targets:
-
Oracle Exadata Database Machine
-
Oracle Infiniband Fabric (Enterprise Manager target)
-
Oracle Exadata Storage Server Grid
Non-System Targets:
-
Oracle Exadata Storage Server
-
Oracle Exadata KVM
-
Systems Infrastructure Switch
-
Systems Infrastructure PDU
-
Systems Infrastructure Rack
-
Oracle Infiniband Switch (Enterprise Manager target)
-
Oracle Engineered System Cisco Switch (Enterprise Manager target)
-
Oracle Engineered System PDU (Enterprise Manager target)
-
Oracle Engineered System ILOM Server (Enterprise Manager target)
Removing a Component of a Database Machine Target
If you need to remove a component of an Exadata Database Machine target, you can perform this task within Enterprise Manager:
- From the Database Machine home page's Target Navigation pane, right-click on the target item you wish to remove.
- Select Target Setup, then Remove Target.
- A warning page will display to confirm the target deletion. Click Yes to continue.
Updating the Exadata Database Machine Schematic Diagram
The schematic diagram illustrates the placement and status of the components of the Exadata Database Machine.
In some cases, the Exadata Database Machine schematic diagram is not displaying the components correctly. For example:
-
You may have successfully discovered the Exadata Database Machine, but some components are not displaying correctly in the Exadata schematic diagram. Instead, an empty slot is shown in place of the component.
-
The Exadata Database Machine schematic diagram shows the status of the component as "red/down" where as individual components would really show that they are up and running fine.
-
You want to re-locate or rearrange the order of the components in the slots of Exadata Database Machine schematic diagram.
To accomplish these tasks, you will need to drop a component from the schematic diagram and add the correct one:
Drop a Component from the Exadata Database Machine Schematic Diagram
To drop a component from the Exadata Database Machine schematic diagram:
-
From the Targets menu, select Exadata.
-
From the Oracle Exadata Database Machines and Cloud Services page, select the Oracle Database Machine target that you want to modify.
Enterprise Manager displays the Oracle Exadata Database Machine home page of the selected Database Machine.
-
On the Exadata Database Machine schematic diagram right click on the component you wish to remove, click Remove Target.
-
Ensure you have selected the correct component in pop-up dialog box and click OK.
-
The Exadata Database Machine schematic diagram will refresh to show the empty slot.
