Incident Dashboard
An incident dashboard allows you to track and monitor the state of different aspects of incident management, such as getting a sense of how the incidents are distributed. Specifically, the incident dashboard presents another way of looking at a scoped set of incidents using custom views (one dashboard per view). In addition to providing an intuitive way to interpret incidents and incident distribution patterns, the dashboard provides you with quick and easy access to incident lifecycle actions such as acknowledging, assigning, and adding comments.
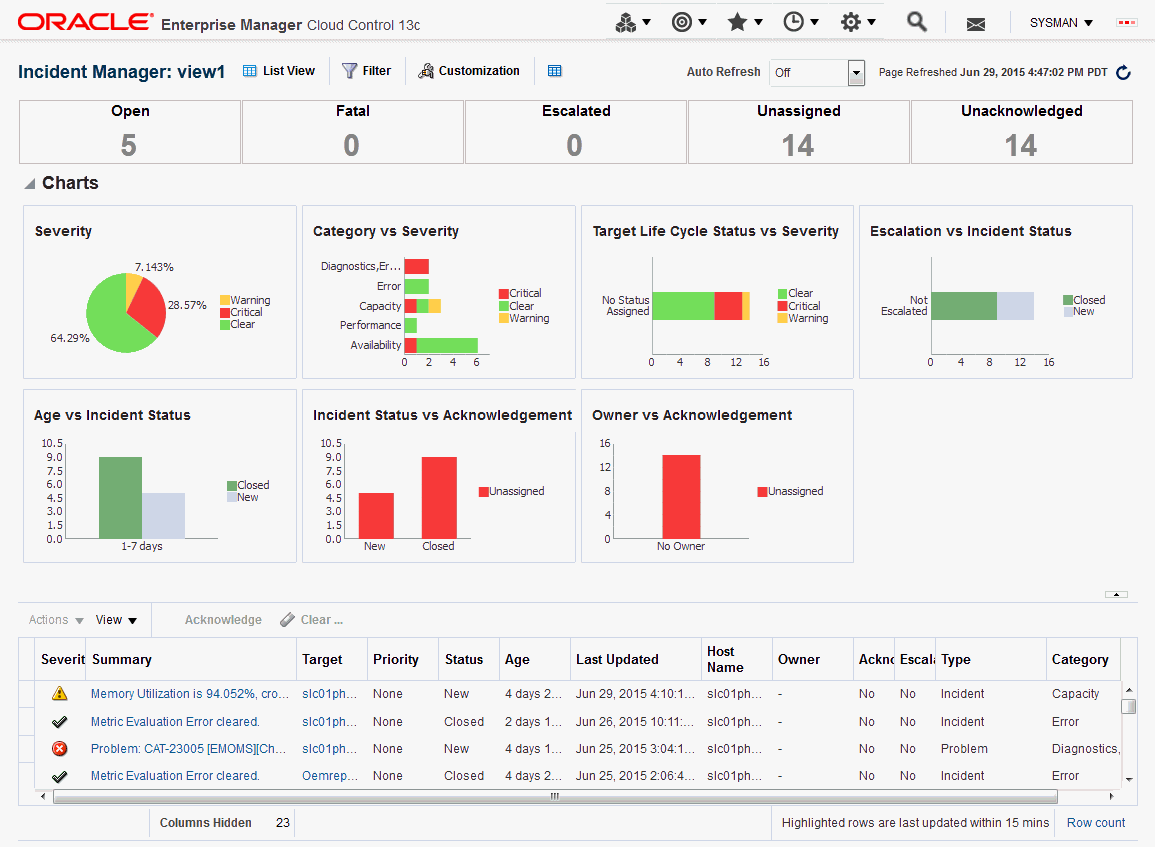
An incident dashboard is shown in the following figure.
Figure 5-5 Incident Dashboard

Incident Dashboard Areas
The content of the incident dashboard is divided into three sections:
Note:
By default, data is automatically refreshed every 30 seconds. You can increase or decrease the refresh interval as required.
-
Summary area displays the number of:
-
Open incidents including those created in the last hour.
-
Fatal incidents including those created or updated to Fatal in the last hour.
-
Escalated incidents including those escalated in the last hour.
-
Unassigned incidents.
-
Unacknowledged incidents.
Incident dashboard elements that are highlighted in red require immediate attention. Clicking on the summary numbers allows you to view only incidents pertaining to that incident area. Data displayed in the charts and incident list are modified accordingly.
-
-
Charts provide you with an easy-to-understand look at the current incident distribution and management status for each incident. You can click on slices of the charts to filter the data displayed in the incident dashboard only to those incidents.
-
Incident List that shows the open incidents listed in reverse chronological order by last updated time stamp. From this list, you can perform requisite incident lifecycle actions such as escalating, prioritizing, acknowledging, assigning owners, adding comments to incident.
Creating an Incident Dashboard
To create an incident dashboard for all open incidents, navigate to Incident Manager and click the Dashboard button located at the upper-left side of the page above the incident table.
While an open incident dashboard can be useful, a more typical scenario involves creating a custom view so that the incident dashboard only displays data for incidents that are of interest to you. See "Setting Up Custom Views" for information on creating a custom view. To view an incident dashboard for a specific view, select the desired view from the My Views list in the Incident Manager UI and then click Dashboard.
Customizing the Incident Dashboard
If the default dashboard does not meet your requirements, you can modify the dashboard in a variety of ways, such as removing an out-of-box chart, adding one of the predefined charts, or altering an existing chart, such as changing the dimensions of the chart or changing from a pie chart to a bar chart, for example.
Click Customization located above the Summary section in order to customize the Incident Dashboard. Once changes are made, click Save to save changes.
Note:
Only the view owner and Super Administrators can create or edit view customizations. Without view ownership, users can only change the chart auto-refresh frequency and chart type. These changes, however, are not permanent.