Creating an SNMP V1 Trap
Step 1: Define a new notification method based on an SNMP trap.
Log in to Enterprise Manager as a Super Administrator. From the Setup menu, select Notifications and then select Scripts and SNMPv1 Traps.
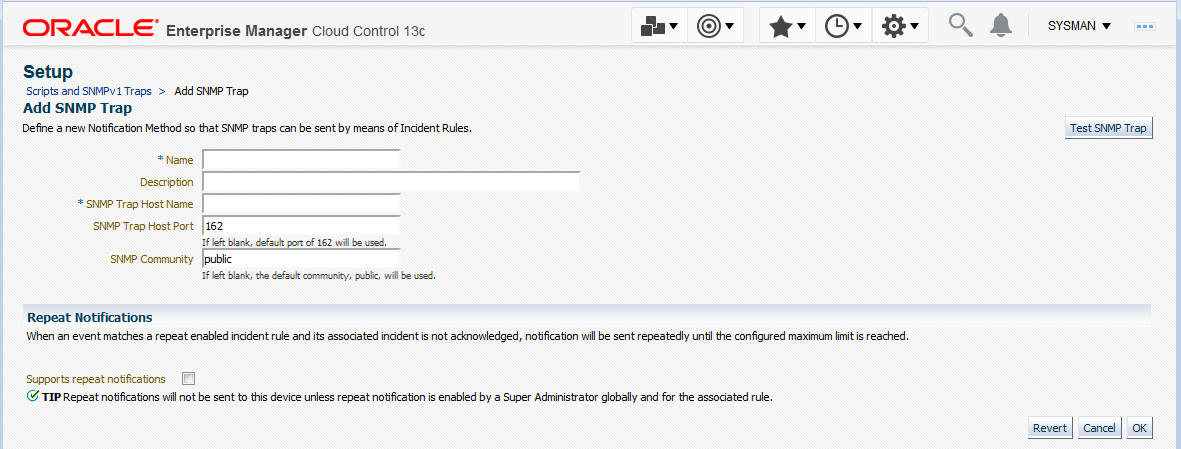
You must provide the name of the host (machine) on which the SNMP master agent is running and other details as shown in the following example. As shown in, the SNMP host will receive your SNMP traps.
Figure 6-2 SNMP Trap Required Information

Note:
A Test SNMP Trap button exists for you to test your setup.
Metric severity information will be passed as a series of variables in the SNMP trap.
Step 2: Assign the notification method to a rule.
You can edit an existing rule (or create a new incident rule), then add an action to the rule that subscribes to the advanced notification method. For instructions on setting up events or incidents rules using SNMP traps, see Creating a Rule to Send SNMP Traps for Events to Third Party Systems or Creating a Rule to Send SNMP Traps for Incidents to Third Party Systems respectively.
Example SNMP Trap Implementation
In this scenario, you want to identify the unique issues from the SNMP traps that are sent. Keep in mind that all events that are related to the same issue are part of the same event sequence. Each event sequence has a unique identification number.
An event sequence is a sequence of related events that represent the life of a specific issue from the time it is detected and an event is raised to the time it is fixed and a corresponding clear event is generated. For example, a warning metric alert event is raised when the CPU utilization of a host crosses 80%. This starts the event sequence representing the issue CPU Utilization of the host is beyond normal level. Another critical event is raised for the same issue when the CPU utilization goes above 90% and the event is added to the same event sequence. After a period of time, the CPU utilization returns to a normal level and a clear event is raised. At this point, the issue is resolved and the event sequence is closed.
The SNMP trap sent for this scenario is shown in Example 6-15. Each piece of information is sent as a variable embedded in the SNMP Trap.
This following example illustrates how OIDs are used during the lifecycle of an event. Here, for one event (while the event is open), the event sequence OID remains the same even though the event severity changes.
The OID for the event sequence is:
1.3.6.1.4.1.111.15.3.1.1.42.1: C77AE9E578F00773E040F00A6D242F90
The OID for the event severity code is:
1.3.6.1.4.1.111.15.3.1.1.6.1: CRITICAL
When the event clears, these OIDs show the same event sequence with a different severity code:
The OID for the event sequence is:
1.3.6.1.4.1.111.15.3.1.1.42.1: C77AE9E578F00773E040F00A6D242F90
The OID for the event severity code is:
1.3.6.1.4.1.111.15.3.1.1.6.1: CLEAR
The length of the SNMP OID value is limited to 2560 bytes by default. Configure the emoms property oracle.sysman.core.notification.snmp.max_oid_length to change the default limit.
Example 6-15 SNMP Trap
**************V1 TRAP***[1]*****************
Community : public
Enterprise :1.3.6.1.4.1.111.15.2
Generic :6
Specific :3
TimeStamp :67809
Agent adress :10.240.36.109
1.3.6.1.4.1.111.15.3.1.1.2.1: NOTIF_NORMAL
1.3.6.1.4.1.111.15.3.1.1.3.1: CPU Utilization is 92.658%, crossed warning (80) or critical (90) threshold.
1.3.6.1.4.1.111.15.3.1.1.4.1: https://sampleserver.oracle.com:5416/em/redirect?pageType=sdk-core-event-console-detailEvent&issueID=C77AE9E578F00773E040F00A6D242F90
1.3.6.1.4.1.111.15.3.1.1.5.1: Critical
1.3.6.1.4.1.111.15.3.1.1.6.1: CRITICAL
1.3.6.1.4.1.111.15.3.1.1.7.1: 0
1.3.6.1.4.1.111.15.3.1.1.8.1:
1.3.6.1.4.1.111.15.3.1.1.9.1:
1.3.6.1.4.1.111.15.3.1.1.10.1: Aug 17, 2012 3:26:36 PM PDT
1.3.6.1.4.1.111.15.3.1.1.11.1: Capacity
1.3.6.1.4.1.111.15.3.1.1.12.1: Capacity
1.3.6.1.4.1.111.15.3.1.1.13.1: Metric Alert
1.3.6.1.4.1.111.15.3.1.1.14.1: Load:cpuUtil
1.3.6.1.4.1.111.15.3.1.1.15.1: 281
1.3.6.1.4.1.111.15.3.1.1.16.1:
1.3.6.1.4.1.111.15.3.1.1.17.1: No
1.3.6.1.4.1.111.15.3.1.1.18.1: New
1.3.6.1.4.1.111.15.3.1.1.19.1: None
1.3.6.1.4.1.111.15.3.1.1.20.1: 0
1.3.6.1.4.1.111.15.3.1.1.21.1: sampleserver.oracle.com
1.3.6.1.4.1.111.15.3.1.1.22.1: https://sampleserver.oracle.com:5416/em/redirect?pageType=TARGET_HOMEPAGE&targetName=sampleserver.oracle.com&targetType=host
1.3.6.1.4.1.111.15.3.1.1.23.1: Host
1.3.6.1.4.1.111.15.3.1.1.24.1: sampleserver.oracle.com
1.3.6.1.4.1.111.15.3.1.1.25.1: SYSMAN
1.3.6.1.4.1.111.15.3.1.1.26.1:
1.3.6.1.4.1.111.15.3.1.1.27.1: 5.8.0.0.0
1.3.6.1.4.1.111.15.3.1.1.28.1: Operating System=Linux, Platform=x86_64,
1.3.6.1.4.1.111.15.3.1.1.29.1:
1.3.6.1.4.1.111.15.3.1.1.30.1:
1.3.6.1.4.1.111.15.3.1.1.31.1:
1.3.6.1.4.1.111.15.3.1.1.32.1:
1.3.6.1.4.1.111.15.3.1.1.33.1:
1.3.6.1.4.1.111.15.3.1.1.34.1:
1.3.6.1.4.1.111.15.3.1.1.35.1:
1.3.6.1.4.1.111.15.3.1.1.36.1:
1.3.6.1.4.1.111.15.3.1.1.37.1:
1.3.6.1.4.1.111.15.3.1.1.38.1:
1.3.6.1.4.1.111.15.3.1.1.39.1: SnmpNotifRuleset
1.3.6.1.4.1.111.15.3.1.1.40.1: SnmpNotifRuleset,SnmpNotifEvent
1.3.6.1.4.1.111.15.3.1.1.41.1: SYSMAN
1.3.6.1.4.1.111.15.3.1.1.42.1: C77AE9E578F00773E040F00A6D242F90
1.3.6.1.4.1.111.15.3.1.1.43.1:
1.3.6.1.4.1.111.15.3.1.1.44.1:
1.3.6.1.4.1.111.15.3.1.1.45.1:
1.3.6.1.4.1.111.15.3.1.1.46.1: CPU Utilization is 92.658%, crossed warning (80) or critical (90) threshold., Incident created by rule (Name = Incident management Ruleset for all targets, Incident creation Rule for metric alerts.; Owner = <SYSTEM>).
1.3.6.1.4.1.111.15.3.1.1.61.1: Metric GUID=0C71A1AFAC2D7199013837DA35522C08
1.3.6.1.4.1.111.15.3.1.1.62.1: Severity GUID=C77AE9E578EC0773E040F00A6D242F90
1.3.6.1.4.1.111.15.3.1.1.63.1: Cycle GUID=C77AE9E578EC0773E040F00A6D242F90
1.3.6.1.4.1.111.15.3.1.1.64.1: Collection Name=LoadLinux
1.3.6.1.4.1.111.15.3.1.1.65.1: Metric Group=Load
1.3.6.1.4.1.111.15.3.1.1.66.1: Metric=CPU Utilization (%)
1.3.6.1.4.1.111.15.3.1.1.67.1: Metric Description=
1.3.6.1.4.1.111.15.3.1.1.68.1: Metric value=92.658
1.3.6.1.4.1.111.15.3.1.1.69.1: Key Value=
1.3.6.1.4.1.111.15.3.1.1.70.1:
1.3.6.1.4.1.111.15.3.1.1.71.1:
1.3.6.1.4.1.111.15.3.1.1.72.1:
1.3.6.1.4.1.111.15.3.1.1.73.1:
1.3.6.1.4.1.111.15.3.1.1.74.1:
1.3.6.1.4.1.111.15.3.1.1.75.1:
1.3.6.1.4.1.111.15.3.1.1.76.1:
1.3.6.1.4.1.111.15.3.1.1.77.1:
1.3.6.1.4.1.111.15.3.1.1.78.1:
1.3.6.1.4.1.111.15.3.1.1.79.1:
1.3.6.1.4.1.111.15.3.1.1.80.1:
1.3.6.1.4.1.111.15.3.1.1.81.1:
1.3.6.1.4.1.111.15.3.1.1.82.1:
1.3.6.1.4.1.111.15.3.1.1.83.1:
1.3.6.1.4.1.111.15.3.1.1.84.1: Number of keys=0
1.3.6.1.4.1.111.15.3.1.1.85.1:
**************END V1 TRAP******************