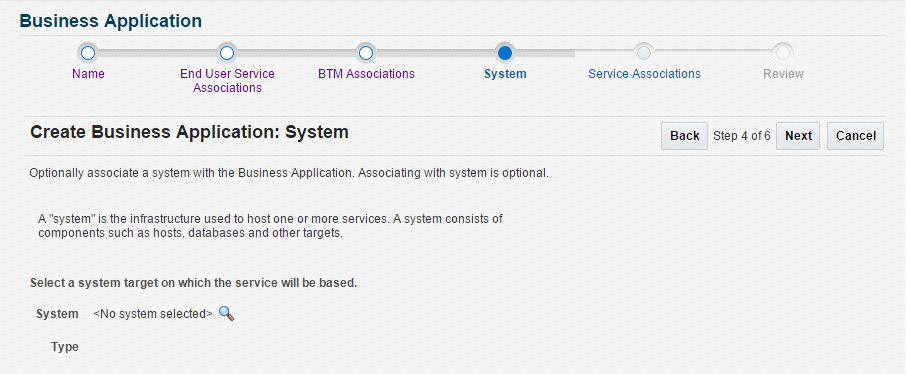
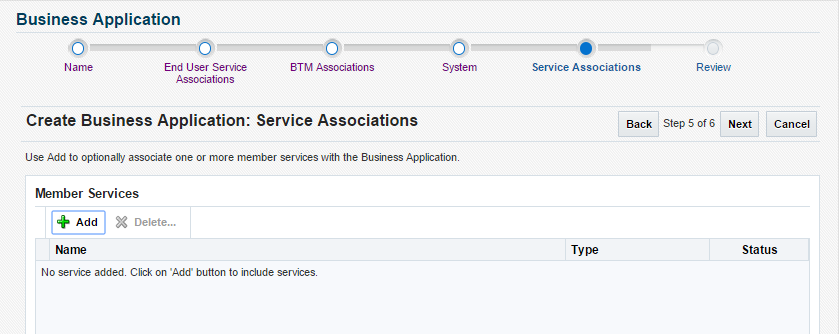
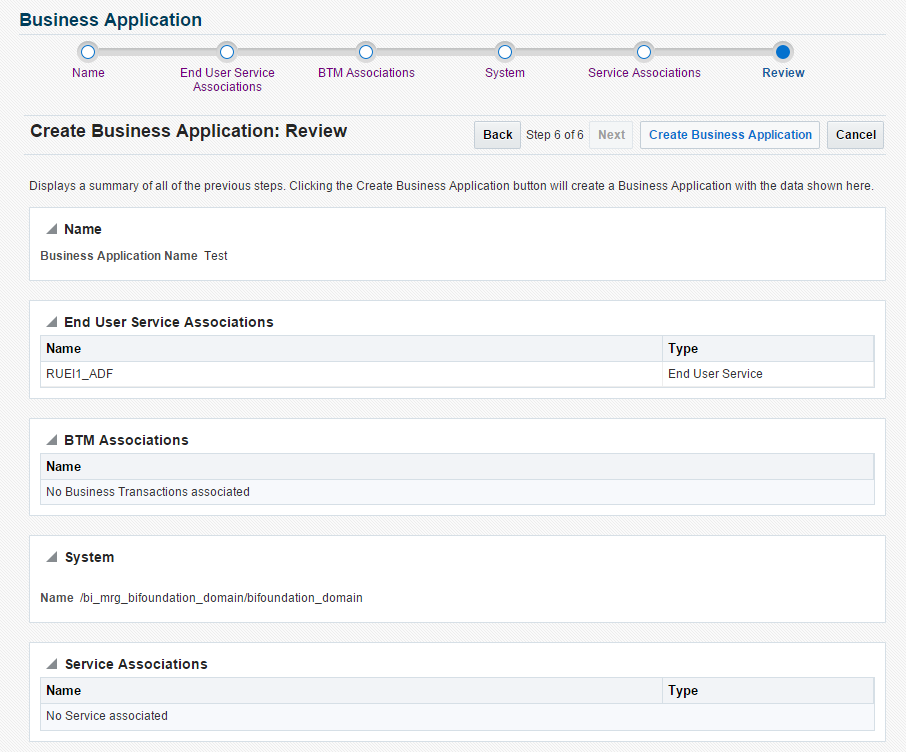
13 Monitoring Business Applications
A Business Application is an Enterprise Manager target that represents a logical application; for the user, it defines a unit of management. A Business Application is composed of RUEI applications. Using the Enterprise Manager Console, you view a Business Application to access RUEI and information about the application's supporting infrastructure: the hosts and servers where the application services are executing.
You cannot use Enterprise Manager to create RUEI applications. That work must be done using the RUEI products, which were introduced in previous chapters. You must complete the steps described in Setting up End-to-end Monitoring, to be able to set up Business Application monitoring. You must also complete the tasks described in Prerequisites and Considerations.
Note:
With Enterprise Manager 13c, there is a new service level target, called an End User Service (EUS) corresponding to each RUEI Application, Suite or web service. The EUS has the same name as the RUEI Application, Suite or web service, and is used to create a business application. See Monitoring an End User Service for more information.
This chapter covers the following:
Introduction to Business Applications
By using Oracle Enterprise Manager to monitor your Business Applications, you can make sure that your applications are performing at their peak and that end users are satisfied with their performance.
The use of Business Applications offers a number of significant advantages over traditional IT-centric approaches that only focus on system health issues. In particular, Business Applications:
-
Allow you to manage your applications in their business context, measuring, and alerting on the basis of the end-users' experience.
-
Provide customizable dashboards with complete visibility across multi-tier composite applications.
-
Provide a visualization of all target relationships within a business service.
Systems, Services, and Business Applications
Within Oracle Enterprise Manager, there are two types of targets: systems and services. A Business Application is an aggregate service target that can be associated with a minimum of either a system target or a sub-service.
System Targets
Consider an example business application that contains an order entry application implemented by a collection of physical (system) resources. The application is deployed in a Web Logic domain modeled as a system target whose members are the individual managed servers. The Business Application could include transactions deployed in containers. Each of these containers is an application server, possibly within a single Web Logic domain. In this case, the Web Logic domain is a system target. (In the case that the transaction spans multiple domains, it is recommended that you create a composite application within Oracle Enterprise Manager.)
System monitoring provides insights into the behavior of the monitored application infrastructure. It collects metrics and reports on the health of all components from the hosts to the application servers and the deployed Java EE applications. It also provides deep-dive diagnostics tools for the application servers and the databases.
Sub-services
You can define a service by creating one or more tests that simulate common end-user functionality. You can also define services based on system targets, or on both system and service tests. You can then use these services as sub-services to define a Business Application. For more information on services, see the Enterprise Manager Cloud Control Administrator's Guide.
Business Applications
A business application can be associated with a mix of system targets and sub-services, monitoring them to determine the business application's availability.
For system targets, you can specify which key components within a system target should be monitored to determine the business application's availability. For instance, for a transaction, the key components will be the servers where the services that comprise the transaction are running.
MyBank: An Example Business Application
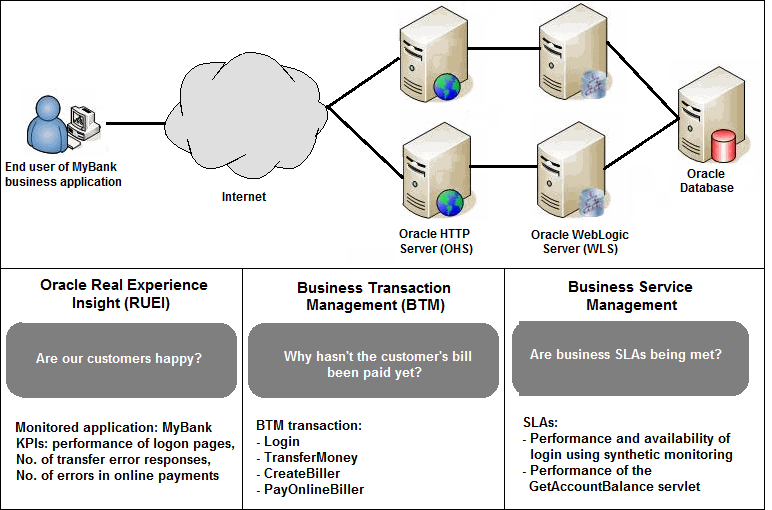
To illustrate the nature of a Business Application, consider the situation in which end users access a banking application (MyBank) that allows them to perform such tasks as the payment of bills. This business application is delivered through the infrastructure shown in Figure 13-1.
The end-user experience of the MyBank business application is monitored through RUEI, while Key Performance Indicators (KPIs) are used to monitor its key aspects, such as the availability and performance of the logon page, and the number of errors in transfer responses and online payments.
Figure 13-1 The MyBank Business Application
Proactive application monitoring is achieved by defining business objectives that set acceptable levels of performance and availability. Within Oracle Enterprise Manager, these business objectives are referred to as Service Level Agreements (SLAs) and are composed of Service Level Objectives (SLOs) that measure specific metrics.
Insight into each of these key aspects of a business application's operation and delivery is available through a number of dedicated regions of the Oracle Enterprise Manager console.
Prerequisites and Considerations
This section describes the requirements that must be met and the issues that should be considered to use the Business Applications facility. It is strongly recommended that you carefully review this information before proceeding with the creation of business applications.
Note:
It is recommended that you review the My Oracle Support website to obtain up-to-date information about the supported RUEI as well as patches, configurations, known issues, and workarounds.
This section covers the following:
Requirements for Using RUEI
To use RUEI to monitor the performance of your Business Applications, you must ensure that the following requirements have been met:
-
RUEI version 12.1.0.7 (or higher) has been installed and configured to monitor the required applications, suites, and services. Information about deployment options and requirements is available from the Oracle Real User Experience Insight Installation Guide.
-
The Enterprise Manager for Oracle Fusion Middleware plug-in must be deployed to both Oracle Management Service (OMS) and to each Management Agent monitoring the business application targets.
For details on deploying the plug-in to OMS, see the "Deploying Plug-Ins to Oracle Management Service" chapter in the Enterprise Manager Cloud Control Administrator's Guide.
For details on deploying the plug-in to a Management Agent, see the "Deploying Plug-Ins on Oracle Management Agent" chapter in the Enterprise Manager Cloud Control Administrator's Guide.
-
The Reporter system must be accessible to Oracle Enterprise Manager via an HTTPS connection on port 443. Other component host systems (such as Collector, Processing Engine, and database servers) do not need to be accessible to Oracle Enterprise Manager unless you intend to make them managed targets. For more information, see Registering RUEI Systems.
-
The statistics data retention setting (which governs the availability of statistical information such as violation counters) has been configured to be consistent with your business application reporting requirements. The procedure to do this is described in the Oracle Real User Experience Insight User's Guide.
-
If you intend to export session information from the Session Diagnostics facility, you should ensure that the exported session is not older than the period specified for the Full Session Replay (FSR) data retention setting. In addition, the URL prefix masking setting should be specified as "Complete logging". For more information, see the Oracle Real User Experience Insight User's Guide.
Registering RUEI Installations with Self-Signed Certificates
A RUEI installation can use a self-signed certificate. This is explained in the Oracle Real User Experience Insight Installation Guide. However, Oracle Enterprise Manager only accepts SSL certificates issued by a trusted Certificate Authority (CA), and that contain a valid Common Name (CN). Therefore, in order to be able to register a RUEI installation with Oracle Enterprise Manager, you need to do the following:
Note:
All instructions on the Oracle Enterprise Manager system need to be carried out as the user running the oms and agent.
-
Verify that the certificate is valid. One way to do this is to attempt to access the Oracle Real User Experience Insight system through a browser via HTTPS and view the certificate details. You should ensure the certificate' s date validity. If the certificate's date range does not include the period your Oracle Real User Experience system is running, you will not be able to use it.
-
Download the certificate to your Oracle Enterprise Manager system. Many browsers provide an option when creating a security exception for a self-signed certificate to also save the certificate to a file. If you have already approved the security exception in your browser, the following example works in Mozilla Firefox:
-
Click the security icon to the left of the hostname.
-
Click More information, then click View certificate.
-
Select the Details tab and click Export.
The exported file should be copied to your system running Enterprise Manager. The examples below assume that you stored the file containing the certificate in ~/ruei.cert.
A more direct way to download the certificate to your Oracle Enterprise Manager system can be carried out on the system itself. Issue the following commands on the Oracle Enterprise Manager system:
openssl s_client -showcerts -connect <RUEI_REPORTER_HOST>:443 </dev/null \ | openssl x509 -inform PEM > ~/ruei.cert -
-
Add the certificate to the keystore. Within Oracle Enterprise Manager, two components are used to communicate with a RUEI system via SSL: one for polling the status of RUEI, and one for the communication with RUEI. Both keystores need to contain the same certificate. Issue the following commands on the Oracle Enterprise Manager system:
Agent:
cd <
agent instance home>/bin ./emctl secure add_trust_cert_to_jks \ [-password <keystore password, default "welcome">] \ -trust_certs_loc ~/ruei.cert -alias <unique alias>OMS
<
path_to_Oracle_WT>/jdk/bin/keytool -import \ -keystore <path_to_wlserver_10.3>/server/lib/DemoTrust.jks \ -file ~/ruei.cert -alias <unique alias> -storepass DemoTrustKeyStorePassPhrase -
In order for Oracle Enterprise Manager to work with the new certificate, perform a bounce of the OMS and the AGENT. Issue the following commands:
<
OMS oracle home>/bin/emctl stop oms -all <OMS oracle home>/bin/emctl start oms <AGENT oracle home>/bin/emctl stop agent <AGENT oracle home>/bin/emctl start agent
Registering RUEI Systems
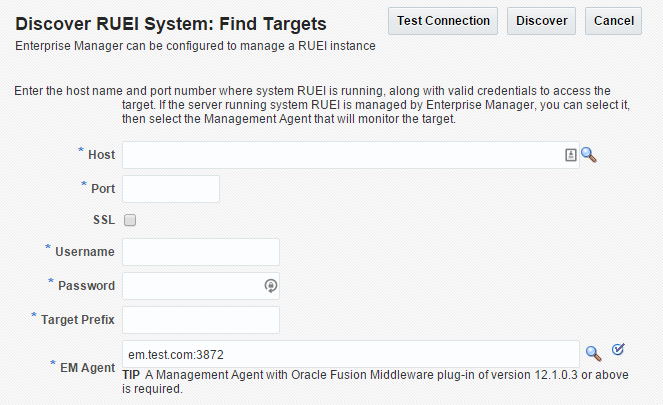
Before you can create Business Applications based on RUEI-monitored applications and services, you must first register the appropriate RUEI with Oracle Enterprise Manager.
Note:
You must have Super Administrator privileges in order to access the Middleware Management Setup page.
With Enterprise Manager 13c, there is a new service level target, called an End User Service (EUS) corresponding to each RUEI Application, Suite or web service. The EUS has the same name as the RUEI Application, Suite or web service, and is used to create a business application. A synchronization job is automatically created to maintain End User Services (EUS) entry details corresponding to each RUEI Application/Suite. For more information on jobs, see the Enterprise Manager Cloud Control Administrator's Guide. If you later create a new RUEI Application, Suite or web service, you may need to run the job manually as described in Troubleshooting an End User Service.
Note:
To successfully register a RUEI system, make sure that the Enterprise Management Repository database instance target is properly registered as described below, and that the database instance target has associated monitoring credentials with the SYSDBA role. These credentials are required so that KPIs from RUEI can be monitored by Oracle Enterprise Manager.
During a typical installation of Enterprise Manager, the database instance target for the management repository is not fully registered automatically. The database is auto-discovered by Enterprise Manager but must be promoted as described in the Discovering and Adding Database Targets chapter of the Enterprise Manager Administrator's guide. Use the appropriate section instructions for your database setup, for example, Discovering and Adding Single Instance Database Targets or Discovering and Adding Cluster Database Targets.
Setting Up a Connection Between RUEI and the Oracle Enterprise Manager Repository
The following procedure describes setting up a connection so that KPIs from RUEI can be monitored by one or more Oracle Enterprise Manager instances. This procedure can be used for the following situations:
-
After changing Enterprise Manager hostname
-
After changing the sysman user credentials
-
After changing the TNS settings of the Enterprise Manager database
-
Correcting issues with initial KPI setup
Note:
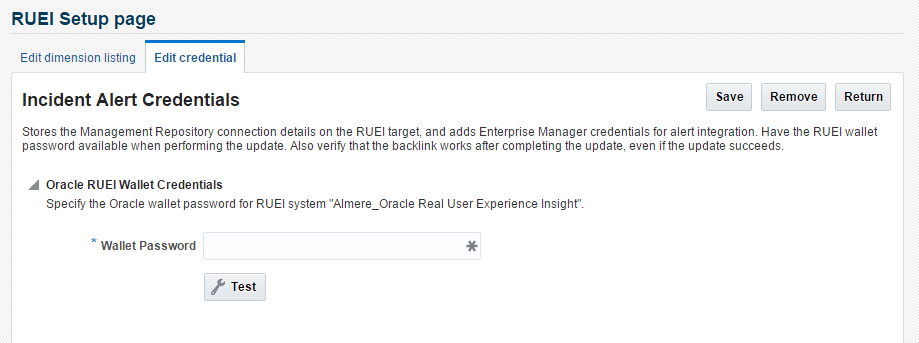
For RUEI version 13.5.1.0.0 or later, start at Step 4, as RUEI version 13.5.1.0.0 or later doesn't require Wallet Password and the Edit Credential tab has been removed.-
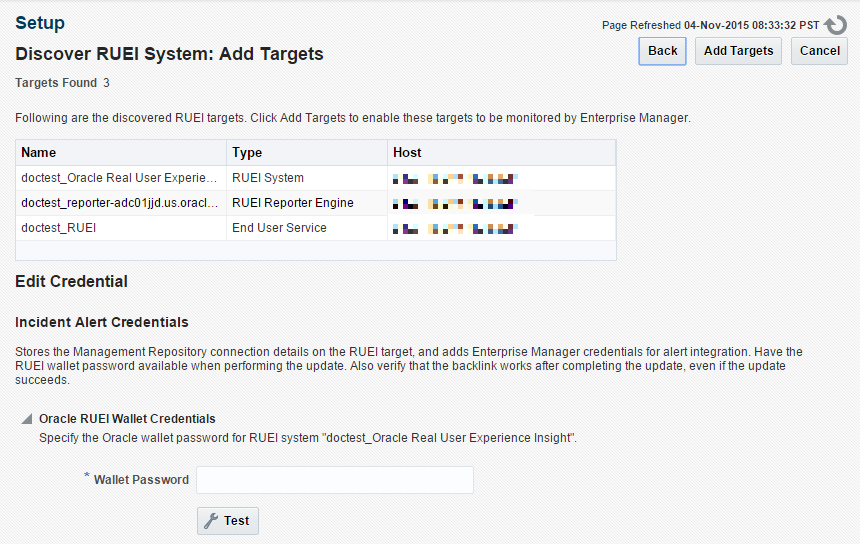
From the Setup menu, select Middleware Management, then select Setup. The page shown in Figure 13-2 appears. The currently registered systems are listed.
-
Select the RUEI system you would like to set up and click Configure. The RUEI Setup Page appears.
-
Select the Edit credential tab and click Edit. The RUEI Setup page shown in Figure 13-5 appears. Enter the appropriate RUEI wallet password, this is typically specified while setting up the RUEI repository.
Note:
If you change the RUEI wallet password, you must edit the Enterprise Manager RUEI credential on this screen to maintain the RUEI connection. Do not edit using Enterprise Manager named credential feature for EUS_ENGINE_USER.
-
On the RUEI host, configure RUEI to use the mkstore utility:
-
Determine the location of the mkstore utility. This utility is included with the Oracle Database and Oracle Client runtime. In both cases, it is located in
$ORACLE_HOME/bin/mkstore. -
Edit the
/etc/ruei.conffile and add the following line, where mkstore_location is the path determined in the step above:export MKSTORE_BIN=mkstore_location -
Restart RUEI by selecting System, then Maintenance, and then System reset. Select Reapply latest configuration option and click Next to apply the changes you have made.
-
Monitoring Business Applications
Once a Business Application has been created, you can use the Business Application home page to monitor its performance and availability, as well as the status of the systems (hosts, databases, and middleware components) that support it.
It is also from the Business Application home page that you can access more detailed information about RUEI components:
-
To get more information about RUEI components, select one of the End User Service related views from the Business Application drop down menu. See Monitoring End User Experience.
Note:
If there are timeout issues associated with monitoring the Business Application, you can set the APM_WEBSERVICE_CREATE_TIMEOUT system property in the Enterprise Manager WebLogic configuration to a value appropriate to your network configuration, for example 60 seconds.
To view the Business Application home page, do the following:
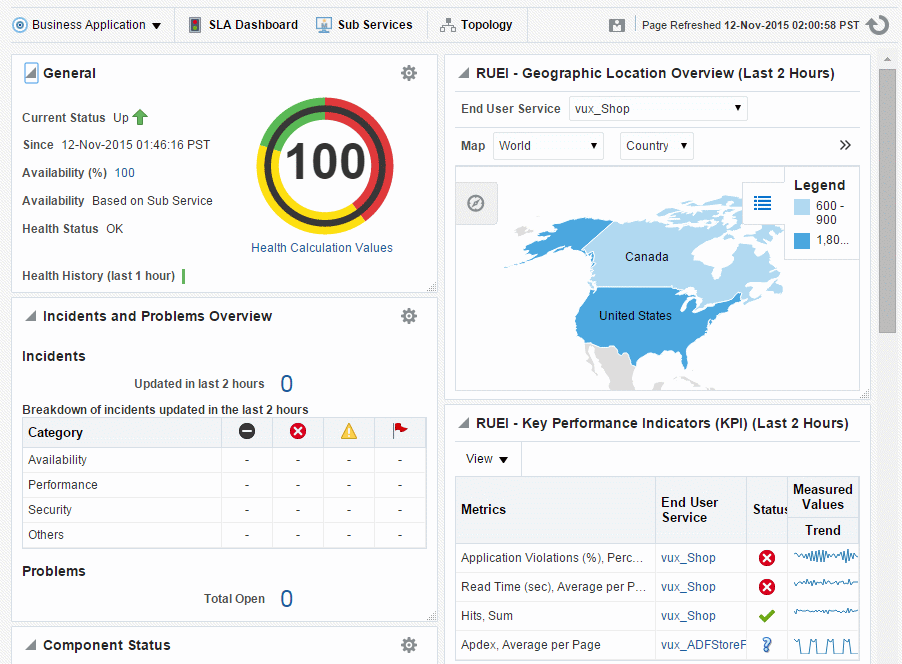
Figure 13-13 Business Application Home Page
Each region provides specific information on the various operational aspects of the selected business application. By default, the following regions are available:
-
General: indicates its status, availability and health.
-
Incidents and Problems Overview: Count of incidents and problems across different categories such as severities or target types.
-
Component Status: indicates the availability of the components that deliver the business application and the history of the current status. Expand the displayed tree to show status for systems, services and service tests. Click an item for further detail.
-
SLA Status: indicates the status of the Service Level Agreement if an SLA is configured.
-
RUEI - Geographic Location Overview: displays RUEI metrics on a geographic map. You can select which metric you would like to view and restrict the data to a region.
-
RUEI - Key Performance Indicators (KPI): indicates the status of the KPIs defined for the applications, suites, and services associated with the business application.
-
RUEI - Usage and Violations Overview: displays a chart of issues to help you isolate issues by page.
-
Weblogic - Most Requested: displays the most requested services over the last 24 hours. Click a tab to view the services of a particular type, for example RESTful Services.
In addition to the default regions, more regions can be added by clicking the Personalize Page icon, including regions relating to JVM, RUEI and SLA activities. In this mode, you can also rearrange the regions.
Note:
A Business Application is an aggregate service as explained in the Configuring and Using Services chapter of the Enterprise Manager Cloud Control Administrator's Guide.
Monitoring End User Experience
The Business Application drop down menu, accessible from the Business Application home page, includes the following options for the End User Experience item:
-
End User Experience data, whose contents are described in Monitoring End User Experience Data.
-
Session Diagnostics, whose contents are described in Monitoring End User Experience Data.
-
Metrics, whose contents are described in Monitoring End User Experience Metrics.
As discussed in Creating Business Applications, a business application can consist of an End User Service which corresponds to the application or suite being monitored by RUEI. If you monitor a End User Service directly, as described in Monitoring an End User Service the End User Service drop down menu, accessible from the End User Service home page, includes the following options for the End User Experience item:
-
Session Diagnostics, whose contents are described in Working With Session Diagnostics.
-
Metrics, whose contents are described in Monitoring End User Experience Metrics.
-
User Flows, whose contents are described in Monitoring User Flows.
Monitoring End User Experience Data
Selecting the End User Experience Data option from the Business Application > End User Experience menu, displays a page that includes Key Performance Indicators, Usage Data and Violations Data tabs.
Key Performance Indicators
When displayed, the page shows the KPIs and Users Flows data from RUEI.
Note:
In order to view KPI alerts within Incident Manager, you will need to set up a connection between RUEI and the Oracle Enterprise Manager Repository. The procedure to do this is described in Setting Up a Connection Between RUEI and the Oracle Enterprise Manager Repository.
Usage Data
When displayed, the page shows the most active users and most executed user requests data from RUEI.
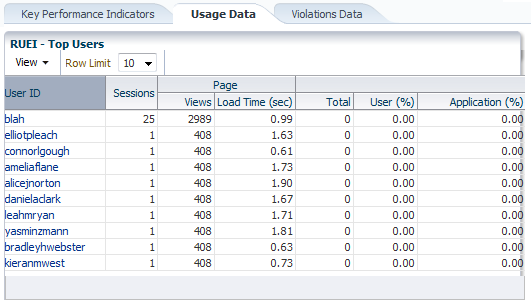
The Top Users region enables you to monitor the most active users of the targets associated with the business application. This includes session and page view information, as well as user and application violation indicators. An example is shown in Figure 13-14.
Use this region to verify the performance of the most popular user requests associated with a business application (such as downloads or payment handlings).
Selecting a user opens the RUEI Session Diagnostics facility and displays detailed information about the selected user. For more information, see Working With Session Diagnostics.
Violations Data
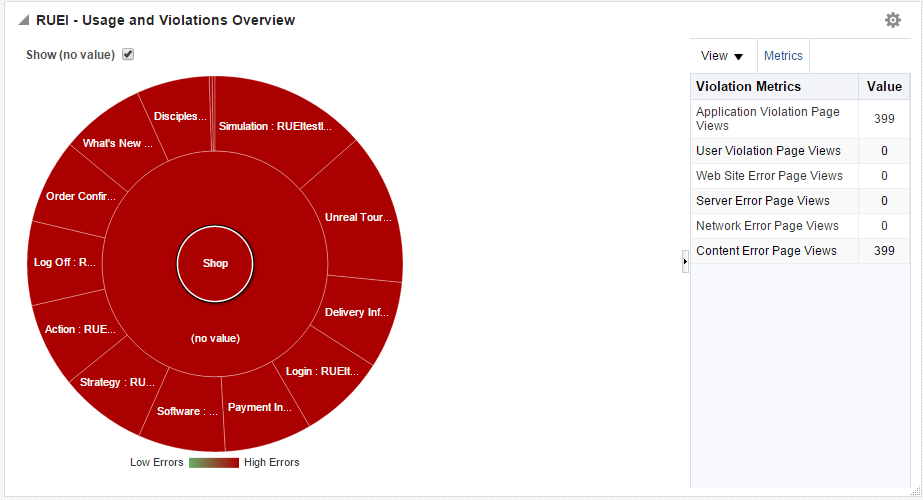
When displayed, the page shows a sunburst chart to illustrate the violations data from RUEI. An example is shown in Figure 13-15.
Figure 13-15 Usage and Violations Overview
The color of a segment indicates the number of violations that are associated with that page. Hover your mouse pointer over a segment to display the exact number or violations associated with the page. Click on the page to use the session diagnostics facility, see Working With Session Diagnostics, Double click on a page to explore the next level of detail available.
Working With Session Diagnostics
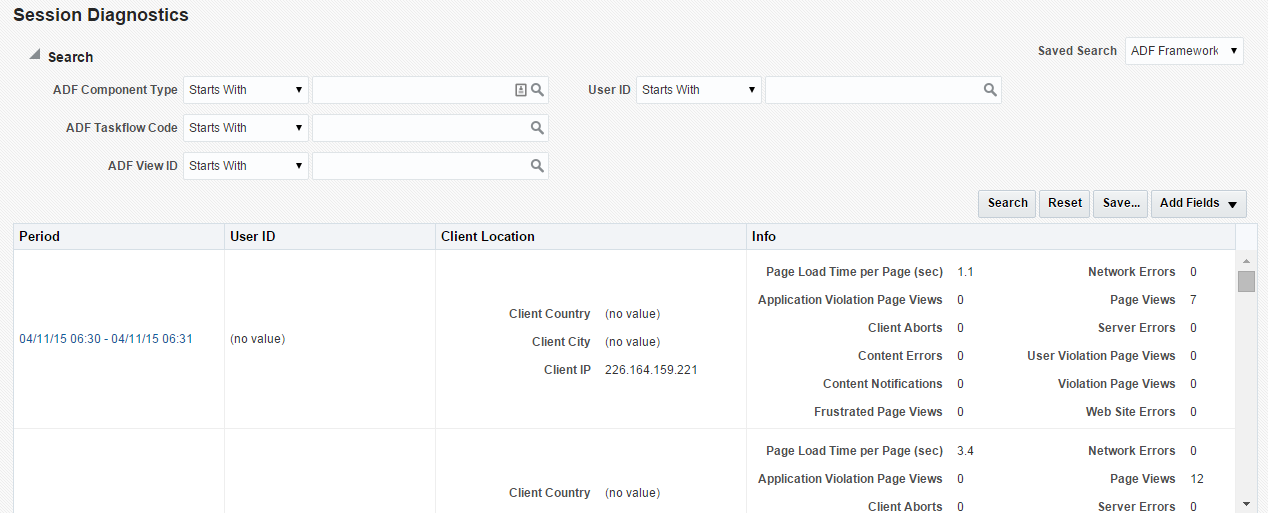
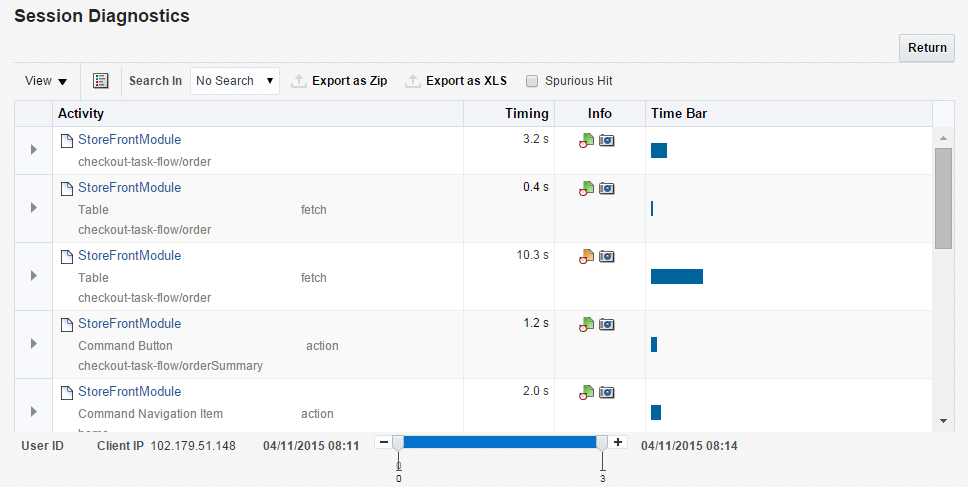
The Session Diagnostics facility allows you to perform root-cause analysis of operational problems. It supports session performance breakdown, including the impact of failing pages and hits on sessions, the full content of each failed page, and the relationship between objects, page views, and sessions. Moreover, it offers the opportunity to track exactly what error messages visitors to the monitored website receive, and when. With this ability to recreate application failures, you can identify and eliminate annoying or problematic parts of your web pages.
This section explains the use of the Sessions Diagnostics facility. It covers the following topics:
Creating an Enterprise Manager User for Session Diagnostics
With Oracle Enterprise Manager 13c, a new role called EM_EUS_DIAGNOSTICS exists to allow users access session diagnostics data. To create a user with this role:
-
From the Setup menu, select Security, then select Administrators.
-
Click Create to create a new user.
-
On the Properties page, enter a username and password.
-
On the Roles page, add the EM_EUS_DIAGNOSTICS role to the new user definition.
-
On the Target privileges, first add the RUEI Reporter engine target, then grant the configure_target privilege.
-
Review and complete creating the new user.
-
Log out of Enterprise Manager and log in as the new user you have just created.
-
To test the user access, use session diagnostics as described below and review the payload message for session activity (camera icon).
Getting Started with Session Diagnostics
To locate the diagnostics information you require, do the following:
Customizing Session Diagnostics Reporting
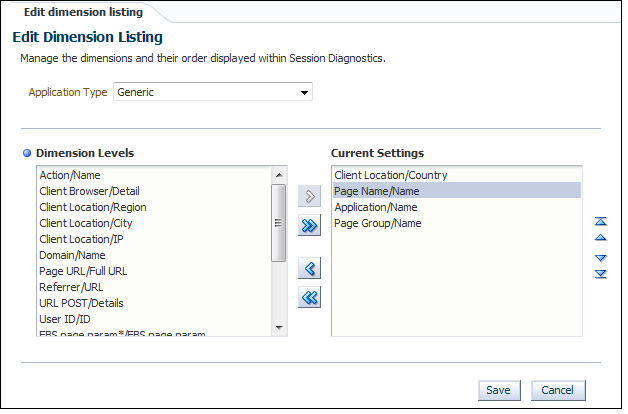
You can control the specific dimensions reported in Session Activity part of the Session Diagnostics for applications, suites and services. To do so:
Exporting Full Session Information
In addition to viewing session information, you can also export complete session contents to external utilities for further analysis or integration with other data. For example, you could use complete real-user sessions as the basis for test script generation. Test platforms, such as Oracle Application Testing Suite (ATS), can easily be configured to generate automated test scripts for an application's most common usage scenarios.
In addition, this facility can also be used to support root-cause analysis. Complete user session information can be provided to application or operations specialists to help identify unusual or difficult to isolate issues. Sensitive information within the exported data is masked according to the actions defined in the HTTP protocol item masking facility. This is described in the Oracle Real User Experience Insight User's Guide.
To export session information:
- Locate the required session, and click Export as Zip.
- Depending on how your browser is configured, you are either prompted to specify the location to which the zip file should be saved, or the session is immediately saved to the defined default location.
Important
In order for the session export files to be created correctly, you should do the following:
-
Ensure that the requirements for exporting session information described in Prerequisites and Considerations have been met.
-
Verify the exported content files (described in the following section) are present before attempting to import an exported RUEI session into an external utility.
Understanding the Structure of the Exported Data
The exported session zip file contains the following files:
-
data.tab: contains the direct (raw) hit information for the selected session extracted from the Collector log file. -
page.tab: contains the direct (raw) page information for the selected session extracted from the Collector log file. -
content_hitno.tab: contains the complete (raw) content information for the indicated hit. There is a file for each hit within thedata.tabfile that has content. For example, if the third and sixth hits had content available for them, two files would be created:content_3.tabandcontent_6.tab.Viewable versions of the files cited in the hit file are also available under the
content_viewerdirectory. This means that data transferred with chunked encoding can be immediately viewed. Note that the samehitnoas in thedata.tabfile is used in their file naming. -
index.html: allows developers and other interested parties outside RUEI to view and analyze session details as they would appear within the Session Diagnostics facility, with access to source, page and object details, and element identification.
Note:
The log files used as the basis for creating exported session files are also used internally by RUEI. The format and contents of these files is subject to change without notice.
Exporting Session Pages to Microsoft Excel
You can export a summary of the pages within the currently selected session to Microsoft Excel.
- Locate the required session, and click Export as XLS. Depending on how your browser is configured, you are either prompted to specify the tool with which to open the file directly (by default, Microsoft Excel), or the session is immediately saved to the defined default location.
- Within Microsoft Excel, you can view and edit the generated file. The exported page view history and session summary can be used to compile sets of real-user sessions that could be used as the basis for testing or performance analysis.
Controlling Row Creation and Ordering
Be aware that the rows that appear in the Microsoft Excel export are based on the currently specified RUEI configuration. This is described in Customizing Session Diagnostics Reporting.
Monitoring End User Experience Metrics
As part of Business Application and End User Service monitoring, the End User Experience Metrics page presents a useful overview of user-selectable metrics within a given timespan. These metrics can be counts (for example, page views) or aggregate values (such as, median page load time).
To view the Metrics page, select End User Experience and then Metrics from the Business Application or End User Service menu.
This page allows you to select performance metrics and view their associated average and median data graphically.
The time-period for the data can be set and search filters similar to those on the Session Diagnostics Page allow you to further refine the data returned. Filter settings can be saved for subsequent use. The metrics are displayed in two tabs, Aggregation shows the metric aggregated over time and Instances shows individual events.
Aggregation
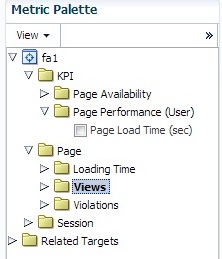
On the Aggregation tab the selectable metrics are arranged in an hierarchical tree palette. The list displays a set of items that is appropriate for the configured business application type. This set can expand to include system metrics. For example, if the application associates to a WebLogic server, JVM metrics become available in addition to RUEI metrics. An example of a metrics palette is shown in Figure 13-21.
Figure 13-21 Metric Palette
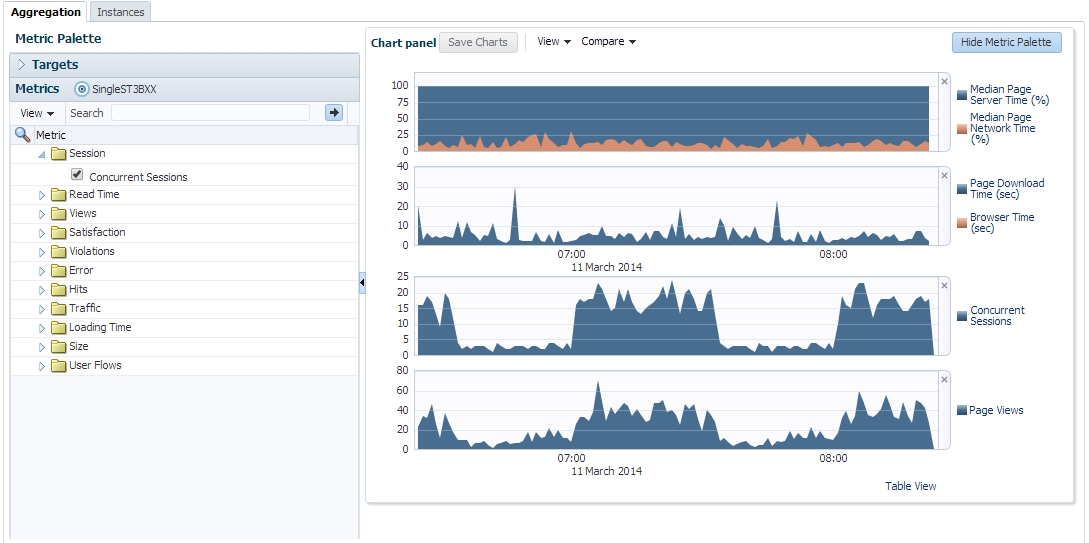
Note that the individual metrics graphs can be combined into one chart using the graph toolbar. Also some of the listed graphs show data from different parts of the metric palette combined into one chart. In Figure 13-22, the top chart shows graphs for both Median Page Server Time and Median Page Network Time.
Figure 13-22 Sample Metrics Graph
Incident Manager allows you to navigate directly from a KPI event to the Metrics page. In this case, the Metrics page is populated with time and filter settings relevant to the context of the KPI event. Therefore, you can inspect relevant metrics around the offending event, be it in time-period or in filters broader than those that correspond to the original KPI event.
From the Metrics page there is a direct link to the session diagnostics facility. When you click this link, the search properties and time-span will be re-used to find sessions that match the active criteria.
Note:
Selecting median values over a large timespan can impact performance.
Instances
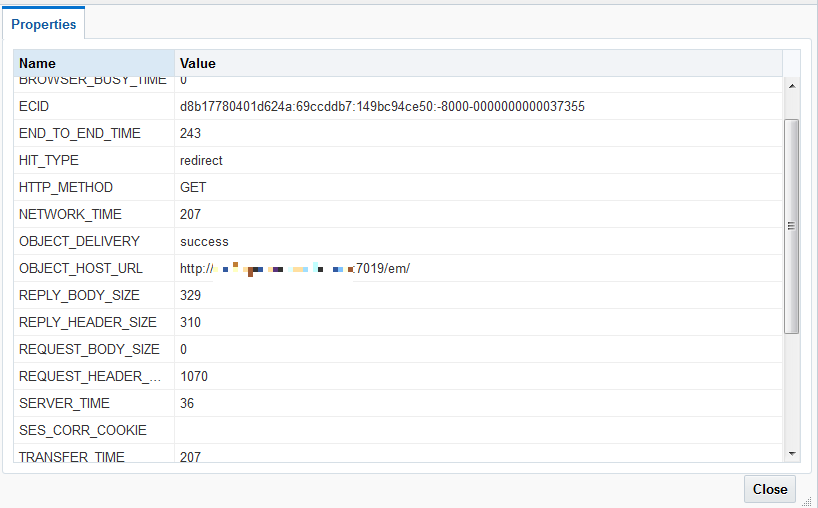
The instances tab displays events filtered using the criteria you set, for example Client Browser = Chrome. If you specify an ECID as the criteria and the ECID value refers to a spurious hit then no results are displayed, because there is not a page associated with the spurious hit. For each item in the results, you can:
-
Review the Session Activity, timing and user information (if available). Where applicable, you can expand and collapse items to display further detail, for example specific URLs associated with the session activity, or page attributes.
-
Display session information for the event, see Working With Session Diagnostics.
-
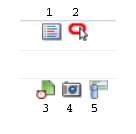
Review the icons (numbered 1 to 5) for each item where:
Icon 1 provides a link to the log viewer, showing logs associated with the current item.
Icon 2 provides a link to Request Instance Diagnostics, that is, JVM Diagnostics for the current item.
Icon 3 the indicates page loading satisfaction, a tooltip appears displaying the satisfaction level, for example Satisfied.
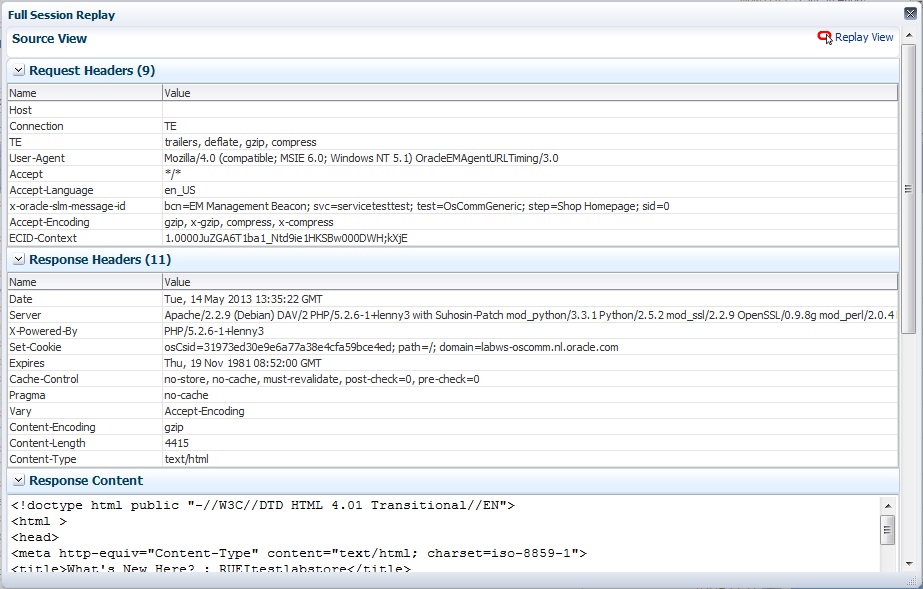
Icon 4 provides a link to replay content (for example, the original html if available).
Icon 5 provides a link to further session diagnostics, see Working With Session Diagnostics.
Some of the icons shown are the same as those for Session Diagnostics, see Figure 13-16.
Figure 13-23 Incident Icons
Monitoring User Flows
To view the User Flows page, select End User Experience and then User Flows from the End User Service menu.
This page allows you to view user flows defined for the associated RUEI suite/application. User flows indicate the time components when users were active, average page-load time within user flows, idle time, and when users were outside the user flow. For further information, see the Oracle Real User Experience Insight User's Guide.
Monitoring Logs
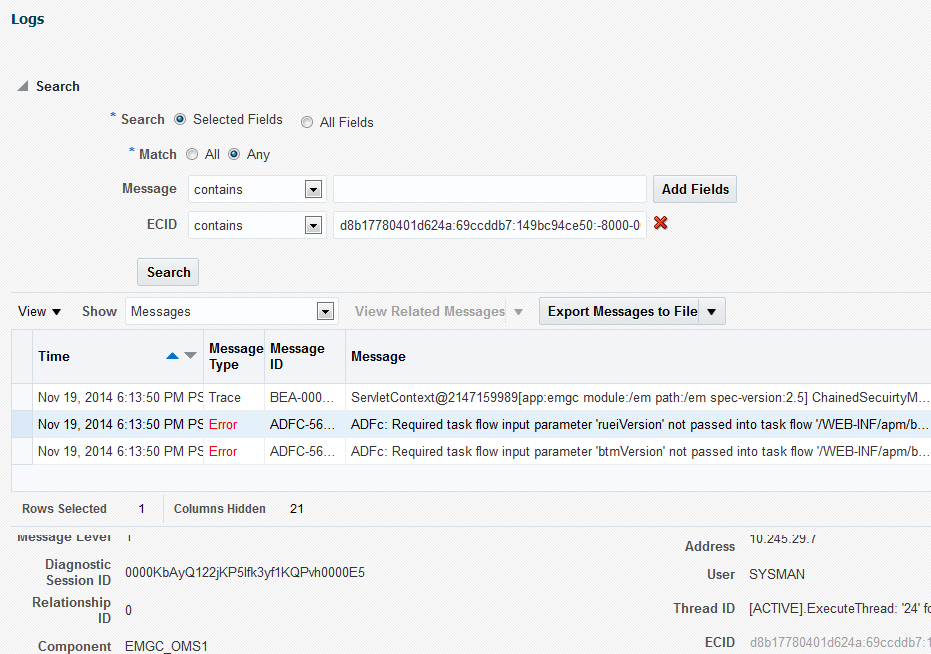
To view detailed logs, navigate to a session as described in "Working With Session Diagnostics." Then click the icon labelled 1 in Figure 13-23. This displays a screen similar to Figure 13-24.
This page allows you to view log details and search using criteria including ECID, time and session diagnosis ID.
Monitoring an End User Service
With Enterprise Manager 13c, there is a new service level target, called an End User Service (EUS) corresponding to each RUEI Application/Suite. The EUS has the same name as the RUEI Application/Suite, and can used to create a business application as described in Creating Business Applications. It is also possible to monitor an End User Service directly:
-
From the Targets menu, select Services. The currently defined services are listed. Filter for end user services. Alternatively, you can navigate to the End User Service from the Business Application home page by clicking on the Sub Services tab. The resulting list may include End User Services if the Business Application includes one.
-
If Fatal/Critical KPI is associated with an application defined in RUEI system, EUS status is also affected by status of associated Critical/Fatal KPI.
If KPI status is changed to down, EUS status will also be changed to down. If Staus is up in Key Components, but EUS staus is down, refer:
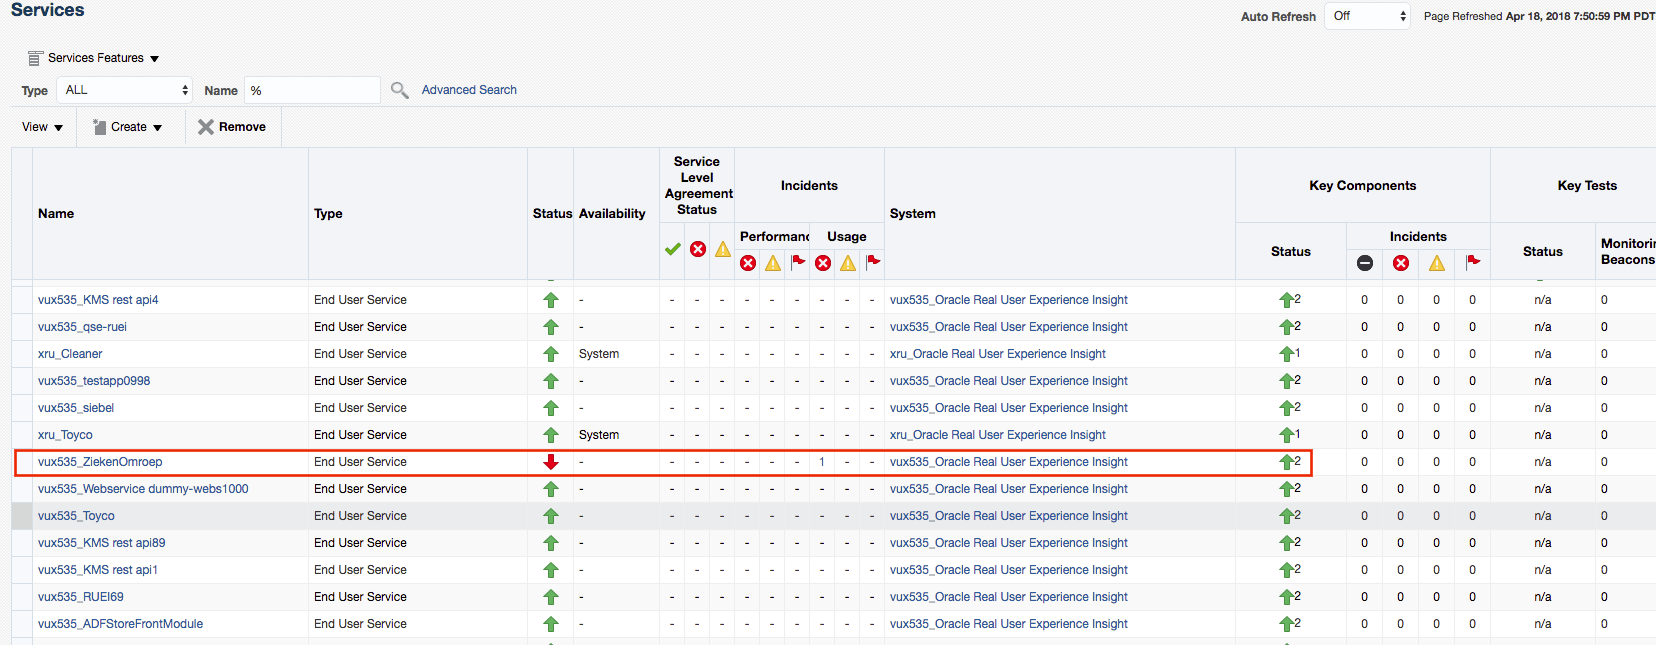
You can check the Fatcal/Critical KPI in Incident Manager page,

-
Click the End User Service of interest. The home page for the selected end user service is displayed. This is very similar to the Business Application home page shown in Figure 13-13.
The End User Service drop down menu, accessible from the End User Service home page, includes the following options for the End User Experience item:
-
Session Diagnostics, whose contents are described in Working With Session Diagnostics.
-
Metrics, whose contents are described in Monitoring End User Experience Metrics.
-
User Flows, whose contents are describe in Monitoring User Flows.
Troubleshooting an End User Service
If you encounter any issues with data from an end user service, consider the following list of checks to troubleshoot the issue:
-
Refresh the page. If the metrics displayed do not correspond to the metrics configured in RUEI, click refresh the refresh icon on the Enterprise Manager page.
-
Synchronize the RUEI system target. Navigate to the appropriate RUEI system home page and choose Synchronization from the Configuration menu item.
Monitoring KPI and SLA Alert Reporting
This section explains the KPI-related information that is available for both RUEI applications.
Note:
To monitor KPI and SLA alerts you must first complete all the steps described in "Setting Up a Connection Between RUEI and the Oracle Enterprise Manager Repository."
The alerts generated by KPIs defined for the applications, suites, and services, as well as for the SLAs for the transactions that comprise your business applications are reported as events in Incident Manager. To view these events:
-
From the Enterprise menu, select Monitoring, and then Incident Manager.
-
Open the Events Without Incidents predefined view.
-
Click the event of interest to view more information about it.
Event detail information varies depending on whether the event is based on a RUEI KPI. This is described in the following sections.
For RUEI related events, you can also access the Events Without Incidents view from the home page of a business application using the Business Application menu. Select Monitoring, then Incident Manager, and Events without Incident. This option shows events in the context of the selected Business Application.
RUEI Event Detail
After accessing the Events Without Incidents view, you will see events listed.
Figure 13-25 Incident Manager

When you click on the RUEI event, you'll see event details at the bottom of the screen in the Guided Resolution region.
Figure 13-26 Accessing RUEI Metrics from Incident Manager
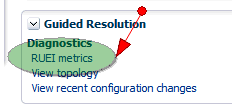
Select RUEI metrics to drill down to the RUEI Metrics page in context of the filters that were set up for the KPI as well as in the time frame of the KPI violation. The RUEI Metrics page will also show the metric that is the basis for the KPI definition.
The status of the KPIs defined for the applications, suites, and services that comprise your business applications are reported in the RUEI - Key Performance Indicators (KPIs) tab.
This provides information about the Business Application associated with the KPI, as well as the metric upon which the KPI is based. Note that for ease of management, KPIs within RUEI are grouped into categories that can be customized to contain related performance indicators. For example, separate categories could be defined for business and IT-related issues, such as user flow completion, visitor traffic, website availability, and so on.
Note:
In order to view KPI alerts within Incident Manager, you will need to set up a connection between RUEI and the Oracle Enterprise Manager Repository. The procedure to do this is described in Setting Up a Connection Between RUEI and the Oracle Enterprise Manager Repository.
Metric and Collection Settings
RUEI monitoring allows you to customize multiple metrics and collection settings. However, you are encouraged to keep the default values.
- Setting Warning and Critical threshold levels for Alerts
You can choose which alerts from RUEI are shown as Warning or Critical message in EM.
- From End User Service home page, select End User Service, then select Monitoring, and click Metric and Collection Settings.
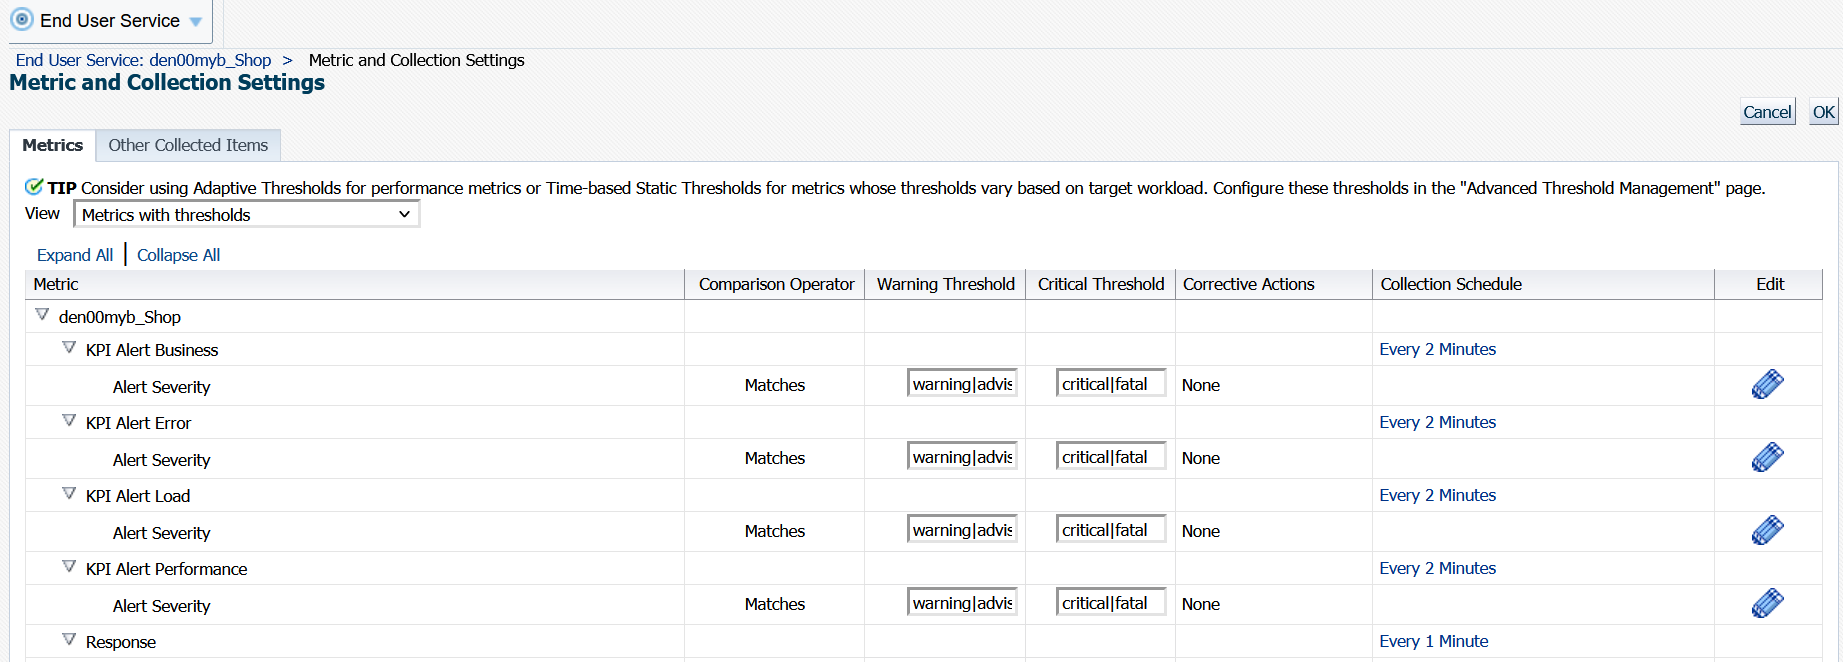
- Under the Metrics tab, you can see KPI Alert Business, KPI Alert Error, KPI Alert Load, KPI Alert Performance. These indicate the KPI alerts for Business, Error, Load and Performance category. For all the categories, by default, warning and advisory alerts from RUEI are mapped to Warning Alerts in EM, and critical and fatal alerts from RUEI are mapped to Critical Alerts in EM. Advisory, warning, criticaland fatal are the valid values for threshold. They are case sensitive. Either a single or a combination of values separated by
|can be used. For example, if you want to ignore Advisory Alerts from RUEI for Business category alerts, you can change the Warning Threshold of KPI Alert Business to warning. If you want all warning, critical and fatal messages to be seen as Critical Messages for the Performance category, you need to change the Critical Threshold under KPI Alert Performance towarning|critical|fatal.Figure 13-27 Metrics tab in the Metric and Collections Settings
- Setting Collection Schedule
The alert messages are pulled from RUEI every 2 minutes. You can edit the time period according to your preference.
- Edit Alert Messages
Select the Edit icon for a KPI Alert Category. Click on Edit Alert Message to edit the alert message or click on Reset Alert Message to reset the message to the default value.
Upgrading Business Applications
Use the following procedure if you are upgrading Business Applications from Enterprise Manager 13.4 to Enterprise Manager 13.5, and that Business Application has a RUEI connection:
- RUEI certificates must be added to the keystore of the upgraded OMS. Refer to subsection Registering RUEI Installations with Self-Signed Certificates.
- A manual synchronization job on the RUEI instance must be performed on EM with the following steps if needed.
- Select All Targets from the Target icon.
- Select RUEI System from Target Type on Refine Search panel.
- Select the RUEI instance from Target Name list on the right panel.
- From RUEI System dropdown menu, select Configuration and click Synchronization.
- Select Yes from the Confirmation dialog.
- Click on the job execution details link to see and make sure the job execution status is successful.
