6 Monitor Exadata Cloud Service
After the Exadata Cloud Service target and its member targets are discovered, you can use the Oracle Enterprise Manager environment to monitor the targets and obtain insights into their performance.
Topics:
Above performance information is currently available for Oracle Exadata Database Service on Cloud@Customer targets.
Access Exadata Metrics
For a complete list of metrics available for Oracle Exadata, see Oracle Exadata in Enterprise Manager Oracle Engineered Systems Metric Reference Manual.
To access the available Exadata Metrics:
Aggregated Exadata FlashDisk and HardDisk Metric Example
This metric category contains metrics that are aggregated over either the hard disks or flash disks in a cell. Selecting this metric from the All Metrics page generates a high-level summary, as shown below:

Expand the Aggregated Exadata FlashDisk and HardDisk Metric in the All Metrics page to show a variety of metric details, such as Average CellDisk Read Throughput, which gives an indication of the average number of bytes read from the cell disk, or Total CellDisk IO Load, which gives an indication of the total input/output load to the celldisk.


Exadata Cell Metric Example
This metric category contains the performance metrics collected at the cell level for each cell, such as CPU utilization and memory utilization. Selecting this metric from the All Metrics page generates a high-level summary, as shown below:
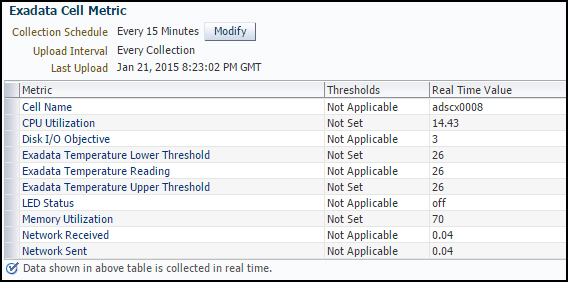
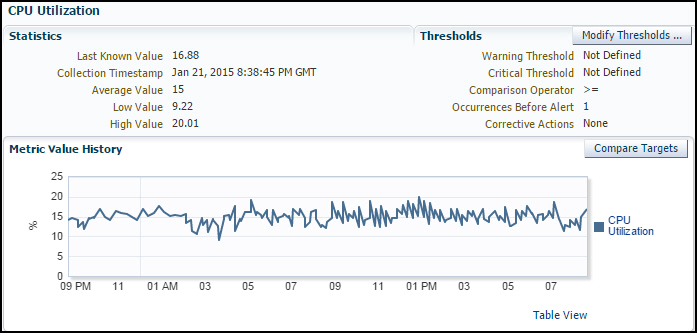
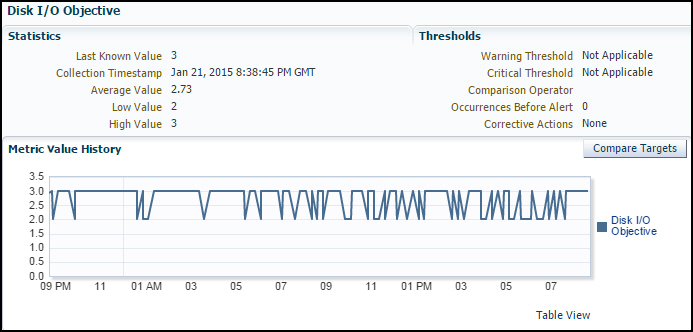
Expand the Exadata Cell Metric in the All Metrics page to show a variety of metric details, such as CPU Utilization, which provides information about the CPU utilization, or Disk I/O Objective, which provides the optimization objective which IORM is configured to achieve, for example, Low Latency or Balanced for OLTP-oriented databases, or High Throughput for data warehouses.
Exadata Key Performance Indicators Metrics Examples
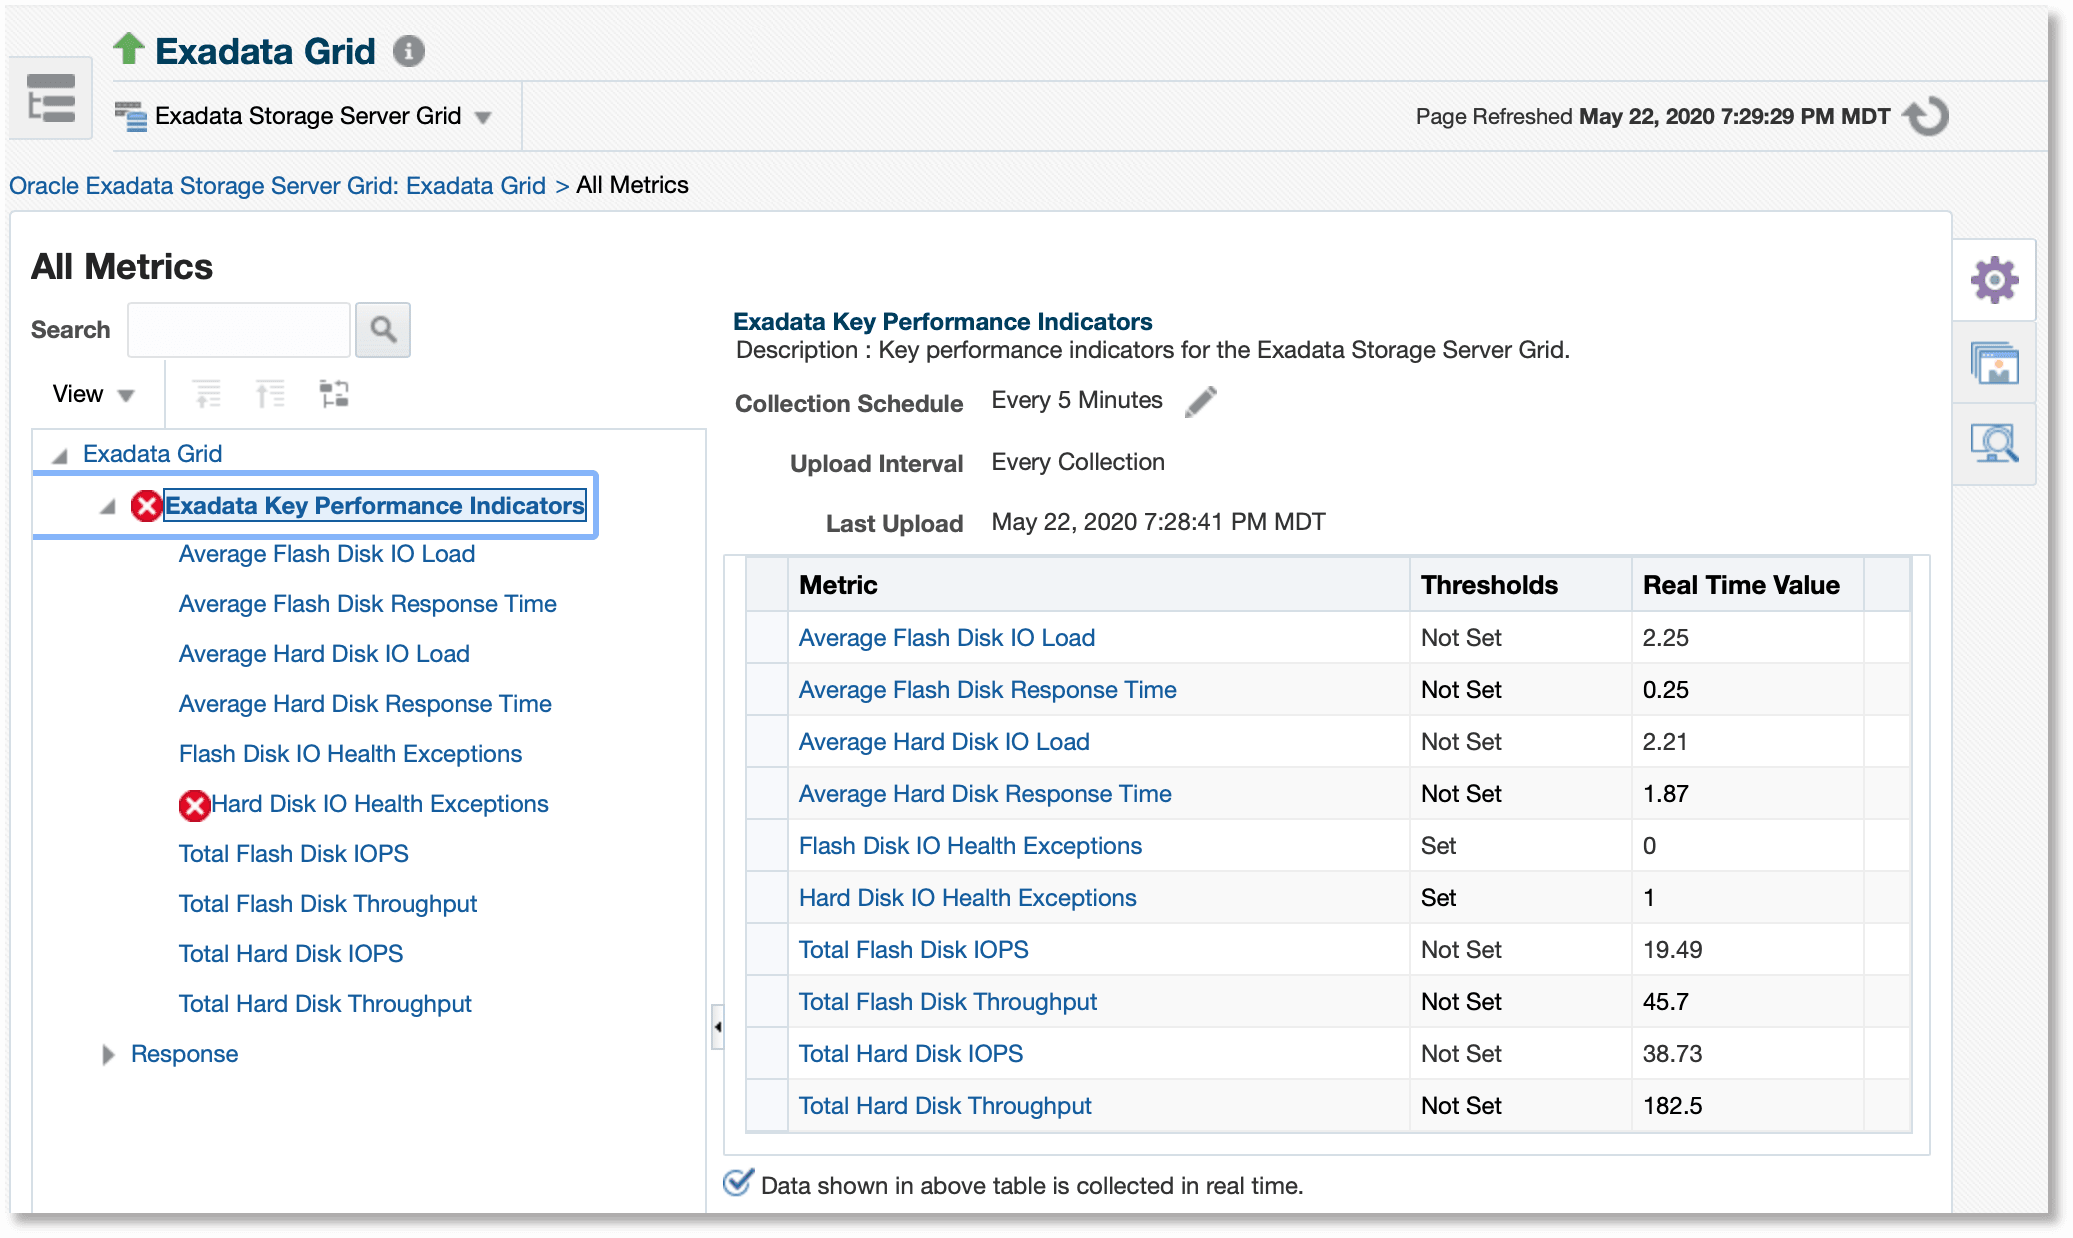
Access the Key Performance Indicators Metrics for Exadata Storage Servers and Exadata Storage Server Grid to view the metrics of the parameters as listed in the image below for an Exadata Storage Server Grid:
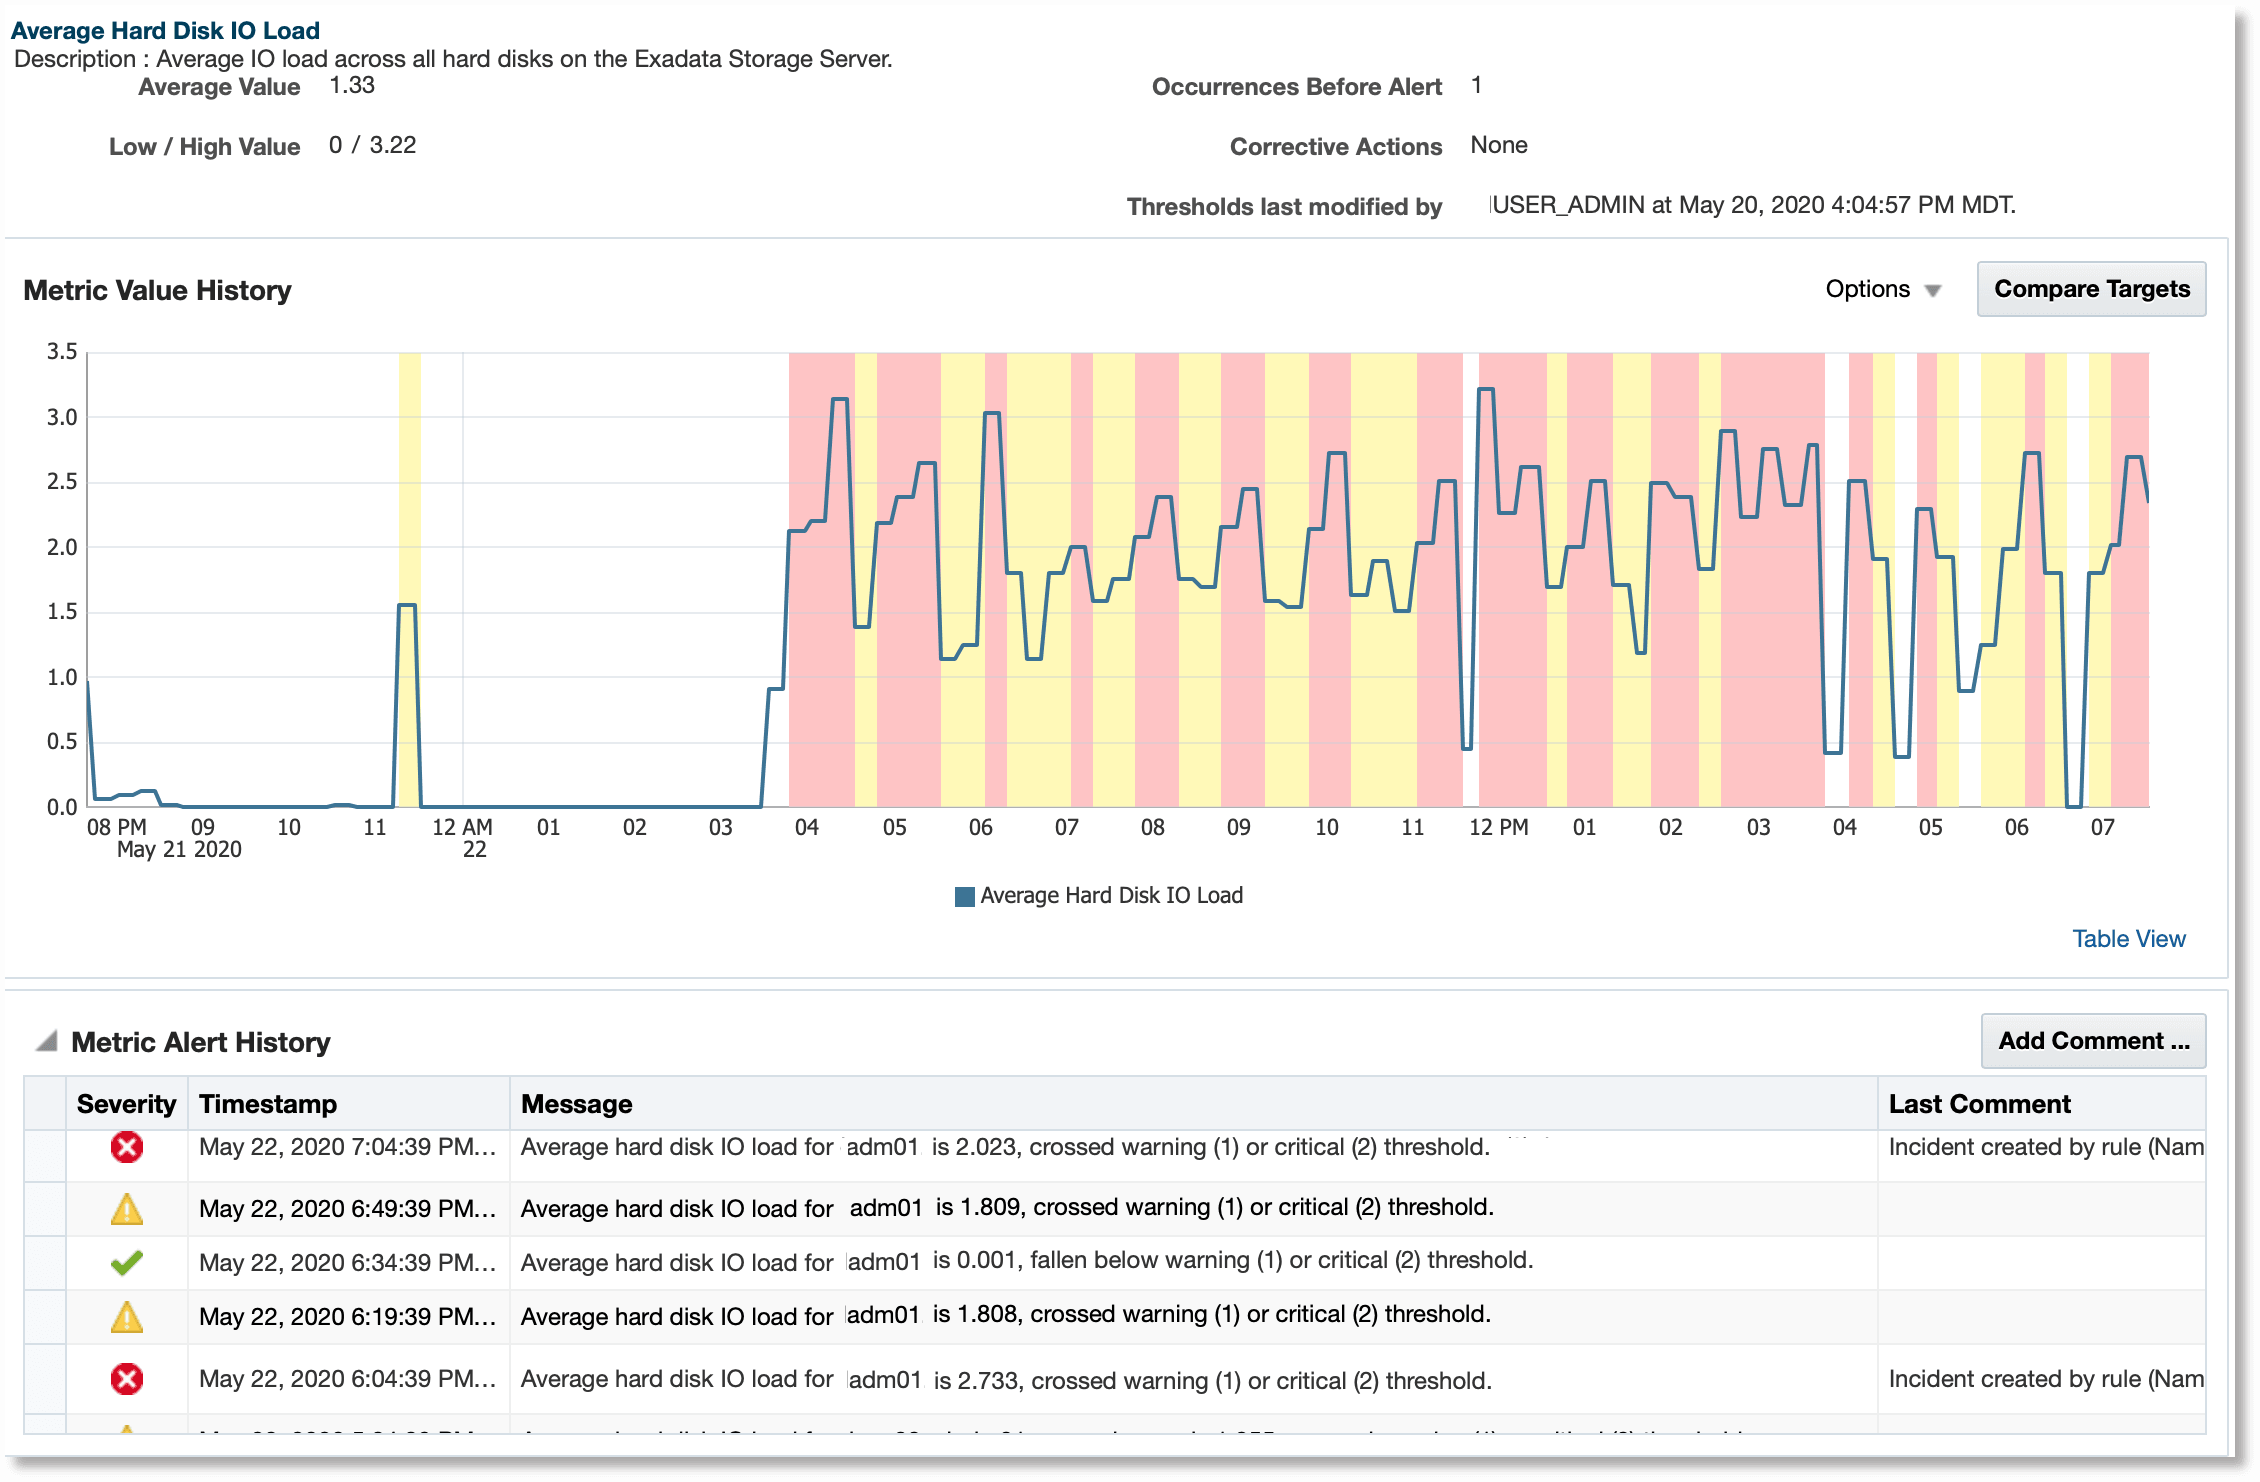
The following is an example of the Average Hard Disk IO Load metric of an Exadata Storage Server:
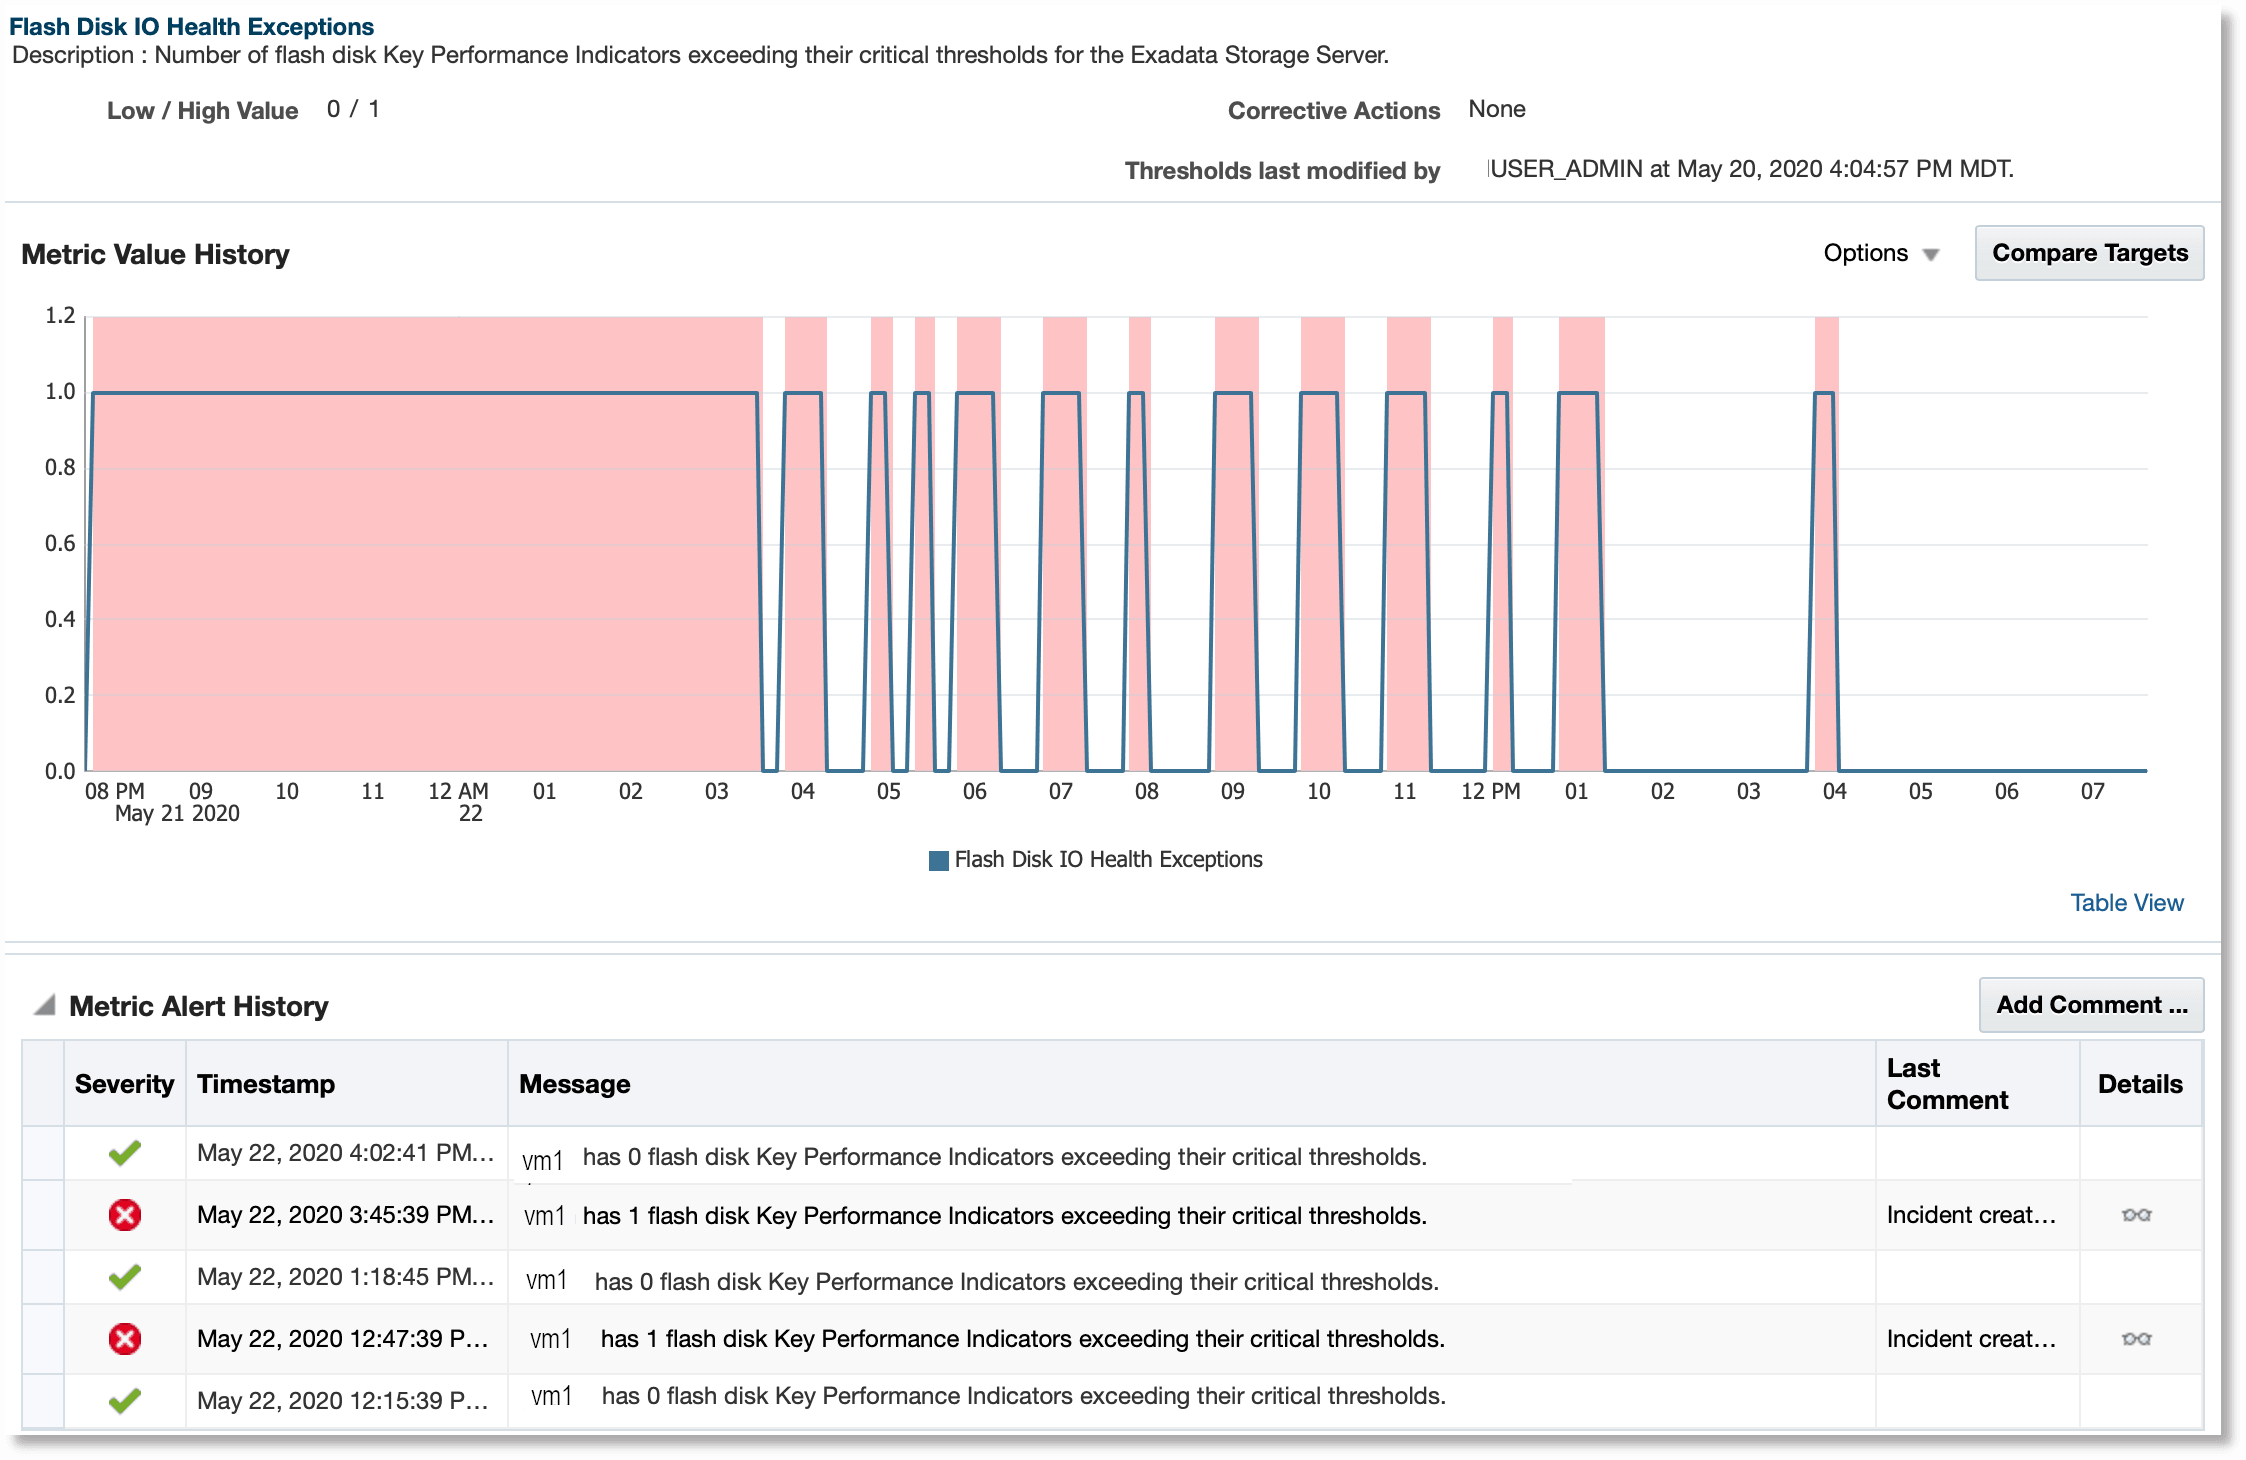
The following is an example of the Flash Disk IO Health Exceptions metric of an Exadata Storage Server:
