Viewing the PDU Information
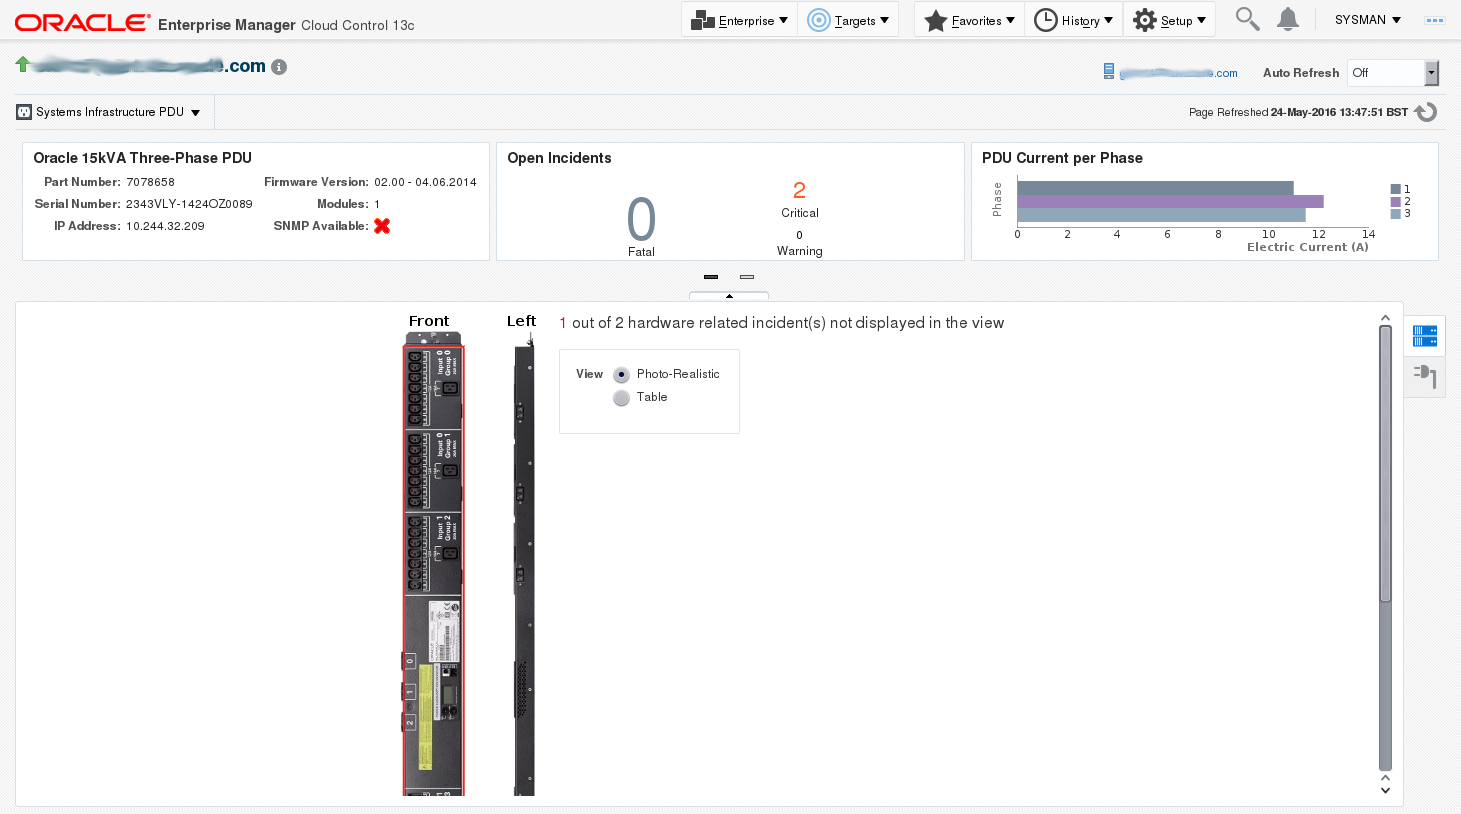
The PDU information screen is divided into two parts. The top region consists of dashlets that provide you a general overview of the system. The main region displays more detailed information of the PDU.
The first dashlet in the first series displays the summary of the PDU. It displays PDU model, part number, serial number, IP address, firmware version, count of modules and status of SNMP communication with PDU. If EM Agent can communicate with PDU using SNMP, there is a green tick, if it cannot, there is a red cross.
The second dashlet in the first series displays all the open incidents relayed on the PDU. Click on one of the displayed numbers to view the list of incidents of a given severity.
The third dashlet in the first series displays the power usage of the PDU. It displays a summary of the power (current) in amperes per phase of all the modules of the PDU.
The first dashlet in the second series displays the last configuration changes made on the PDU. It also displays the time when the last incident was raised.
Physical View of the PDU
Click the first tab in the main section of the PDU landing page for a physical view of the PDU. Physical view of the PDU displays the front and side view of the PDU. The PDU consists of one or more modules. You can click on any of the modules or the PDU itself to view more detailed information.
You can switch between photorealistic and tabular representation of the view.
-
Photorealistic view provides a realistic picture of the PDU, providing detailed graphics of all the components.
-
Table view is a tabular representation of the physical view, providing a list of displayed components with the most important information.
Figure 22-3 is a representation of the physical view of the PDU.
Figure 22-3 PDU Physical View
