5 Oracle Exadata Database Machine Administration
Creating Roles to Manage the Plug-in
To manage the plug-in, you need to create roles and administrators, and then assign roles to administrators. This restricts the privileges that each user has, for example in deleting the plug-in or accessing reports.
Note:
For security reasons, Oracle recommends that the SYSMAN account be used only as a template to create other accounts, and not used directly.
To manage the plug-ins, you must have the Self Update privileges. See Assigning Self Update Privileges to Users in Cloud Administration Guide. For information on creating custom roles, see Creating Custom Roles for Self Service Application Administrators and Users in Cloud Administration Guide.
To create roles to provide management rights to users:
When the newly created administrator logs in, unlike SYSMAN, the administrator is restricted by the privileges set.
Exadata Database Machine Topology
Database Machine management simplifies monitoring and managing tasks by integrating all hardware and software components into one entity. You do not need to monitor each target individually, but instead you can view the whole Exadata Database Machine as a single target. You can view all critical issues in the system, monitor performance, and drill down to individual targets from the Database Machine target home page.
The following topology topics are presented in this section:
Use the Topology page of Database Machine to view the topology of the system by Cluster or by Database. Clusters are a complete software system starting with a RAC database, the underlying ASM, and CRS. Clusters define one logical entity that is interconnected. The Database Machine could include several clusters, one cluster, or could just be a number of individual databases. While hardware racks define the hardware topology of the Database Machine, clusters define the logical or system topology of the Database Machine.
You can view the Topology by Cluster or Database. Click an element in the Topology and view alert data associated with the element.
You can monitor all components of the Database Machine. Database Machine monitors all subcomponent targets, whether hardware or software. This includes the database, ASM, CRS, hosts, Exadata and the InfiniBand network.
To view the topology of an existing Database Machine target:
Drilling Down to Individual Targets of Database Machine
You can drill down immediately to a subcomponent target of the Database Machine (such as RAC, a database instance, or an Exadata Storage Server).
To drill down to individual targets:
Viewing Virtual Exadata Targets
Once discovered, the Exadata plug-in shows the virtual machines monitored by Enterprise Manager Cloud Control:

Note:
The schematic diagram in the Database Machine home page is based on the content of the databasemachine.xml file found during discovery. The virtual platforms (Dom0) are displayed as compute nodes in the rack in the schematic diagram.
The Database Machine Software topology diagram will not display the physical Oracle Server, virtual Oracle Server targets (DomU), and Virtual Platform target (Dom0) targets. However, it will continue to show the host targets which are running in DomU.
The Software tab for the Exadata Database Machine target shows all clusters, ASM, and Database targets in the whole physical Database Machine grouped by clusters:

Viewing Critical Hardware Information for the Database Machine
You can view critical metrics for all the hardware subcomponents of the Database Machine such as DB hosts, Exadata Storage Servers, InfiniBand switches and so on. These metrics vary for different component targets. For example, database server nodes and Exadata servers include the CPU, I/O, and storage metrics.
To view critical hardware-centric information for the entire Database machine:
Viewing Exadata Resource Utilization
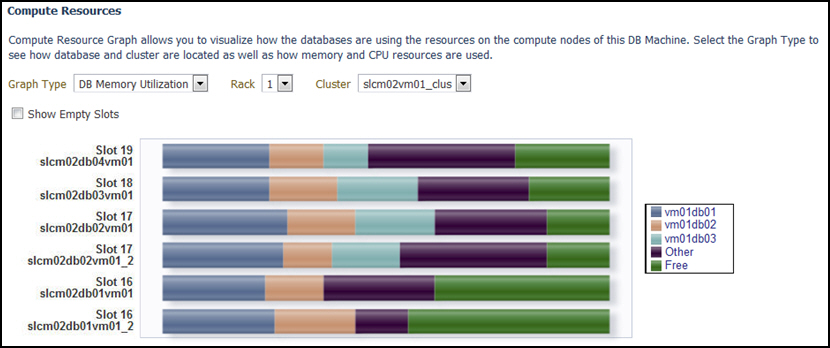
Access the utilization graphs of compute and storage resources for cluster placement, database placement, database CPU utilization, database memory utilization, database I/O utilization, and disk group space allocation. From the Oracle Exadata Database Machine home page, select the type of resources and view the graphs accordingly.
Compute Resources
From Oracle Exadata Database Machine home page, click the Database Machine drop down > select Resource Utilization > click Compute Resources.
The following compute resource allocation graphs are available in virtualized Exadata. These graphs are dependent on the virtual machine hierarchy and metric data from the VI plug-in:
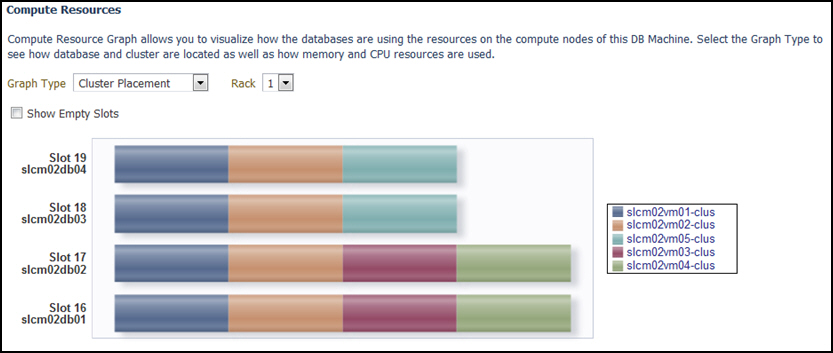
Cluster Placement
This graph shows the ClusterWare cluster placement on physical servers in a particular Exadata Database Machine rack. Since this is a placement graph, the widths of the data series reflect the number of clusters on the physical server that has the most number of clusters.
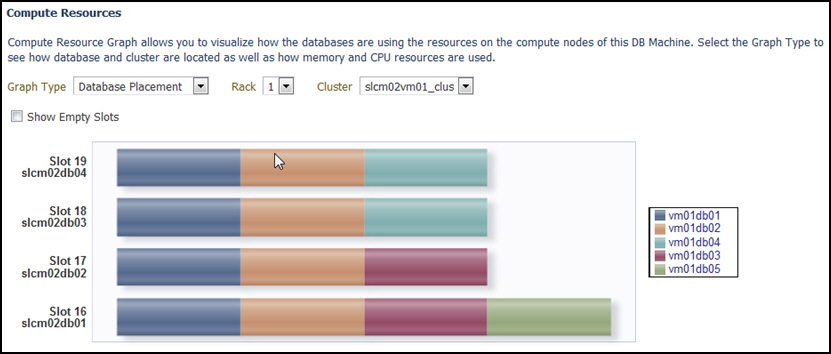
Database Placement
This graph shows the database placement on physical servers in a particular Exadata Database Machine rack for a particular DB cluster. Since this is a placement graph, the widths of the data series reflect the number of DB on the physical server that has the most number of databases for a particular DB cluster.
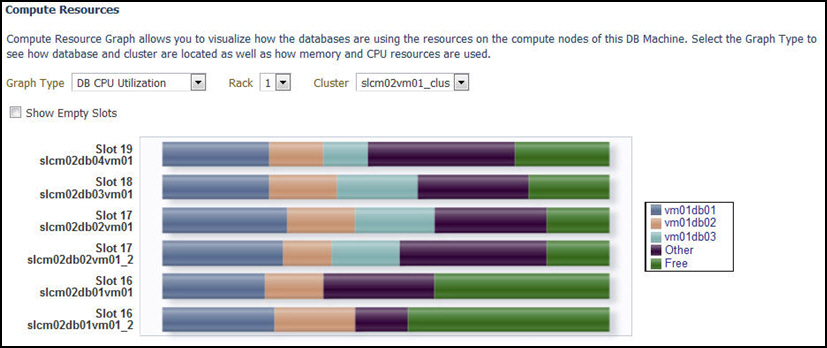
Database CPU Utilization
This graph shows the database CPU utilization per database per VM host for a particular DB cluster.
Storage Resources
From Oracle Exadata Database Machine home page, click the Database Machine drop down > select Resource Utilization > click Storage Resources.
The following storage resource allocation graphs are available in virtualized Exadata for Exadata Storage Servers and Exadata Storage Server Grid:
Exadata Storage Servers
Exadata Storage Server home page has the following sections that provide graphs and detailed information about status and performance of the target:

-
Overview: Provides details of Exadata Storage Server availability status, health details, I/O Resource Manager status, and server version
-
Performance: Provides hard drive and flash response time to IO requests, number of I/O’s in the queue averaged per disk type.
-
Capacity: Provides capacity details of different storage types available on the storage server
-
Total available capacity of Hard drive and Flash
-
Flash Cache space information about keep objects, non-keep objects, unused space. This section also provides information about the size of the flash used for logging.
-
Capacity information for ASM disk groups
-
-
I/O Activity: Provides performance information like Utilization, Latency, and Throughput for that available storage drives. This section also provides Flash Cache read and write, Smart Scan I/O throughput, InfiniBand Network throughput, Smart Log Efficiency, and IORM Boost.
-
I/O Distribution by Database: Displays information about databases that are ranked top 5 in I/O Utilization for the available storage drives. other is an aggregation of remaining databases. This section also displays the Hard Drive I/O Service Time and Flash I/O Service Time for top 5 databases and other databases.
-
Incidents and Problems: Lists alerts for the target
Database I/O Utilization
The Database I/O utilization graph shows the database I/O utilization per Exadata Storage Server of this Exadata Database Machine.
To access the Database I/O Utilization graph, from the Exadata Storage Servers home page, go to the section I/O Distribution by Databases > click I/O Distribution for All Databases.
I/O Distribution by Databases:

I/O Distribution for All Databases - Graphic View:

I/O Distribution for All Databases - Tabular View:

Workload Distribution by Databases
The Workload Distribution by Databases graphs show database workload performance on the hard drive and flash and the flash cache space usage.
To access the Workload Distribution by Databases graphs, from the Exadata Storage Servers home page, go to the section I/O Distribution by Databases > click IORM Settings.
To access the Flash Cache Space Usage graph, click the Flash Cache Space Usage tab.
Flash Cache Space Usage:

To view the graphs that correspond to the performance of hard drives and Flash, click the Performance tab.
This section provides database workload performance on Hard Drive and Flash. You can filter databases based on their workload performance rankings. You can view the graphs for the filters like top 5 databases, rank based pagination, or a specific database. You can drill down from database workload performance monitoring to pluggable database and consumer groups. Following are some of the example graphs:
IORM Wait Time for All Databases (Hard Drive and Flash Drive):

I/O Utilization and Average small I/O response time for All Databases (Hard Drive and Flash Drive):

Exadata Storage Server Grid
Exadata Storage Server Grid home page displays the aggregated status and performance data for all the Exadata Storage Servers. The sections are similar to those that are listed for individual Exadata Storage Server targets.
An example Exadata Storage Server Grid home page:

In the Capacity section of the Exadata Storage Server Grid home page, the ASM disk group capacity is displayed for the selected cluster.
You can view the I/O Utilization graph and Workload Distribution of Databases graph by clicking on the links I/O Distribution for All Databases and IORM Settings in the section I/O Distribution by Databases. The graphs that are displayed are the aggregated information from the Exadata Storage Server member targets of the grid. For details of the graphs, see Database I/O Utilization and Workload Distribution by Databases.
Viewing Metrics
Metrics can be viewed at the component level of Exadata Database Machine. To view the Exadata Storage Server metrics:
Adding Exadata Database Machine Components Manually
You can add Exadata Database Machine components manually using the following steps:
Removing an Exadata Database Machine Target
-
Remove all members of the Oracle Exadata Database Machine. If the member target is shared with another Database Machine target, then the member target will not be deleted and will continue to be monitored. In other words, the member targets will be deleted if they are associated with only this Database Machine target.
-
Remove only system members of the Oracle Exadata Database Machine. The other member targets will not be deleted and will continue to be monitored. They can be associated to another Oracle Exadata Database Machine, if required.
Note:
You must remove the SNMP configuration on the InfiniBand switch, ILOM, Cisco switches (RoCE and Admin), and PDU manually if you remove these targets from Enterprise Manager.
SNMP unsubscription is performed automatically for the targets like Oracle Exadata Storage Servers and Oracle Exadata Compute Nodes based on the options selected.
To remove an Exadata Database Machine target:
Note:
Host targets for the compute nodes and any targets that are also member targets of another Oracle Exadata Database Machine target will not be removed. System and non-system targets include:
System Targets:
-
Oracle Exadata Database Machine
-
Oracle Infiniband Fabric (Enterprise Manager 13c target)
-
Oracle Exadata Storage Server Grid
Non-System Targets:
-
Oracle Exadata Storage Server
-
Oracle Exadata KVM
-
Systems Infrastructure Switch
-
Systems Infrastructure PDU
-
Systems Infrastructure Rack
-
Oracle Infiniband Switch (Enterprise Manager 13c target)
-
Oracle Engineered System Cisco Switch (Enterprise Manager 13c target)
-
Oracle Engineered System PDU (Enterprise Manager 13c target)
-
Oracle Engineered System ILOM Server (Enterprise Manager 13c target)
Removing a Component of a Database Machine Target
If you need to remove a component of an Exadata Database Machine target, you can perform this task within Enterprise Manager Cloud Control 13c:
- From the Database Machine home page's Target Navigation pane, right-click on the target item you wish to remove.
- Select Target Setup, then Remove Target.
- A warning page will display to confirm the target deletion. Click Yes to continue.
Updating the Exadata Database Machine Schematic Diagram
The schematic diagram illustrates the placement and status of the components of the Exadata Database Machine.
In some cases, the Exadata Database Machine schematic diagram is not displaying the components correctly. For example:
-
You may have successfully discovered the Exadata Database Machine, but some components are not displaying correctly in the Exadata schematic diagram. Instead, an empty slot is shown in place of the component.
-
The Exadata Database Machine schematic diagram shows the status of the component as "red/down" where as individual components would really show that they are up and running fine.
-
You want to re-locate or rearrange the order of the components in the slots of Exadata Database Machine schematic diagram.
To accomplish these tasks, you will need to drop a component from the schematic diagram and add the correct one:
Drop a Component from the Exadata Database Machine Schematic Diagram
To drop a component from the Exadata Database Machine schematic diagram:
-
From the Targets menu, select Exadata.
-
From the Oracle Exadata Database Machines and Cloud Services page, select the Oracle Database Machine target that you want to modify.
Enterprise Manager displays the Oracle Exadata Database Machine home page of the selected Database Machine.
-
On the Exadata Database Machine schematic diagram right click on the component you wish to remove, click Remove Target.
-
Ensure you have selected the correct component in pop-up dialog box and click OK.
-
The Exadata Database Machine schematic diagram will refresh to show the empty slot.
Provisioning Virtualized Exadata Clusters
Provisioning involves repeatable, reliable, automated, unattended, and scheduled mass deployment of a RAC Cluster including virtual machines (VMs), Oracle Database (DB), Grid Infrastructure, and ASM on Virtualized Exadata.
Note:
Exadata Virtualized Provisioning is only available for virtual Exadata configured with InfiniBand networking.
The Exadata plug-in's virtualization provisioning functionality provides the following capabilities:
Creating a Database Cluster
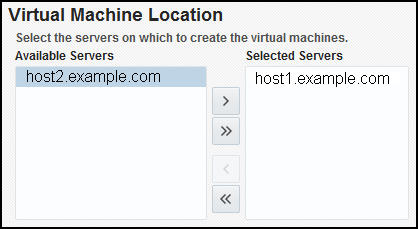
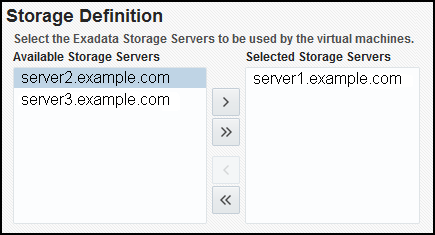
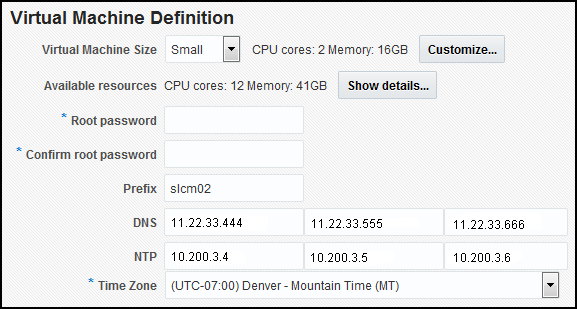
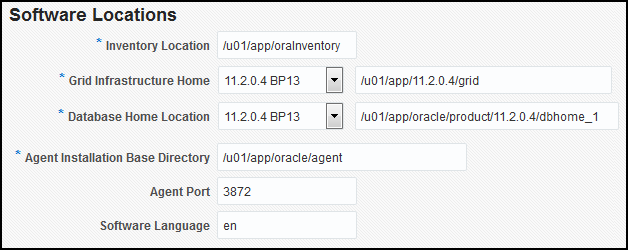
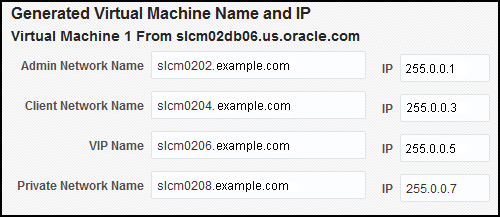
To create a database cluster, select the servers on which you want to create the virtual machines (VM), and select the Exadata Storage servers that can be used by the virtual machines. Provide additional information like the credentials to access them, VM definition, software locations, operating system users and groups, and networking information to complete the setup.
Scaling Up a Database Cluster
You can scale up the compute ability of your database cluster by creating and adding more virtual machines to the cluster.
Scaling Down a Database Cluster
To scale down a database cluster, the Virtual Machine is removed from the cluster:
Exadata Storage Server Management
This section provides introductory instructions for managing Exadata Storage Servers. The following topics are presented:
About Exadata Storage Server
An Exadata Storage Server is a highly optimized storage server that runs Oracle Exadata System Software to store and access Oracle Database data. Use the Exadata Storage Server Home page to manage and monitor the Oracle Exadata Storage Server as an Enterprise Manager Cloud Control target. You can discover and consolidate management, monitoring and administration of a single or a group of Oracle Exadata Storage Servers in a datacenter using Enterprise Manager.
Note:
As the Exadata Database Machine has evolved, there have been different names used to reference the Exadata Storage Server, including storage cell and cell server. Any reference with these names in this or related documentation refers to Exadata Storage Server.
Exadata Storage Servers can be discovered automatically or manually. The individual Exadata Storage Server is monitored and managed as an Enterprise Manager target and provides the exception, configuration and performance information.
Grouping of Exadata Storage Servers is used for easy management and monitoring a set of Storage Servers. You can group them both manually and automatically. The grouping function provides an aggregation of exceptions, configuration and performance information of the group of Exadata Storage Servers.
You can view performance analysis by linking Exadata performance both at the Exadata Storage Server level and group level to ASM and database performance. You can drill down to Exadata configuration and performance issues from both the database and ASM targets.
Storage Grid (for example, multiple database/ASM instances sharing the same Exadata Storage Server) is supported to the same extent as dedicated storage.
Viewing an Exadata Storage Server Topology
You can view the topology of an Oracle Exadata Storage Server target by following the steps below:
Performing Administration Tasks on Exadata Storage Servers
Note:
It is best practice to manage and configure Exadata Storage Servers consistently. Enterprise Manager provides the ability to perform Administration Tasks on all Exadata Storage Servers in an Exadata Database Machine from the corresponding Exadata Storage Server Grid target home page, or on individual Exadata Storage Server targets from the Exadata Storage Server target home page. To the maximum extent possible, consider managing from the Exadata Storage Server Grid target to manage the servers consistently, selecting a subset of servers if necessary. The instructions in this section can be used for either the Exadata Storage Server Grid or Exadata Storage Server targets.
To perform an administration operation on an Exadata Storage Server, such as executing a Exadata Storage Server command, follow these steps:
Managing the I/O Resource
Oracle Exadata Storage Servers are added as targets during the Exadata Database Machine discovery workflow (see Exadata Database Machine Discovery) and are grouped automatically under the group Exadata Storage Server Grid. Monitoring and Managing I/O Resource can be performed at Exadata Storage Server Grid and Exadata Storage Server target level. The information provided below is for Grid and Server target.
To access the IORM Performance page:
-
Select an Exadata Storage Server:
-
From the Targets menu, select Exadata.
-
Select a DB Machine from the list of Target Names.
-
In the Target Navigation pane, expand the Exadata Grid item and click one of the Exadata Storage Servers.
-
-
Once you have selected an Exadata Storage Server, click the Exadata Storage Server menu, select Administration, then Manage I/O Resource.
The IORM page has the following sections:
-
I/O Resource Manager Settings: This section helps to view and update the IORM configuration of Exadata Storage Server. Use Get Latest button to view the latest Exadata Storage Server IORM configuration. Use the same section to edit and update the IORM configuration on Exadata Storage Server.
-
Database Resource Management(DBRM) Settings: This section display the list of databases and their basic configuration, that are using Exadata Storage Server resources. From this page, you can launch the database resource management page.
-
Workload Distribution by Databases: The IORM Monitoring section of the page provides a view of the performance statistics of Disk I/O (Wait, IOPS, MBPS, Utilization, Latency, and Objective charts). These statistics help to identify which databases and consumer groups are using the available resources. They also help to adjust the IORM configuration (using IORM Settings section on the same page) as needed.
IORM Configuration includes IORM Objective and Inter-Database Plan.
For further details on managing I/O resources, refer to the Managing I/O Resources chapter in the Oracle® Exadata Storage Server Software User's Guide.
Add/Update IORM Configuration
To update the I/O Resource Manager (IORM) settings (for Exadata Storage Server software release 12.1.2.1.0 and later):
-
Navigate to the IORM page as described above. The image shows the I/O Resource Manager (IORM) Settings pane.
Note:
You can also update a single Exadata Storage Server. Expand the Exadata Grid group to view all Exadata Storage Servers associated with the group. Click the Exadata Storage Server you want to update.
The steps to update the IORM settings is the same for a single Exadata Storage Server or group of Exadata Storage Servers.
-
Update the inter-database plan by editing existing values or add/remove directives to Inter-database plan using the Add/Remove buttons available on Inter-database table.
-
From the Database Name column, select a database from the drop-down menu or enter a database name.
-
Enter a value for the Hard Disk I/O Utilization Limit column.
-
Enter a value for the Database I/O Share column.
-
Enter minimum and maximum values (in MB) for the Flash Cache column.
-
Fill the remaining attributes like Type and Role.
-
-
In the Disk I/O Objective drop-down menu, select an objective from the list (Auto is the default):
-
Low Latency - Use this setting for critical OLTP workloads that require extremely good disk latency. This setting provides the lowest possible latency by significantly limiting disk utilization.
-
Balanced - Use this setting for critical OLTP and DSS workloads. This setting balances low disk latency and high throughput. This setting limits disk utilization of large I/Os to a lesser extent than Low Latency to achieve a balance between good latency and good throughput.
-
High Throughput - Use this setting for critical DSS workloads that require high throughput.
-
Auto - Use this setting to have IORM determine the optimization objective. IORM continuously and dynamically determines the optimization objective, based on the workloads observed, and resource plans enabled.
-
Basic - Use this setting to disable I/O prioritization and limit the maximum small I/O latency.
Note:
If the Auto and Balanced objectives are not applicable (i.e., they have no impact on I/Os in Extreme Flash Exadata Storage Servers), they will not appear in the IORM page.Click Update. The Exadata Storage Server Administration Wizard will appear prompting you for the information necessary to complete the Disk I/O Objective configuration:
-
On the wizard's Command page, the Cell Control Command-Line Interface (CellCLI) value should be as shown when the Disk I/O Objective selected is
auto:# alter iormplan objective = 'auto'Click Next.
-
On the wizard's Admin Credentials page, enter the user name and password for the selected Exadata Storage Servers.
Click Next.
-
On the wizard's Schedule page, enter a job name (required) and job description (optional). Select an option to start Immediately or Later. If you select the Later option, enter the time that you want the job to run.
Click Next.
-
On the wizard's Review page, verify that the settings are correct. To submit the command, click Submit Command.
After the job is successfully submitted, the Job Status page is displayed.
Click Return to return to the I/O Resource Manager (IORM) Settings pane.
-
-
Click Get Latest to refresh the IORM configuration from Exadata Storage Server, which will include the updated Disk I/O Objective.
-
To confirm the Disk I/O Objective setting, for example if it was selected as
auto, run the following command from the command line:# dcli -g cell_group cellcli -e "list iormplan attributes objective"Output should show the value
auto:cell01: auto cell02: auto cell03: auto . . . cell14: auto
The Inter-Database Plan
An inter-database plan specifies how resources are allocated by percentage or share among multiple databases for each Exadata Storage Server. The directives (rows) in an inter-database plan specify allocations to databases, rather than consumer groups. The inter-database plan is configured and enabled with the CellCLI utility at each Exadata Storage Server. Only one inter-database plan can be active on a Exadata Storage Server at any given time.
Percentage based Inter-database plan: Use allocations to specify percentage for I/O distribution for each database. With Percentage based plan, IORM can manage up to 32 databases. You can allocate resources across 8 different levels. A percentage based inter-database plan is similar to a database resource plan, in that each directive consists of an allocation amount and a level from 1 to 8. For a given percentage based plan, the total allocations at any level must be less than or equal to 100 percent. An inter-database plan differs from a database resource plan in that it cannot contain sub-plans and only contains I/O resource directives.
Share based inter-database plan: This is the recommended method for Inter-database plans. Use share to specify the relative priority for a database. A higher share value implies higher priority and more guaranteed I/O resources. Each database is given a share value which is an integer between 1 and 32. Use the limit method to restrict the I/O utilization for a database to a specified utilization limit. The sum of the shares can be greater than 100. Share-based plans support up to 1024 directives within the Inter-database plan.
I/O Resource Management can provide predictable performance by guaranteeing space in Exadata Smart Flash Cache. For this use Flash Cache Space columns to specify space allocation for each database in Inter-database plan.
Specify the attributes values for each directive in Inter-database plan as per requirement.
Note:
If the Exadata Storage Server version is 11.2.3.1.0 or earlier, the Share, Percentage based inter-database plan radio buttons are not available. You can view only Percentage-based options (that is, the drop-down only displays the Basic, Advance options).
When considering an inter-database plan:
-
If Oracle Exadata Storage Server is hosting only one database, then an inter-database plan is not needed.
-
If an inter-database plan is not specified, then all the databases receive an equal allocation.
Diagnosing Exadata Storage Server Alerts
Enterprise Manager listens for Exadata Storage Server alerts sent from the Exadata Storage Server Management Server; so, any hardware failure or Exadata Storage Server error will be reported in Enterprise Manager. For information about the error messages you might encounter on the Exadata Database Machine, refer to the Error and Alert Messages in Oracle Exadata Database Machine Error Message Reference Guide.
Managing the InfiniBand Fabric
All InfiniBand Switches are discovered automatically during the database machine discovery workflow (see Exadata Database Machine Discovery) and are grouped automatically under the group IBFabric@<switch-name>.
Note:
InfiniBand Fabric target is not available for RoCE Exadata.
- From the Enterprise Manager home page, select Targets, then Oracle Exadata Database Machines and Cloud Services.
- In the Target Navigation pane, select InfiniBand Fabric from the list.
- In the IB Fabric pane, you can view an overview and activity summary for all InfiniBand Switches.
- Click Refresh for an On Demand refresh of the InfiniBand schematic. Updates reflect the real-time data.
The following topics address managing your InfiniBand network:
InfiniBand/RoCE Switch Metrics
- Status / Availability
- Port status
- Vital signs: CPU, Memory, Power, Temperature
- Network interface various data
- Incoming traffic errors, traffic Kb/s and %
- Outgoing traffic errors, traffic Kb/s and %
- Administration and Operational bandwidth Mb/s
The following metrics are available for your InfiniBand Fabric:
Switch Aggregated Status
The Aggregate Sensor takes input from multiple sensors and aggregates the data to identify problems with the switch that require attention. Whenever the sensor trips into an "Asserted" state (indicating a problem) or "Deasserted" (indicating that the problem is cleared) for a component on the switch, associated Enterprise Manager events will be generated.
Response
This is the main metric indicating availability of the InfiniBand/RoCE switch. It is collected every 60 seconds by default through the management interface of the switch.
Switch Configuration
This metric captures the switch configuration. The information collected is valuable only to Oracle Support, which will use it to assist in debugging situations.
Switch Basic Status
This metric gives basic status of the switch like Booted on, Locator light status, Power status and overall status of the switch.
Sensor Status
This metric gives the status of various sensors available in the switch like power supply, fan, motherboard, and cooling.
Switch Port Statistics
This metric provides information on number the of incoming and outgoing errors, incoming and outgoing octets.
Component State
This metric gives the state of various components in the switch like Fan, Motherboard, Power Supply and various InfiniBand and Ethernet ports.
Network Port InfiniBand performance
This metric gives performance data of each InfiniBand port.
Performing Administration Tasks on InfiniBand Networks
Note:
Administrative tasks are not allowed to be performed on RoCE switch.
To perform an administration operation on an InfiniBand Network, follow these steps:
Flash Cache Resource Monitoring
The Oracle Exadata plug-in release 13.1.0.1.0 and later provides flash cache resource monitoring for Oracle Exadata Storage Servers. The following information is displayed in different sections and pages:
I/O Distribution by Databases: This section on the home page gives the latest performance statistics for the Top 5 databases based on their I/O Utilization.
I/O Distribution for All Databases: This page gives the latest performance statistics for all the databases in the order of I/O Utilization. This page provides both Graph View and Table View. To launch this page, from home page, go to the section I/O Distribution by Databases > Click I/O Distribution for All Databases.
Workload distribution by Databases: This tab on IORM page provides historical performance statistics by databases for both Hard Drive and Flash. You can specify Top 5 databases or specific databases to view their graphs.
Flash Cache Space Usage: This tab on IORM page provides historical statistics specific to Flash Cache Space Usage by databases.
To view the graphs, go to Storage Resources.
Exadata Database Machine Fault Monitoring
Oracle Enterprise Manager Cloud Control provides hardware fault monitoring for Oracle Exadata Database Machine. For a detailed list of the available hardware alert messages, see Hardware Alert Messages for Oracle Exadata Database Machine and Oracle Exadata Rack in Exadata Database Machine Error Message Reference Guide.
Monitoring Exadata Database Machine Components
Enterprise Manager collects details for the following components:
Exadata Storage Servers
An Enterprise Manager Agent could collect Exadata Storage Server metrics through cellcli calls via ssh, ExaCLI or RESTful API. SNMP traps are sent to the Enterprise Manager Agent for subscribed alert conditions.
Monitoring with cellcli requires SSH equivalence to be set up
between the agent user and the Exadata Storage Server monitor user on each Exadata
Storage Server.
On the home page, rich storage data is collected, including:
-
Aggregate storage metrics.
-
Exadata Storage Server alerts via SNMP (PUSH).
-
Capacities.
-
Database-level metrics.
Cisco/RoCE Switch (Systems Infrastructure Switch)
An Enterprise Manager Agent runs a remote SNMP get call to collect
metric data for the Cisco/RoCE switch, including details on:
-
Status / Availability
-
Port status
-
Vital signs: CPU, Memory, Power, Temperature
-
Network interface various data
-
Incoming traffic errors, traffic kb/s and %
-
Outgoing traffic errors, traffic kb/s and %
-
Administration and Operational bandwidth Mb/s
-
ILOM Targets (Systems Infrastructure Server)
An Enterprise Manager Agent runs remote SSH calls to each SI server target.
The following details are collected:
-
Response – availability
-
Sensor alerts
-
Temperature
-
Voltage
-
Fan speeds
-
Configuration Data: Firmware version, serial number, and so forth.
-
Power Distribution Units (PDUs)
An Enterprise Manager Agent runs remote SNMP get calls and receives SNMP traps (PUSH) from each PDU. Collected details include:
-
Response and
pingstatus. -
Phase values.
InfiniBand Switch (Systems Infrastructure Switch)
An Enterprise Manager Agent runs remote SSH calls to the InfiniBand switch to collect metrics. The InfiniBand Switch sends SNMP traps (PUSH) for all alerts.
Monitoring requires ssh equivalence for the root
or ilom-admin user for metric collections such as:
-
Response
-
Various sensor status
-
Fan
-
Voltage
-
Temperature
-
-
Port performance data
-
Port administration
Automatic Indexing for Database Nodes
The automatic indexing feature automates the index management tasks in database nodes with Oracle Database 19.3 or later. Automatic indexing automatically creates, rebuilds, and drops indexes in a database based on the changes in application workload, thus improving database performance.
This feature includes the following options:
-
Settings: On the Automatic Indexing Configuration Settings page, you can enable and disable automatic indexing, specify the retention period for unused indexes and automatic indexing logs, and specify the schemas to be included or excluded from using automatic indexing.
-
Activity Report: On the Automatic Indexing Activity Report page, you can enter the following details and click Generate Report to view the details of the auto indexes generated in the database:
- Report Format: Select the format in which you want the report to be generated.
- Sections: Select the sections that you want displayed in the report. The Summary, Index Details, Verification Details, and Errors options are selected by default in the Sections field, and you can opt to remove any of these sections.
- Time Period: Select the monitoring time period for which you want the report to be generated.
If you select the default options, namely the HTML report format and all the options in the Sections field for a specific time period, then the following sections are displayed in the Report Summary:- Overview of Executions: This section displays the overall performance improvement factor as a result of the auto indexes, the number of times the auto index operations were completed, the number of times the auto index operations were interrupted, and fatal errors, if any. Note that the Overview of Executions section is displayed irrespective of which other section is selected in the Sections field.
- For the Summary section option, the
following bar graphs are displayed:
- Summary of Auto Indexes Actions
- Summary of Auto Indexes SQL Actions
- Summary of Manual Indexes
- For the Errors section option, the Error Summary pie chart is displayed.
- For the Index Details section
option, the following sections are displayed:
- Index: Created
- Index: Dropped
You can click a row in the Index: Created and Index: Dropped sections to view more details such as the ID of the index that was created or dropped, the Key, and Type. You can also use the Download All Index Created Details and Download All Index Dropped Details options given in these sections to download the index details in a
.csvformat. - For the Verification Details section option, the Verification Details section is displayed, which includes the details of the SQLs for which auto indexes were generated and used. You can click a row in this section to view more details such as SQL ID, SQL Text, and Improvement Factor.
If you select the TEXT report format in the Report Format field, then the same information is displayed in a plain text format and can be downloaded by clicking theText Download option.
For information on managing auto indexes, see Managing Auto Indexes in Oracle Database Administrator’s Guide.
Reporting
To monitor the performance of the database machine or the storage server by viewing the metrics and diagnostic data, access the support workbench or create a dashboard for access the database machine reports and capacity planning reports.
Accessing Oracle Support Workbench for Exadata Storage Server
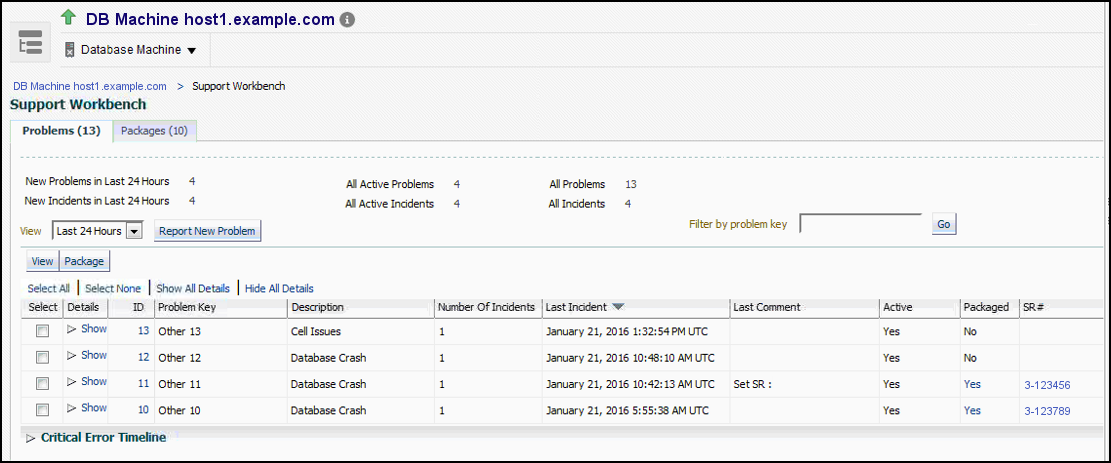
You can access the Oracle Support Workbench for the current Exadata Storage Server to access diagnostic data for problems and incidents related to the Exadata Storage Server.
To access the Support Workbench for a single Exadata Storage Server, follow these steps:
Accessing BI Publisher Enterprise Reports
Access the Oracle Business Intelligence (BI) Publisher reports in Oracle Enterprise Manager Cloud Control to run the Exadata reports Exadata Capacity Planning Details and Exadata vCPU Consumption Report to understand the health and utilization of your Exadata portfolio.
To access the Exadata reports in the BI Publisher application from Enterprise Manager:
-
From Enterprise menu, click Reports > click BI Publisher Enterprise Reports.
The BI Publisher Enterprise Reports page is displayed.
-
Expand the Exadata Reports tree.
The links to the following reports are displayed:
-
Capacity Planning Details: The capacity planning report for Oracle Exadata Database Machine.
-
Exadata Cloud Service Capacity Planning Report: The capacity planning report for Oracle Exadata Cloud. See Exadata Cloud Service Capacity Planning Report in Oracle Enterprise Manager Cloud Control for Oracle Exadata Cloud.
Note that the report for Oracle Exadata Cloud has a subset of applicable sections of the Capacity Planning Details report used for Oracle Exadata Database Machine, specifically: Configuration, Global Summary, Storage Capacity Planning Details, CPU and Memory Capacity Planning Details, and IO Capacity Planning Details.
-
Exadata vCPU Consumption Report: Total daily vCPU consumption and daily vCPU consumption by compute node and virtual host for Exadata.
-
-
Click the link on the report to view it in BI Publisher application. In the resulting report page, you can optionally obtain the report in PDF, HTML, RTF, Excel or PowerPoint formats.
Exadata Capacity Planning Details
Capacity Planning Details report enables you to analyze and visualize the utilization and health of Exadata resources like storage, CPU, memory, IO and network. It also helps to plan for upcoming resource requirements.
Some of the benefits of monitoring your resources:
- Optimum Resource Usage: Helps you to fine tune the size and number of resources to ensure that you are getting optimum output
- Cost Efficiency: You pay for the exact amount of resources that you will use
- Predictive Capacity Planning: Based on the past performance of your configuration, you can plan your resources for future requirements
- Improved IT Management: Helps you to keep a close watch on the performance and health parameters of your resources
Exadata Machine Configuration
This section reports the name of the Exadata Database Machine for which the capacity planning report is generated. It also lists the various hosts and their corresponding host types associated with the configuration. The host type can be Database Node or Storage Cell.
Global Summary
This section summarizes the key metrics of your configuration for the time ranges like Last 24 hours, Last 7 Days, Last 31 Days, and Last 365 Days. The same key metrics are analyzed in greater details in the following sections of the report.
The metrics for Last 24 Hours time range are calculated based on the metric collection frequency.
The metrics for the Last 7 Days time range are calculated based on the hourly aggregated data.
The metrics for the Last 31 Days and Last 365 Days time ranges are calculated based on the daily aggregated data.
This is an example global summary of an Exadata Database Machine:

Storage Capacity Planning Details
As an administrator, you can use the Storage Capacity Planning Details section to diagnose and resolve issues in your storage systems, thus resulting in better performance of not only the storage systems but also the applications relying on them. This section displays the current and historical storage space usage information for all the disk groups.
The current space usage is reported based on the data that was last collected. The following parameters are tabulated for each disk group:
- Redundancy
- Used (%)
- Total Size (GB) - Raw
- Free Space (GB) - Raw
- Used Space (GB) - Raw
- Total Size (GB) - Usable
- Free Space (GB) - Usable
- Used Space (GB) - Usable
The historical report is generated based on the data available for the selected time range. The following parameters are tracked and plotted in a line chart along the y-axis against time which is on x-axis:
- Historical Space Usage By Disk Group (GB) - Usable
- Historical Space Usage By Disk Group (%) - Usable
- Historical Total Space Usage (GB) - Raw
- Historical Total Space Usage (GB) - Usable
- Historical Space Usage by the Top 5 Serviced Databases - As seen daily
CPU and Memory Capacity Planning Details
Your CPU and Memory utilizations should not be at critical limits during normal load hours. You should determine CPU and Memory utilizations based on your application needs, including CPU and Memory cycles for peak usage. If your CPU and Memory utilizations are optimized at 100% during normal load hours, you have no capacity to handle a peak load. A mismatch between the capacity and the demands can result in unsatisfactory utilization of resources.
In the CPU and Memory Capacity Planning Details section, CPU Utilization and Memory Utilization parameters of each database node are measured and plotted in line charts for the time ranges Last 24 Hours, Last 7 Days, Last 31 Days, and Last 365 Days.
Following is an example of the CPU Utilization metric for the 24 hours time range:

Following is an example of the Memory Utilization metric for the 24 hours time range:

IO Capacity Planning Details
The IO Capacity Planning Details section displays the current and historical IO, throughput and disk utilization aggregated across all the storage servers for the selected Exadata Database Machine. It summarizes the amount of data being stored in the disks, the read/write throughput rate, and load handling in response to normal and peak demands. Use this section to optimize your disk resources and to plan for future demands.
The following parameters of Cell Disk and Flash are measured and plotted in line charts for the time ranges Last 24 Hours, Last 7 Days, Last 31 Days, and Last 365 Days:
- Average Cell Disk Utilization
- Aggregate Cell Disk Read and Write throughput
- Disk Read Throughput
- Disk Read Throughput
- Aggregate Cell Disk IOPS
- Read IOPS
- Write IOPS
- Total IOPS
- Average Cell Disk Load
- Average Cell Disk Response Time
- Average Flash Utilization
- Aggregate Flash Read and Write throughput
- Flash Read Throughput
- Flash Read Throughput
- Aggregate Flash IOPS
- Read IOPS
- Write IOPS
- Total IOPS
- Average Flash Load
- Average Flash Response Time
Following is an example of the average utilization of Flash over a 24-hour time range:

Following is an example of the various IO capacity metrics of a Cell Disk over a 24-hour time range:

Network Capacity Planning
The Network Capacity Planning section displays the Bonded (logical) interfaces and Slave (Physical) interfaces throughput. Network bonding corresponds to a single IP address and is the single logical bonded interface formed by aggregating multiple physical network interfaces. Use this section to determine the amount of network traffic handled at various loads.
The section displays the following Transmit and Receive throughputs in Gb/sec for bonded and slave interfaces measured and plotted in line charts for the time ranges Last 24 Hours, Last 7 Days, Last 31 Days, and Last 365 Days:
- Transmit - Bonded Interfaces
- Receive - Bonded Interfaces
- Transmit - Slave Interfaces
- Receive - Slave Interfaces
This section does not show the RDS protocol traffic metrics.
Exadata vCPU Consumption Report
Use the Exadata vCPU Consumption Report to track the vCPU usage of your virtualized Exadata Database Machine. Compare the vCPU consumption for different payloads and plan the vCPU allocations for future requirements.
The two parameters used in the report are Exadata target name and time period. The report is generated based on an Exadata target, and defined for the time ranges like 7 Days, 30 Days, 90 Days, 180 Days, and 1 Year, 2 years, 3 years, and 4 years. The default time range is 30 Days. If there is no data on a specific day, then the default value is 0.
Report Summary: The summary includes the selected Exadata target name, selected time period, current total vCPU consumption, and total number of physical CPUs enabled. The last two values add all the current values together from each virtual machine.
The following metrics are generated in the report for the specific Database Machine:
Total Daily vCPU Consumption
Total vCPU consumption is reported based on the time period that you select. For example, if you select 30 days, the data for 30 days including the current date is reported. The details like Exadata target, compute nodes, and hosts are obtained from the Exadata target name and target association relationship. The CPU count is obtained from the historical host configuration metrics. Within a day, only the high value of the number of vCPUs is used for the daily CPU count. On the whole, the CPU count is aggregated by the virtual host for each day. The chart that displays the total vCPU consumption for the time period of 90 days is shown below:
Following is the total vCPU consumption table for a time period of 7 days:

Daily vCPU Consumption by Compute Node and Virtual Host
This table is similar to the table for total vCPU consumption, but without the aggregation of the count. The section presents the data grouped by compute nodes and host.
Following is the daily vCPU consumption of the listed compute nodes and their hosts:

Oracle Exadata Database Machine Dashboard Creation
You can create a Database Machine dashboard to monitor the performance and usage metrics of the Database Machine system, its sub-components, as well as all the database system components residing on the Database Machine.
How to Make the Report "Public"
The generated report is accessible only by the Enterprise Manager user who creates it. To make the report public:
- Select the dashboard report from the list of Information Publisher reports shown after following the steps mentioned above.
- Click Edit.
- Select the Run report using target privileges of the report owner option under Privileges section in General tab.
- Click the Access tab.
- Select the Allow viewing without logging in to Enterprise Manager option.
- Click OK.
