3.2.3.5 Operating System Issues
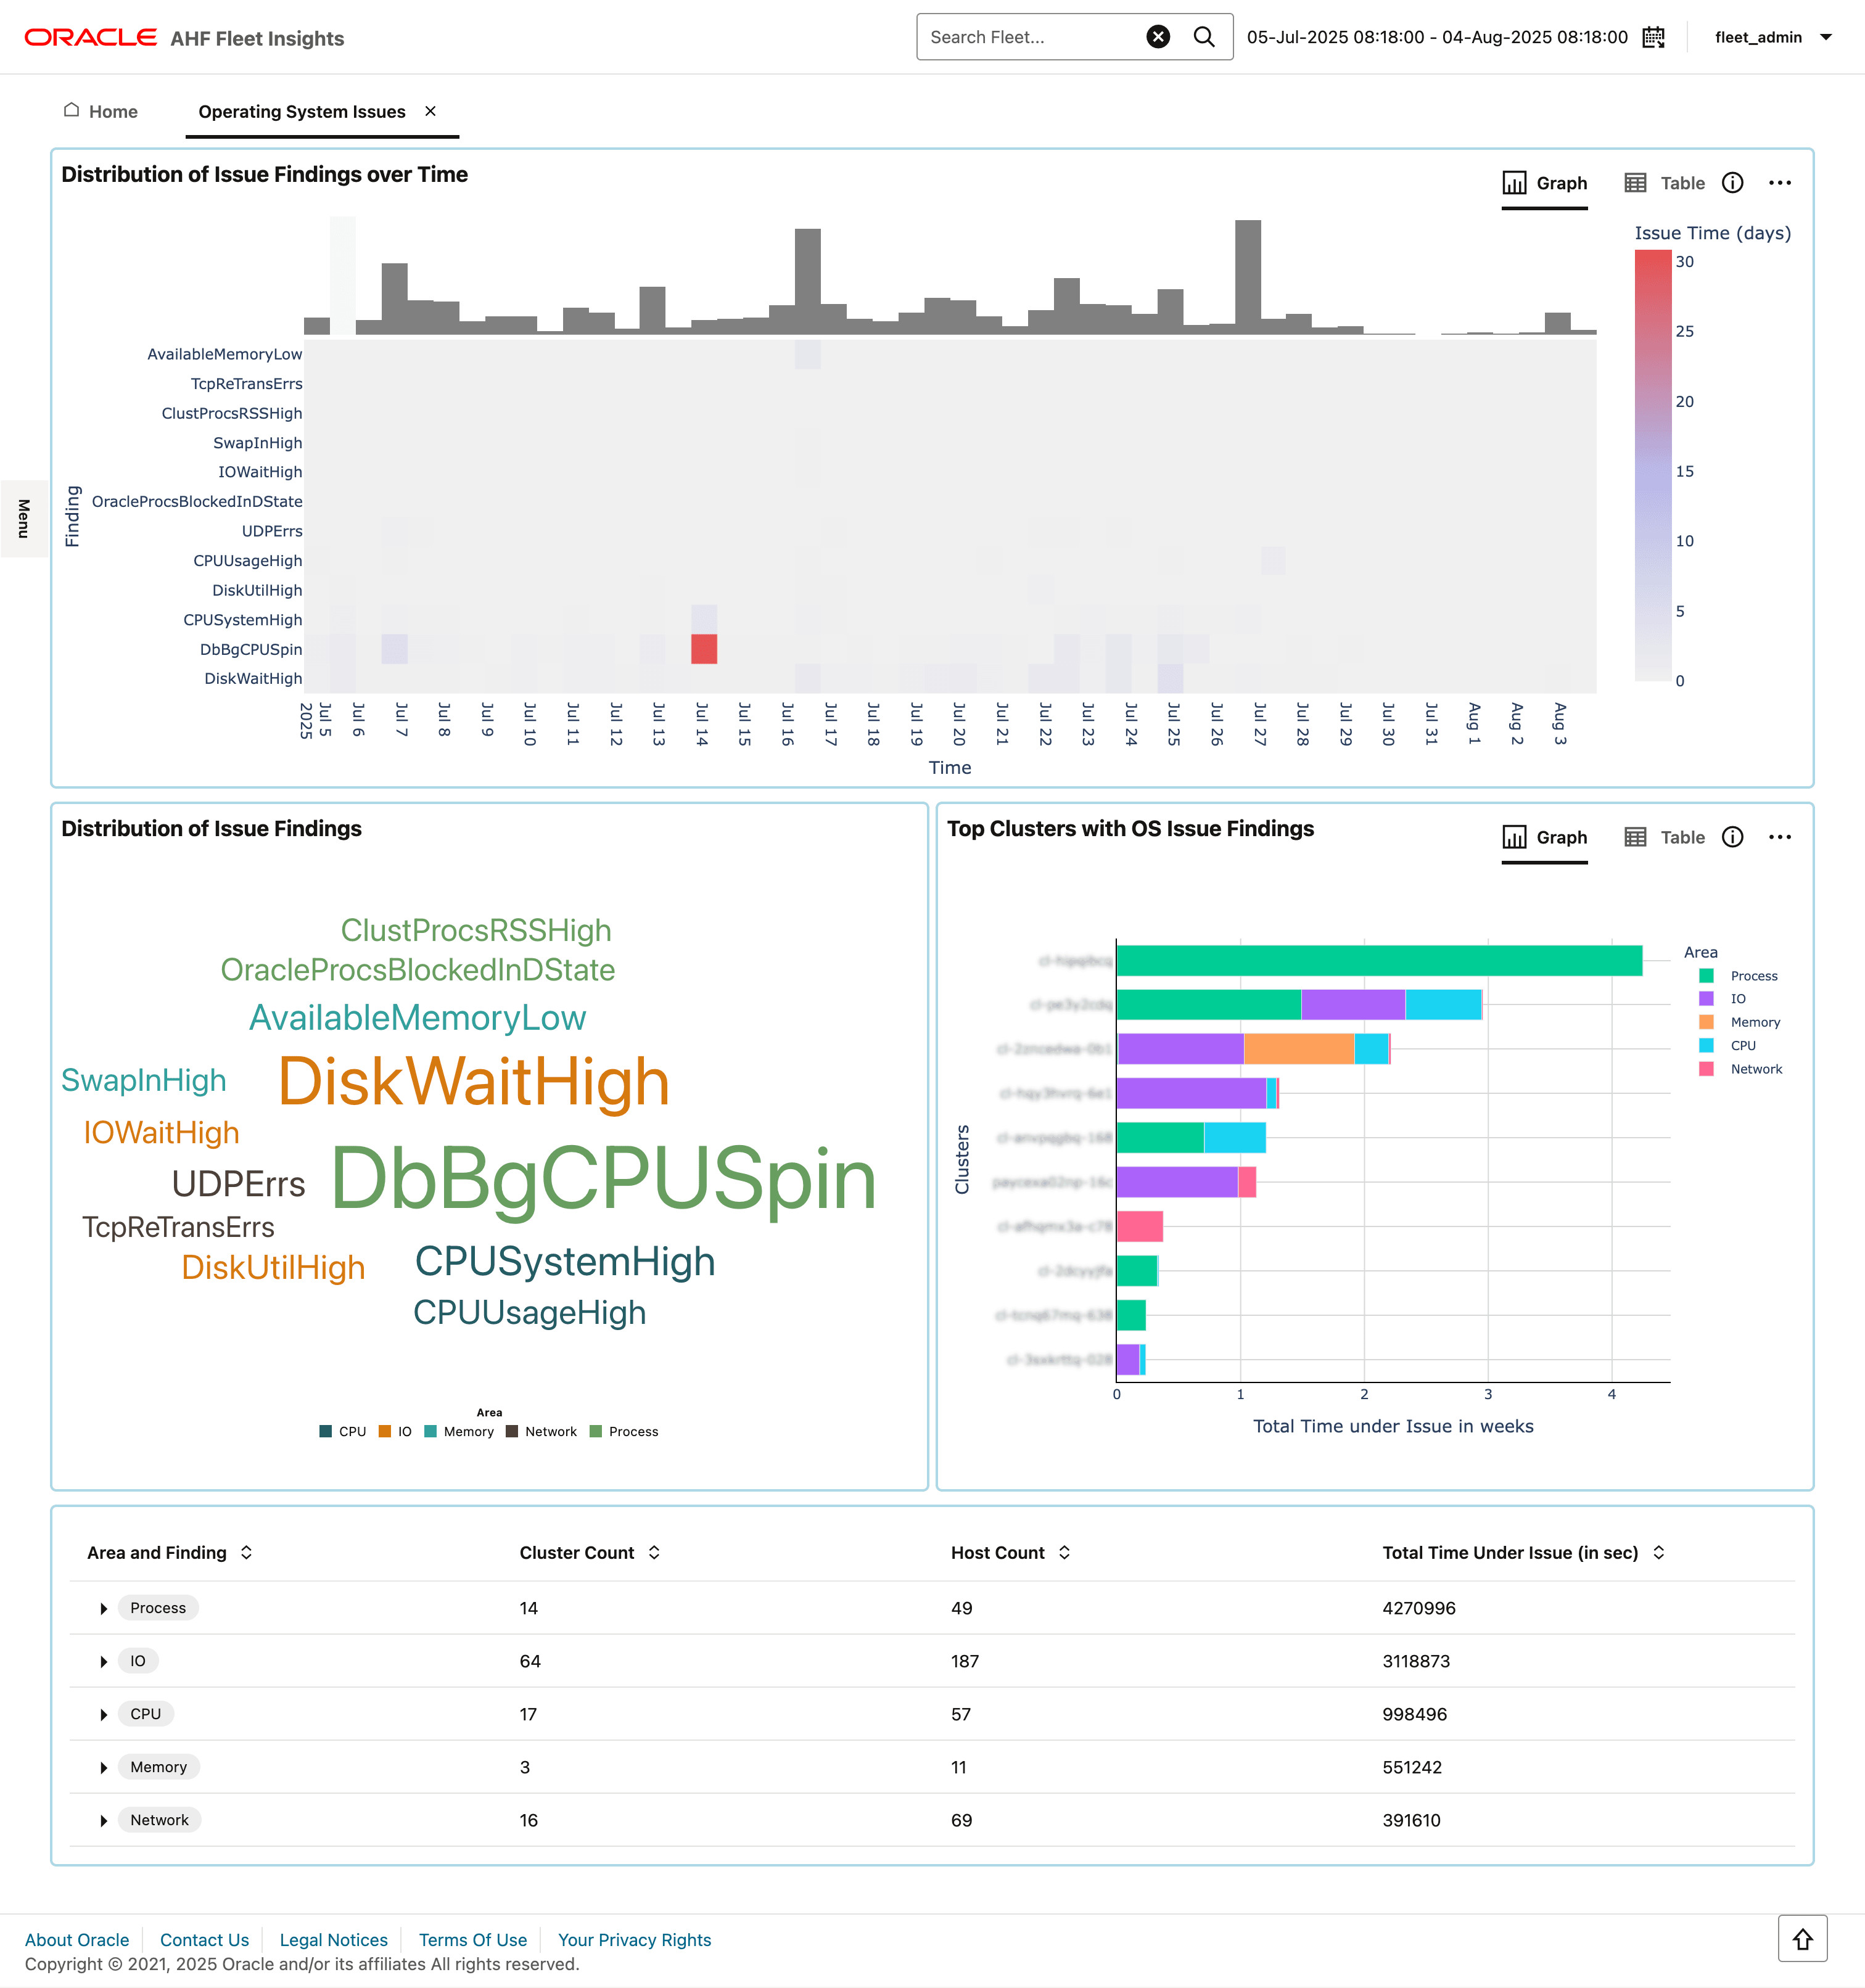
The Operating System Issues dashboard provides an overview of operating system–related problems detected within your environment. You can review trends to see which issues have increased over a specific period, identify the cluster most impacted, and check for spikes in reported incidents. From there, you can drill down to see the most affected host and access the OS Issues section in the Insights report for detailed analysis and troubleshooting steps.
Figure 3-19 Operating system issues

- Identify prominent operating system issues in a given period
- Identify which cluster has been most impacted by operating system issues
- Identify if there was a spike in operating system issues reported during a specific timeframe
Parent topic: Insights
3.2.3.5.1 Identify prominent operating system issues in a given period
Purpose: Determine which operating system issues have experienced a significant increase in reports and identify the specific time period during which these spikes occurred.
Parent topic: Operating System Issues
3.2.3.5.2 Identify which cluster has been most impacted by operating system issues
Purpose: Select the most impacted cluster as a Fleet manager and then drill-down for further analysis. And, as a DBA, you can investigate a particular cluster.
Parent topic: Operating System Issues
3.2.3.5.3 Identify if there was a spike in operating system issues reported during a specific timeframe
- Within the drill-down page, check the timeline to see if there were any spikes for operating system issues in that particular cluster.
- Identify the host that is most impacted by the operating system issues.
- Finally, go to an Insights report, which would take you to the OS Issues section of the Insights report to facilitate more granular analysis.
Parent topic: Operating System Issues