3.2.3.2 Events
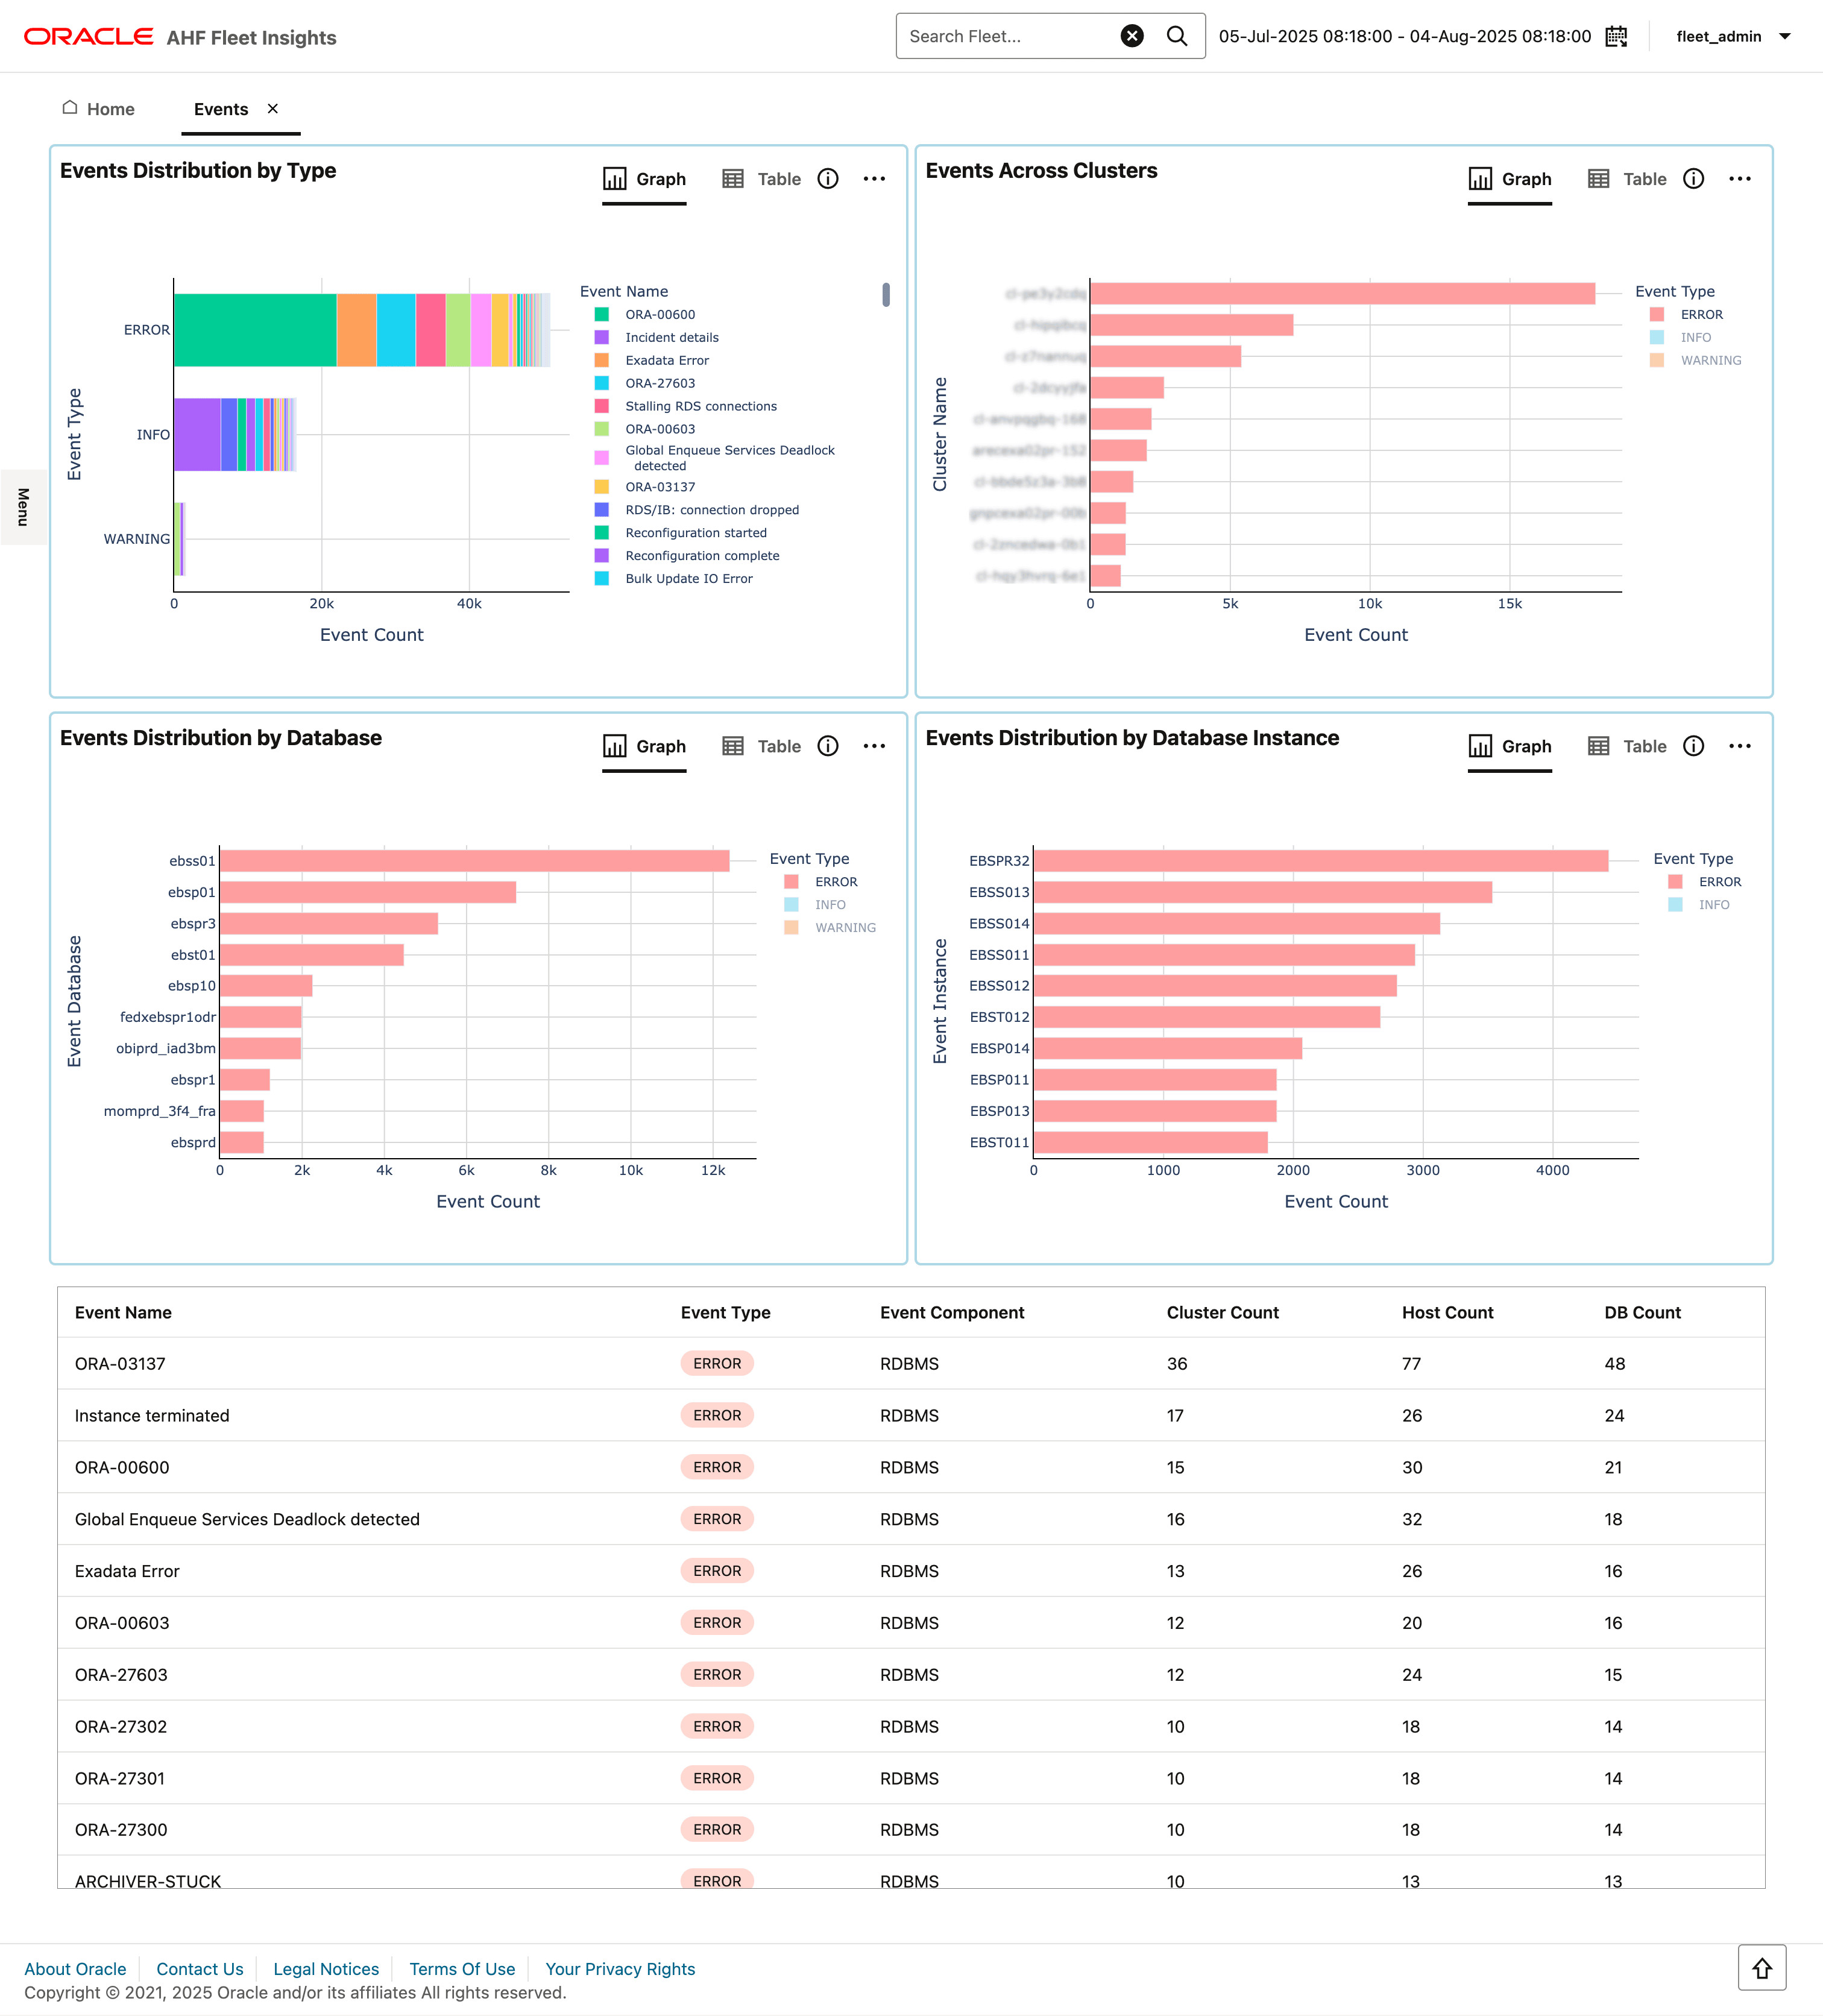
The Events dashboard enables you to monitor, investigate, and analyze error occurrences across databases, clusters, and hosts. It helps identify systems with the highest error counts, detect anomalies, investigate recurring or recent issues, and correlate event spikes with system updates. Through filtering and drill-down views, it pinpoints affected resources and links to relevant insight reports for deeper troubleshooting.
Figure 3-13 Events

- Identify databases with the highest number of error events
- Identify clusters with the highest number of error events
- Drill-down flow
Parent topic: Insights
3.2.3.2.1 Identify databases with the highest number of error events
Purpose: Identify the databases having the maximum number of error events.
Parent topic: Events
3.2.3.2.2 Identify clusters with the highest number of error events
Purpose: Identify the clusters having the maximum number of error events.
Parent topic: Events
3.2.3.2.3 Drill-down flow
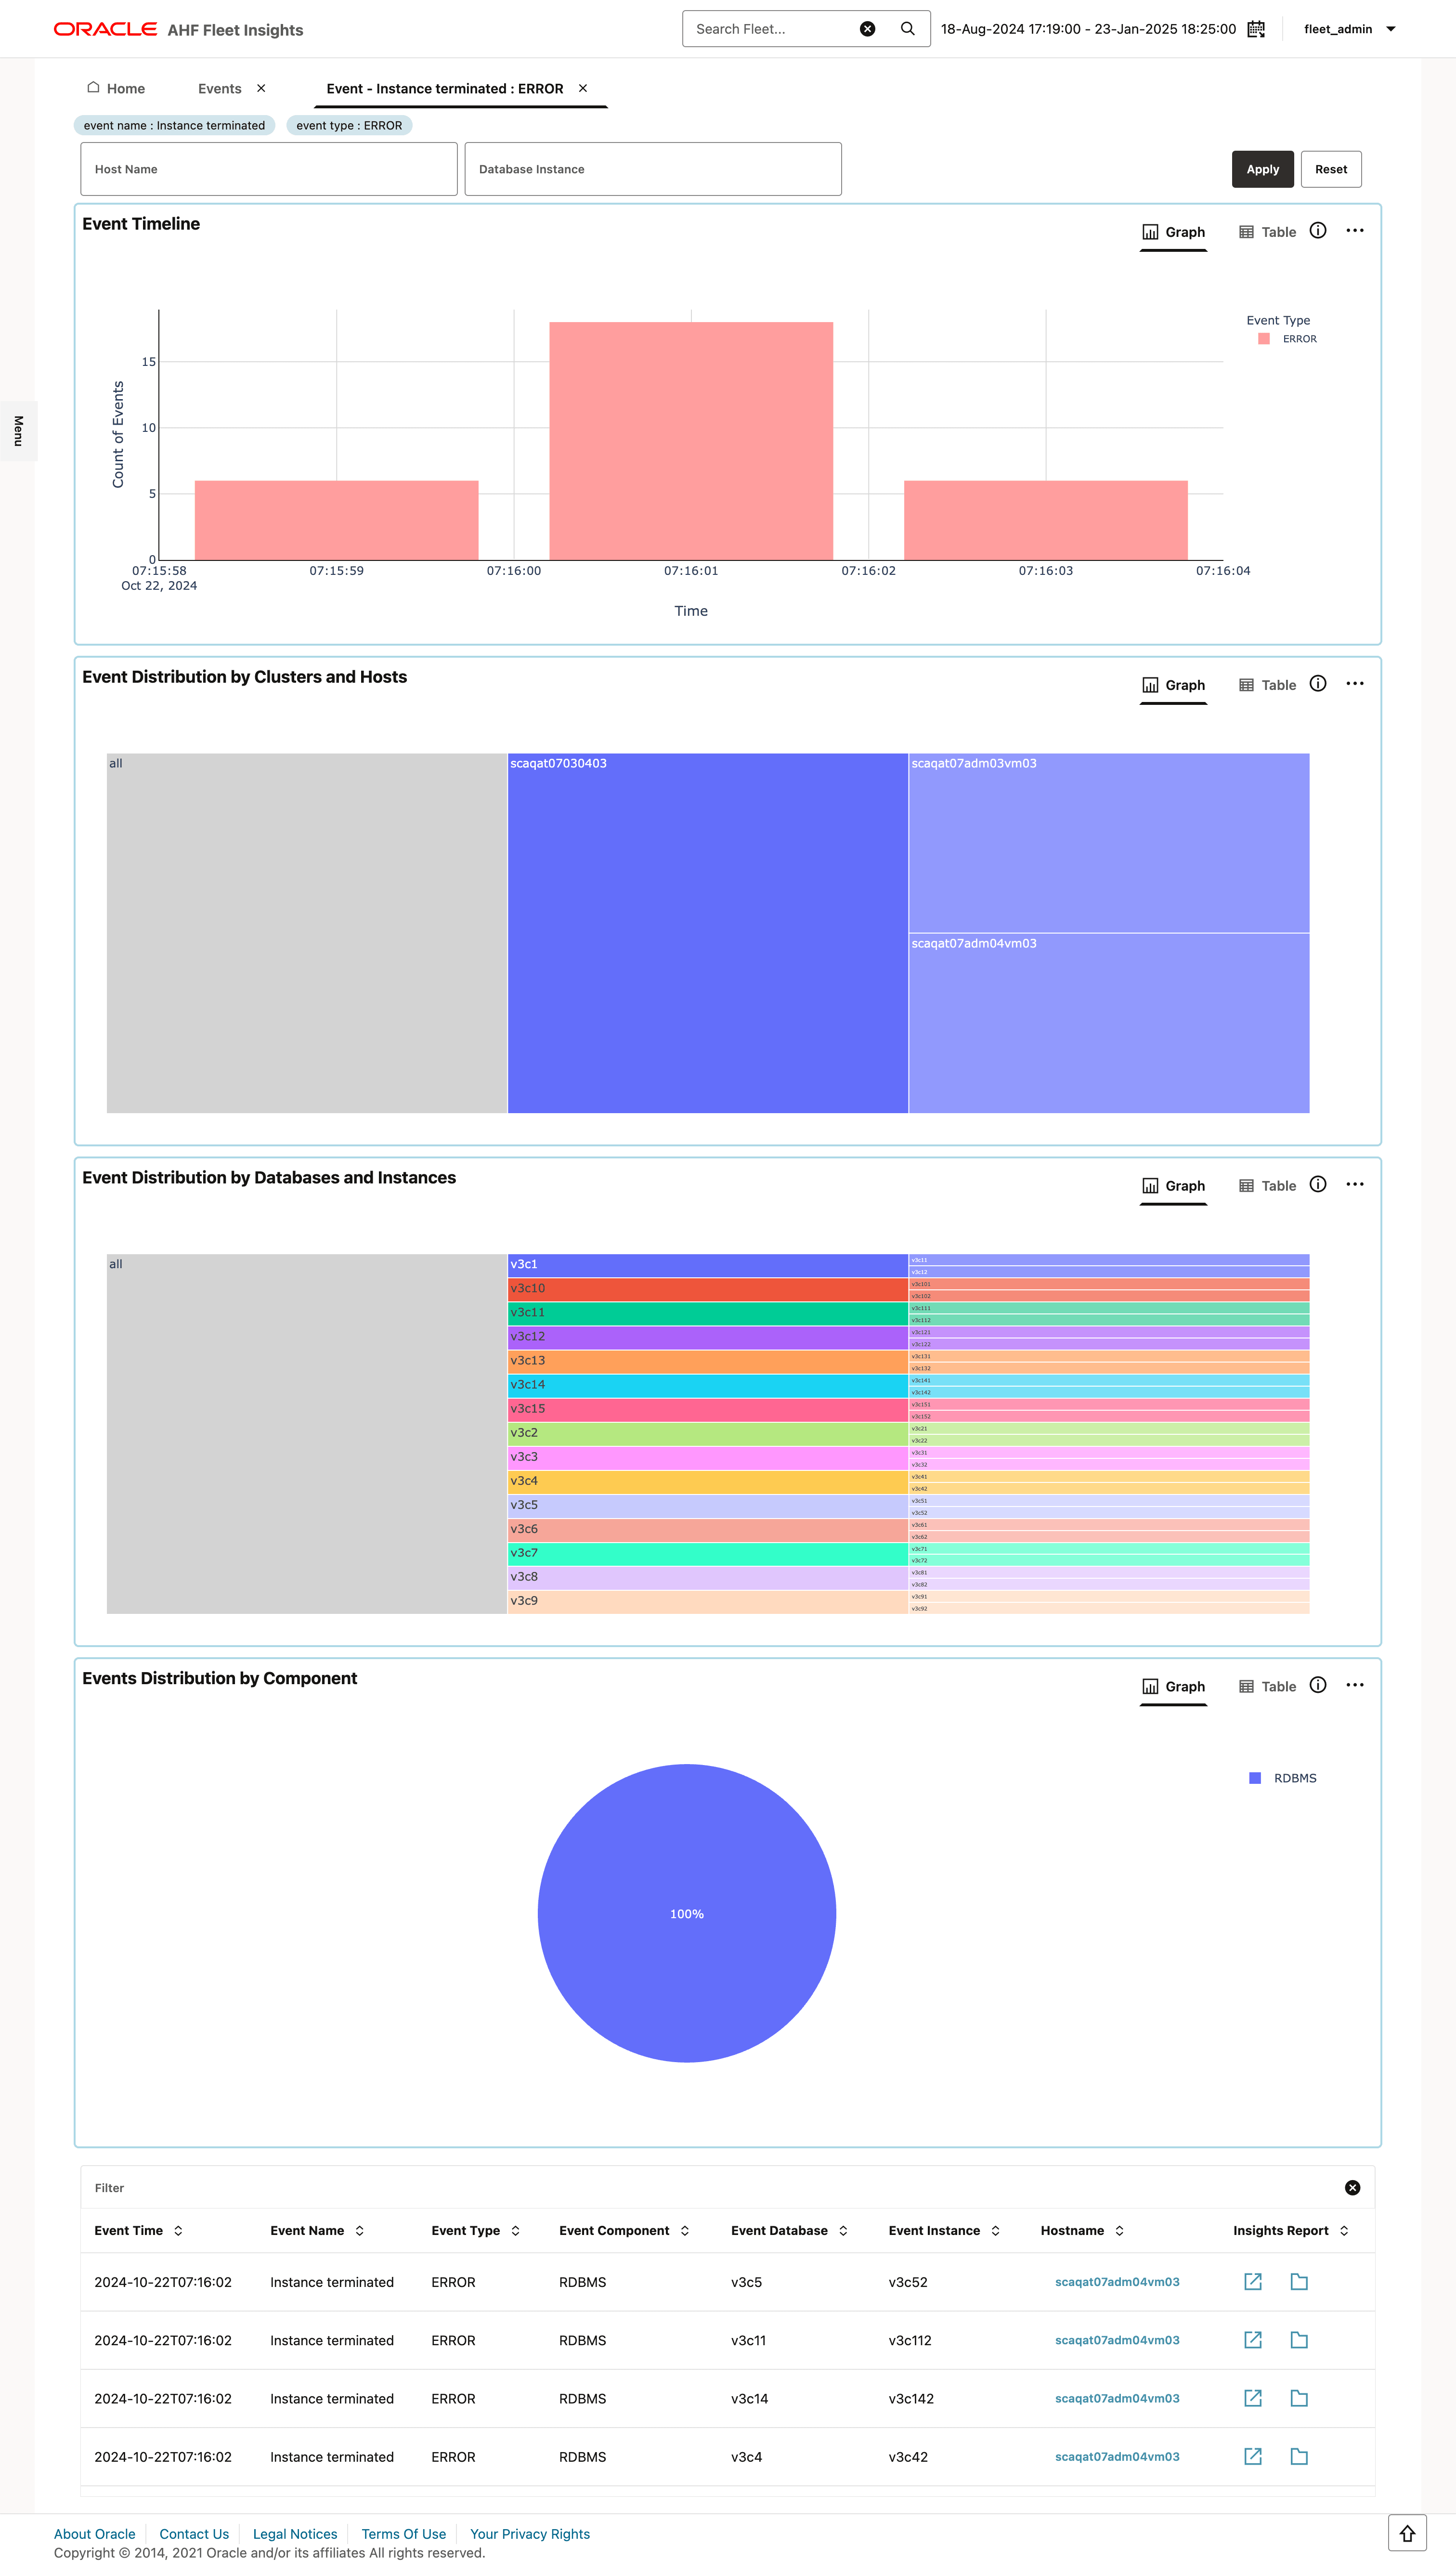
Figure 3-14 Events drill-down flow

- Investigate a specific error event
- Find the most recent events across the fleet
- Identify anomalies among certain clusters/hosts
Parent topic: Events
3.2.3.2.3.1 Investigate a specific error event
- Find the error that occurred the most and apply it as a filter.
- In the drill-down page, check if there is a spike of occurrence of this event on the timeline chart.
- Filter the hosts on which this event occurred the most.
- Filter the databases on which this event occurred the most.
- Once the filters are applied, pinpoint the insight reports which can be used to further investigate the event.
Parent topic: Drill-down flow
3.2.3.2.3.2 Find the most recent events across the fleet
- Observe if the new issues occur after a system update.
- Filter by time.
- Monitor events between the last system update and now.
Parent topic: Drill-down flow
3.2.3.2.3.3 Identify anomalies among certain clusters/hosts
- Analyze if it is more prevalent on certain clusters/hosts.
- Analyze if it is more prevalent on certain databases.
- Filter and go to the corresponding insight report for more granular analysis.
Parent topic: Drill-down flow