Work with Scenarios
After you enable scenario modeling for an Essbase cube, you can work with scenario data. You can view base member data, compare scenario values to base values, set scenario cells to #Missing, revert scenario values back to base values, and aggregate scenario data.
View Base Member Data
From the Essbase web interface, you can launch an Excel sheet showing base data for a scenario.
- In the Essbase web interface, on the
Home page, click
Scenarios.

- Click the Actions menu for the scenario you want to view, and click Show Base Data.
- Click the downloaded link to launch Smart View.
Compare Scenario Values to Base Values
If you are the owner, approver or participant for a given scenario, you can view scenario and base values in a spreadsheet or in the Essbase web interface to compare models.
Compare Values in Excel
-
In the Essbase web interface, on the Home page, click Scenarios.

-
From the Actions menu, select Show Changes in Excel.
-
Click on the downloaded link to open the Smart View link.
-
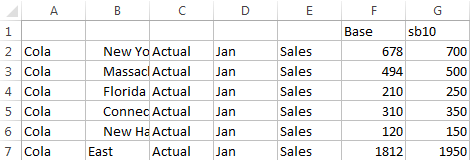
You can view values for both the scenario and base members in the spreadsheet.
-
In column G, sb10 is the scenario (or sandbox) member.
-
In column F, Base shows the base values.
-
In the scenario, values for sb10 on rows 2 through 6 have been changed, and you can see the aggregated result in row 7.
-
Compare Values in the Web User Interface
-
In the Essbase web interface, on the Home page, click Scenarios.

-
From the Actions menu, select Show Changes.
The Data Changes dialog box is empty if no data changes have been made.
Set Scenario Cells to #Missing
You can set scenario cells to #Missing even if the corresponding base cells have values.
- Type #Missing in the cell or delete the cell contents.
- Select Submit Data on the Smart View ribbon.
-
Initially, the value in sb1 is an exact mirror of the value in the base.

-
Enter #Missing in sb1 (or delete the cell contents) and submit data.

-
Refresh the sheet. See that sb1 is #Missing.

Revert Scenario Values Back to Base Values
In a worksheet connected to a scenario-enabled Essbase cube, you can revert the scenario values back to the base by typing #Revert in the changed cells and clicking Submit Data on the Smart View ribbon.
- In Excel, type #Revert in the scenario cells you want to revert to the base.
- Click Submit Data on the Smart View ribbon.
Example
-
Initially, the value in sb1 is an exact mirror of the value in base.

-
Submit a new value, 100, to sb1.

-
Submit #Revert to sb1.

-
Refresh the sheet. See that sb1 again reflects the base value of 678.

Understand When to Aggregate Sandbox Dimensions
As you model in scenarios, you will need to determine whether or not to calculate within each sandbox.
Submit data changes to the sandbox and calculate as little other data as possible, just enough data to allow users to validate their work. This preserves the storage efficiency of the sandbox design.
For example, when all upper level members in a cube are dynamic calc, aggregations in the form of calculation script are not needed.
If you have stored upper level members, limit the scope of any sandbox calculation to the minimum needed for users to do their work.
Example: Calculate Scenarios with Dynamic Upper Level Members
Dynamic hierarchies (both dense and sparse) aggregate automatically, and users making changes in sandboxes see their changes immediately.
Let’s look at an example from the Sample_Scenario.Basic block storage demo application.
Assume that Product and Market are dynamic hierarchies with data stored only at level zero, and that a scenario is created using sandbox dimension member sb0.
When the sandbox is newly created, values for sb0 are the same as the values for Base. This is because sandbox members are virtual, reflecting base values until users submit changes to them.
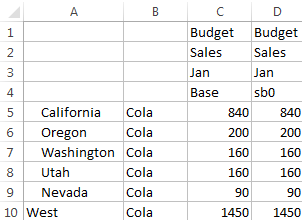
After modifying Sales->Budget->Jan->Cola data in member sb0, we immediately see that the dynamic sandbox member, West (in D10) aggregates to the correct total by using a combination of stored members from Base and sb0.
Values for Oregon, Utah and Nevada are stored in the Base sandbox member. Values for California and Washington have been submitted by scenario participants and are stored in the sb0 sandbox member. The total for West->Cola->sb0 aggregates dynamically using these stored values.
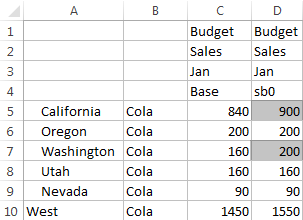
You can also use calculation scripts in sandboxes. Assume that Oregon is meant to be budgeted as 80% of California. The following calculation script can do this:
FIX("Jan", "Budget", "Cola", "Sales")
"Oregon"="California"*.8;
ENDFIX
When a scenario participant launches an Excel worksheet from the web interface and runs this calculation, sb0 is the default sandbox member calculated and the value for member Oregon is updated:
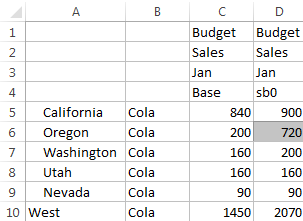
This view is not from a scenario-launched sheet, but rather from a Smart View private view, where Base and sb0 can both be represented on the sheet.
Example: Calculate Scenarios with Stored Upper Level Members
In some cases, a sparse or dense hierarchy may have stored upper level members, and aggregations on level- or generation-based calculations could be required.
Continuing from the last grid of the previous example, assume now that upper level members in the Market dimension are stored, rather than dynamic.
If we change the value for Oregon to 250, the West member will need to be re-calculated before we can see correct results:
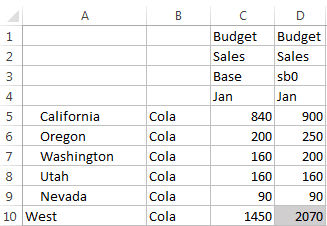
The following calc script can be used to aggregate the Market dimension in the sandbox, when executed from a scenario-launched excel sheet:
AGG("Market");