Analyze and Plan the Essbase Application
To ensure that your Essbase application analyzes your business information efficiently, formulate a detailed plan that outlines data sources, user needs, and prospective database elements. Attention to this design phase can save you development and implementation time.
The planning and analysis phase involves these tasks:
When designing a multidimensional application, consider these factors:
-
How information flows within the company—who uses which data for what purposes
-
The types of reporting the company does—what types of data must be included in the outline to serve user reporting needs
Note:
Defining only one database per application enhances memory usage and ease of database administration.
Analyze Source Data
Evaluate the data to be included in the Essbase database. Consider where it comes from, and the required frequency and size of updates. You should load into Essbase only what's needed for pivot reporting and drill-through. The rest can stay in a relational source, accessible by partition or drill through.
Determine the scope of the database. If an organization has numerous product families containing a vast number of products, you may want to store data values only for product families. Interview members from each user department to find out what data they process, how they calculate and report data today, and how they want to do it in the future.
Carefully define reporting and analysis needs.
-
How do users want to view and analyze data?
-
How much detail should the database contain?
-
Does the data support the desired analysis and reporting goals?
-
If not, what additional data do you need, and where can you find it?
Determine the location of the current data.
-
Where does each department currently store data?
-
Is data in a form that Essbase can use?
-
Do departments store data in relational databases on Windows or UNIX servers, or in Excel spreadsheets?
-
Who updates the database and how frequently?
-
Do those who need to update data have access to it?
Ensure that the data is ready to load into Essbase.
-
Does data come from a single source or multiple sources?
-
Is data in a format that Essbase can use? For a list of valid data sources that you can load into Essbase, see Sources of Data.
-
Is all data that you want to use readily available?
Identify User Requirements
As you plan the Essbase database, discuss information needs with current users of the data, and request sample reports from them. Review the information they use and the reports they must generate for review by others.
Determine the following requirements:
-
What types of analysis do users require?
-
Do users require ad-hoc (pivot style) reporting and structured reports?
-
What summary and detail levels of information do users need?
-
Do some users require access to information that other users should not see?
Plan for Security in a Multiple User Environment
Identify different levels of user information needs as part of planning how to set up Essbase security permissions. By the end of your analysis, you should have a list of users and their required permissions.
Use this checklist to plan for security:
-
Who are the users and what permissions should they have for reading or writing data in the database?
-
Who should have load data permissions?
-
Who should have permission to execute calculations?
-
Which users can be grouped and assigned similar permissions?
Refer also to Manage Users and Roles.
Create Database Models
Create a model of the Essbase database. To build the model, you'll need to identify the perspectives and views that are important to your business. These views translate into the dimensions of the database model.
Many businesses analyze the following views:
-
Time periods
-
Measures
-
Scenarios
-
Products
-
Customers
-
Geographical regions
-
Business units
Next, to help you gather information and make decisions, you will need to identify data analysis objectives, determine the database dimensions and members, and analyze the database design.
Identify Analysis Objectives
After you identify the major views of information in a business, the next step in designing an Essbase database is deciding how the database enables data analysis. For example, you may need to view data by time period, by geography, or by product type.
-
If analyzing by time, which time periods are needed? Should the analysis include only the current year or multiple years? Should the analysis include quarterly and monthly data? Should it include data by season?
-
If analyzing by geographical region, how do you define the regions? Do you define regions by sales territories? Do you define regions by geographical boundaries, such as states and cities?
-
If analyzing by product line, should you review data for each product? Can you summarize data into product classes?
Regardless of the business views, you must determine the perspective and detail needed in the analysis. Each business area that you analyze provides a different view of the data.
Determine Dimensions and Members
The Essbase dimensions you choose determine what types of analysis you can perform. Within each dimension, hierarchies of members represent aspects of the business. For example, a time hierarchy may include quarters and months. A product hierarchy classifies products. A regional hierarchy is based on geographical markets.
You can represent each business view as a separate standard dimension in the database. You may hear business analysts refer to the "bys" of their business, such as by product, by geography, and by time period. If you need to analyze a business view by classification or attribute, such as by the size or color of products, you can use attribute dimensions or properties to represent the classification views.
You can use as many dimensions as you need for analysis. When you know approximately what dimensions and members you need, develop a tentative database design.
After you determine the dimensions of the database model, choose the elements or items within each dimension. These elements become the hierarchies and members of their respective dimensions. For example, a time hierarchy may include the time periods that you want to analyze, such as quarters, and within quarters, months. Each quarter and month becomes a member of the dimension that you create for time. Quarters and months represent a two-level hierarchy of members and their children. Months within a quarter can consolidate to a total for each quarter.
Relationships Among Dimensions
Consider the relationships among the dimensions. The structure of an Essbase database makes it easy for users to analyze information from many perspectives. A financial analyst, for example, may ask the following questions:
-
What are sales for a particular month? How does this figure compare to sales in the same month over the last five years?
-
By what percentage is profit margin increasing?
-
How close are actual values to budgeted values?
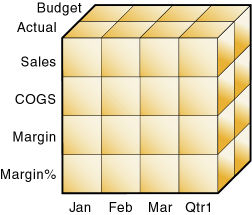
In other words, the analyst may want to examine information from three dimensions—time, account, and scenario. The sample database illustrated below represents these three dimensions, with one dimension represented along each of the three axes:
-
A time dimension, which comprises Jan, Feb, Mar, and the total for Qtr1, is displayed along the X-axis.
-
An accounts dimension, which consists of accounting figures such as Sales, COGS, Margin, and Margin%, is displayed along the Y-axis.
-
Another dimension, which provides a different point of view, such as Budget for budget values and Actual for actual values, is displayed along the Z-axis.
Figure 1-1 Cube Representing Three Database Dimensions

The cells within the cube, where the members intersect, contain the data relevant to all three intersecting members; for example, the actual sales in January.
Example Dimension-Member Structure
The table below shows a summary of the TBC dimensions. The application designer created three columns, with the dimensions in the left column and members in the two right columns. The members in column 3 are subcategories of the members in column 2. In some cases, members in column 3 are divided into another level of subcategories; for example, the Margin of the Measures dimension is divided into Sales and COGS.
Table 1-1 TBC Sample Dimensions
| Dimensions | Members | Child Members |
|---|---|---|
|
Year |
Qtr1 |
Jan, Feb, Mar |
|
Year |
Qtr2 |
Apr, May, Jun |
|
Year |
Qtr3 |
Jul, Aug, Sep |
|
Year |
Qtr4 |
Oct, Nov, Dec |
|
Measures |
Profit |
Margin: Sales, COGS Total Expenses: Marketing, Payroll, Miscellaneous |
|
Measures |
Inventory |
Opening Inventory, Additions, Ending Inventory |
|
Measures |
Ratios |
Margin %, Profit %, Profit per Ounce |
|
Product |
Colas (100) |
Cola (100‑10), Diet Cola (100‑20), Caffeine Free Cola (100‑30) |
|
Product |
Root Beer (200) |
Old Fashioned (200‑10), Diet Root Beer (200‑20), Sarsaparilla (200‑30), Birch Beer (200‑40) |
|
Product |
Cream Soda (300) |
Dark Cream (300‑10), Vanilla Cream (300‑20), Diet Cream Soda (300‑30) |
|
Product |
Fruit Soda (400) |
Grape (400‑10), Orange (400‑20), Strawberry (400‑30) |
|
Market |
East |
Connecticut, Florida, Massachusetts, New Hampshire, New York |
|
Market |
West |
California, Nevada, Oregon, Utah, Washington |
|
Market |
South |
Louisiana, New Mexico, Oklahoma, Texas |
|
Market |
Central |
Colorado, Illinois, Iowa, Missouri, Ohio, Wisconsin |
|
Scenario |
Actual |
N/A |
|
Scenario |
Budget |
N/A |
|
Scenario |
Variance |
N/A |
|
Scenario |
Variance % |
N/A |
In addition, the application designer added the following attribute dimensions to enable product analysis based on size and packaging:
Table 1-2 TBC Sample Attribute Dimensions
| Dimensions | Members | Child Members |
|---|---|---|
|
Ounces |
Large Small |
64, 32, 20 16, 12 |
|
Pkg Type |
Bottle Can |
N/A |
Checklist for Determining Dimensions and Members
Use the following checklist when determining the dimensions and members of your model database:
-
What are the candidates for dimensions?
-
Do any of the dimensions classify or describe other dimensions? These dimensions are candidates for attribute dimensions.
-
Do users want to qualify their view of a dimension? The categories by which they qualify a dimension are candidates for attribute dimensions.
-
What are the candidates for members?
-
How many levels does the data require?
-
How does the data consolidate?
Analyze Database Design
Review the initial Essbase dimensional design according to these guidelines around the number of dimensions, their combined analytical value, and avoidance of repetition. Performing this up-front analysis will help you achieve an efficient database design that meets your data consolidation and calculation goals.
The number of members needed to describe a potential data point should determine the number of dimensions. If you are not sure whether you should delete a dimension, keep it and apply more analysis rules until you feel confident about deleting or keeping it.
Dense and Sparse Dimensions
Which dimensions are sparse, and which are dense, affects performance. See:
Standard and Attribute Dimensions
For simplicity, the examples in this topic show alternative arrangements for what was initially designed as two dimensions. You can apply the same logic to all combinations of dimensions.
Consider the design for a company that sells products to multiple customers over multiple markets; the markets are unique to each customer:
             Cust A  Cust B  Cust C
New York     100     N/A     N/A
Illinois     N/A     150     N/A
California   N/A     N/A     30
Cust A is only in New York, Cust B is only in Illinois, and Cust C is only in California. The company can define the data in one standard dimension:
Market
  New York
    Cust A
  Illinois
    Cust B
  California
    Cust C
However, if you look at a larger sampling of data, you may see that many customers can be in each market. Cust A and Cust E are in New York; Cust B, Cust M, and Cust P are in Illinois; Cust C and Cust F are in California. In this situation, the company typically defines the large dimension, Customer, as a standard dimension and the smaller dimension, Market, as an attribute dimension. The company associates the members of the Market dimension as attributes of the members of the Customer dimension. The members of the Market dimension describe locations of the customers — each customer has exactly one market.
Customer (Standard dimension)
  Cust A (Attribute:New York)
  Cust B (Attribute:Illinois)
  Cust C (Attribute:California)
  Cust E (Attribute:New York)
  Cust F (Attribute:California)
  Cust M (Attribute:Illinois)
  Cust P (Attribute:Illinois)
Market (Attribute dimension)
  New York
  Illinois
  California
Consider another situation. Again, the company sells products to multiple customers over multiple markets, but the company can sell to a customer that has locations in different markets:
             Cust A  Cust B  Cust C
New York     100      75     N/A
Illinois     N/A     150     N/A
California   150     N/A      30
Cust A is in New York and California. Cust B is in New York and Illinois. Cust C is only in California. Using an attribute dimension does not work in this situation; a customer member cannot have multiple attribute members. Therefore, the company designs the data in two standard dimensions:
Customer
  Cust A
  Cust B
  Cust C
Market
  New York
  Illinois
  California
Dimension Combinations
Break each combination of two dimensions into a two-dimensional matrix. For example, proposed dimensions at TBC include the following combinations:
-
Year across Measures
-
Year across Product
-
Year across Market
-
Year across Scenario
-
Measures across Product
-
Measures across Market
-
Measures across Scenario
-
Market across Product
-
Market across Scenario
-
Scenario across Product
-
Ounces across Pkg Type
Ounces and Pkg Type, as attribute dimensions associated with the Product dimension, can be considered with the Product dimension.
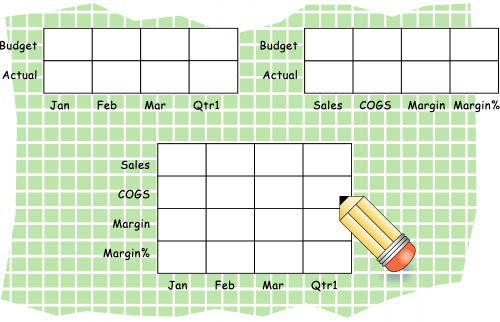
To help visualize each dimension, draw a matrix and include a few of the first-generation members. The following image shows a simplified set of matrices for three dimensions.
Figure 1-2 Analyzing Dimensional Relationships

For each combination of dimensions, ask three questions:
-
Does it add analytic value?
-
Does it add utility for reporting?
-
Does it avoid an excess of unused combinations?
For each combination, the answers to the questions help determine whether the combination is valid for the database. Ideally, the answer to each question is yes. If not, consider rearranging the data into more-meaningful dimensions. As you work through this process, discuss information needs with users.
Repetition in Outlines
The repetition of elements in an outline often indicates a need to split dimensions. The following examples show you how to avoid repetition.
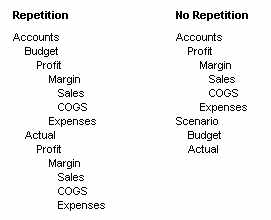
In this example, the left column, labeled "Repetition," shows Profit, Margin, Sales, COGS, and Expenses repeated under Budget and Actual in the Accounts dimension. The right column, labeled "No Repetition," separates Budget and Actual into another dimension (Scenario), leaving just one set of Profit, Margin, Sales, COGS, and Expenses members in the Accounts dimension. This approach simplifies the outline and provides a simpler view of the budget and actual figures of the other dimensions in the database.
Figure 1-3 Example of Eliminating Repetition By Creating a Scenario Dimension

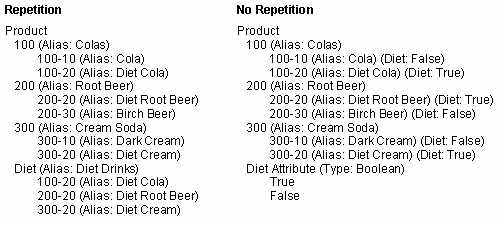
In this example, the left column, labeled “Repetition,” uses shared members in the Diet dimension to analyze diet beverages. Members 100–20, 200–20, and 300–20 are repeated: once under Diet, and once under their respective parents. The right column, labeled “No Repetition,” simplifies the outline by creating a Diet attribute dimension of type Boolean (True or False). All members are shown only once, under their respective parents, and are tagged with the appropriate attribute (“Diet: True” or “Diet: False”).
Figure 1-4 Example of Eliminating Repetition By Creating an Attribute Dimension

Attribute dimensions also provide additional analytic capabilities. See Benefits of Essbase Attributes.
Interdimensional Irrelevance
Interdimensional irrelevance occurs when many members of a dimension are irrelevant across other dimensions. Essbase defines irrelevant data as data that Essbase stores only at the summary (dimension) level. In such a situation, you may be able to remove a dimension from the database and add its members to another dimension or split the model into separate databases.
For example, TBC considered analyzing salaries as a member of the Measures dimension. But salary information often proves irrelevant in the context of a corporate database. Most salaries are confidential and apply to individuals. The individual and the salary typically represent one cell, with no reason to intersect with any other dimension.
TBC considered separating employees into a separate dimension. The following table shows an example of how TBC analyzed the proposed Employee dimension for interdimensional irrelevance. Members of the proposed Employee dimension (represented in the table header row) are compared with members of the Measures dimension (represented in the left-most column). The Measures dimension members (such as Revenue) apply to All Employees; only the Salary measure is relevant to individual employees.
Table 1-3 Example of Interdimensional Irrelevance
| Joe Smith | Mary Jones | Mike Garcia | All Employees | |
|---|---|---|---|---|
|
Revenue |
Irrelevance |
Irrelevance |
Irrelevance |
Relevance |
|
Variable Costs |
Irrelevance |
Irrelevance |
Irrelevance |
Relevance |
|
COGS |
Irrelevance |
Irrelevance |
Irrelevance |
Relevance |
|
Advertising |
Irrelevance |
Irrelevance |
Irrelevance |
Relevance |
|
Salaries |
Relevance |
Relevance |
Relevance |
Relevance |
|
Fixed Costs |
Irrelevance |
Irrelevance |
Irrelevance |
Relevance |
|
Expenses |
Irrelevance |
Irrelevance |
Irrelevance |
Relevance |
|
Profit |
Irrelevance |
Irrelevance |
Irrelevance |
Relevance |
Reasons to Split Databases
Because individual employee information is irrelevant to the other information in the database, and also because adding an Employee dimension would substantially increase database storage needs, TBC created a separate Human Resources (HR) database. The new HR database contains a group of related dimensions and includes salaries, benefits, insurance, and 401(k) plans.
There are many reasons for splitting a database; for example, suppose that a company maintains an organizational database that contains several international subsidiaries in several time zones. Each subsidiary relies on time-sensitive financial calculations. You can split the database for groups of subsidiaries in the same time zone to ensure that financial calculations are timely. You can also use a partitioned application to separate information by subsidiary.
Checklist to Analyze the Database Design
Use the following checklist to analyze the database design:
-
Have you minimized the number of dimensions?
-
For each dimensional combination, did you ask:
-
Does it add analytic value?
-
Does it add utility for reporting?
-
Does it avoid an excess of unused combinations?
-
-
Did you avoid repetition in the outline?
-
Did you avoid interdimensional irrelevance?
-
Did you split the databases as necessary?