21 Using the Graph Visualization Application
The Graph Visualization application is based on the graph visualization library. Using this interface, you can run PGQL queries on graphs in the graph server (PGX) and database.
The Graph Visualization application is made up of the following three tabs:
- Graph Server: To visualize graphs loaded into the graph server (PGX).
- Database (PGQL Property Graphs): To visualize PGQL property graphs in the database.
- Database (SQL Property Graphs): To visualize SQL property graphs. This tab option is supported only with Oracle Database 23ai.
Each tab comprises a query editor at the top and a graph visualization panel at the bottom of the interface.
All query level actions (such as running or canceling a query), viewing the list of graphs to which you have access in a specific tab, or configuring the settings for visualizing the output can be performed using the following toolbar:
Note that the action to Load graph into memory is supported only in the Graph Server tab.
You can choose to view the results of the graph visualization query in graph (default) or tabular format using the following toolbar which is displayed on the right of the graph visualization panel:
- Visualizing PGQL Queries on Graphs Loaded Into the Graph Server (PGX)
You can create or load a graph into the graph server (PGX), and then run PGQL graph queries in the Graph Server tab of the Graph Visualization application. - Visualizing PGQL Queries on PGQL Property Graphs
You can visualize PGQL queries on PGQL property graphs in the database in the Database (PGQL Property Graphs) tab of the Graph Visualization application. - Visualizing Graph Queries on SQL Property Graphs
You can query and visualize a SQL property graph in the database in the Database (SQL Property Graphs) tab of the Graph Visualization application. - Graph Visualization Modes and Graph Legends
Learn about the graph visualization toolbar, supported graph visualization modes and graph legend if you are viewing the results of the query in graph format. - Graph Visualization Settings
You can click the Settings gear icon to open the Graph Visualization settings window. - Enabling Cluster Option in Graph Visualization
You can enable the cluster option with Force layout to group vertices by labels or by any specific vertex property in your graph visualization. - Importing and Exporting Graph Visualization Settings
You can import and export the graph visualization settings as a JSON file. - Using Network Evolution in Graph Visualization
You can visualize the evolution of a graph over time using the Network Evolution feature in the Graph Visualization application.
Parent topic: Graph Visualization Application
21.1 Visualizing PGQL Queries on Graphs Loaded Into the Graph Server (PGX)
You can create or load a graph into the graph server (PGX), and then run PGQL graph queries in the Graph Server tab of the Graph Visualization application.
The following sections describe in detail the various actions that you can perform in the Graph Server tab.
Creating a Property Graph in the Graph Server (PGX)
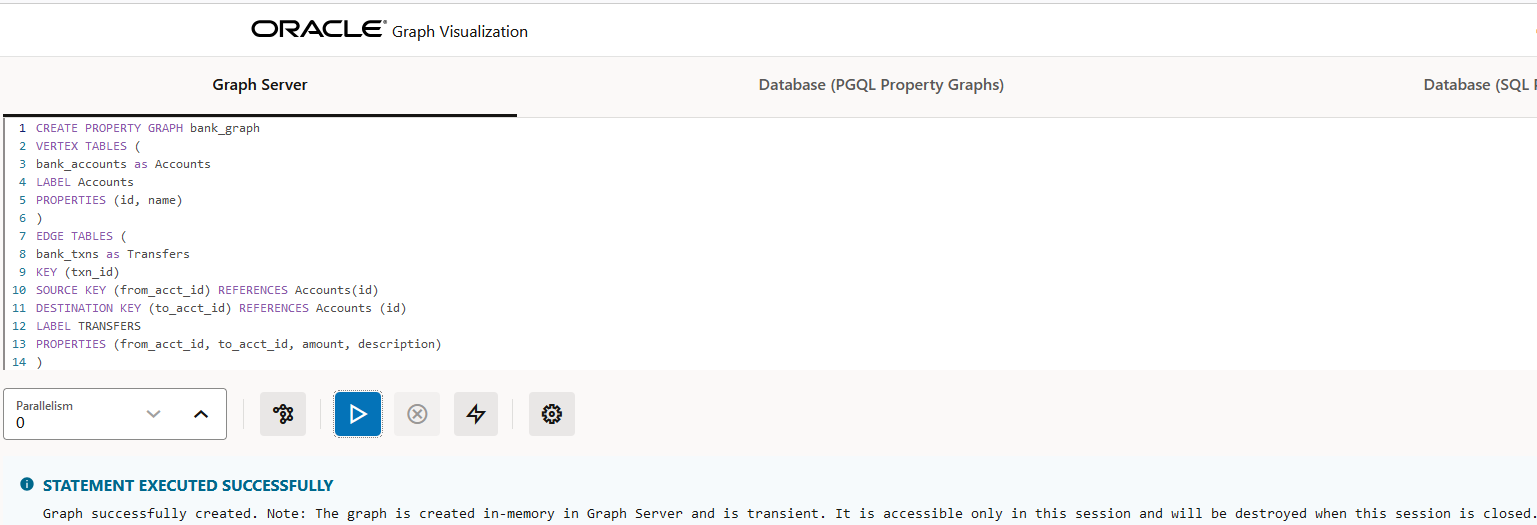
You can run the CREATE PROPERTY GRAPH PGQL statement to create a
graph in the graph server (PGX). For example:
Figure 21-3 Creating a Property Graph in the Graph Server Memory
The graph gets created and loaded into the graph server memory (PGX). Note that this is a transient graph which will be destroyed at the end of the session.
You can click the Get Graphs List icon (shown highlighted in the preceding figure) to view all the graphs that are loaded into the graph server memory.
Loading a Database Property Graph into the Graph Server (PGX) Memory
You can also load any existing PGQL or SQL property graph from the database into the graph server (PGX) memory by performing the following steps:
- Click the
 Load graph into memory icon in the
GraphServer tab.
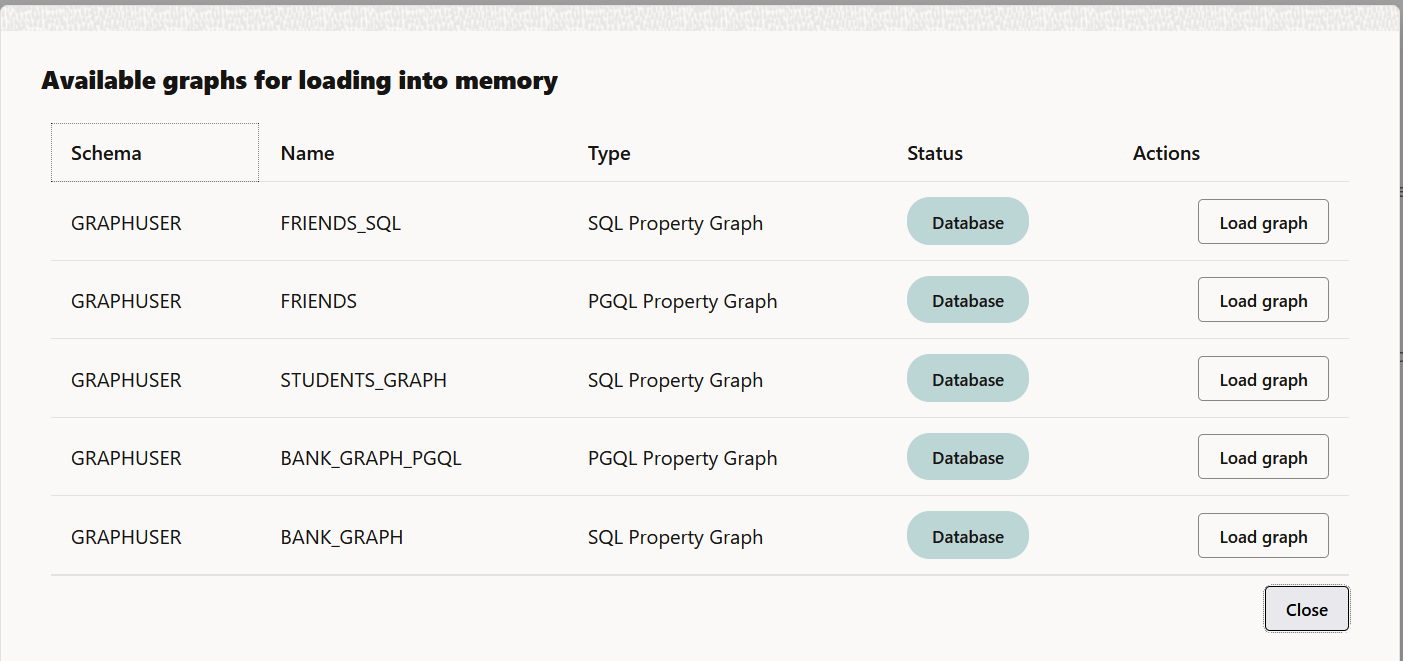
The list of database graphs to which you have access are displayed as shown:
Note that the SQL property graphs get listed only if you are connected to Oracle Database 23ai.
- Click Load graph against the desired graph.
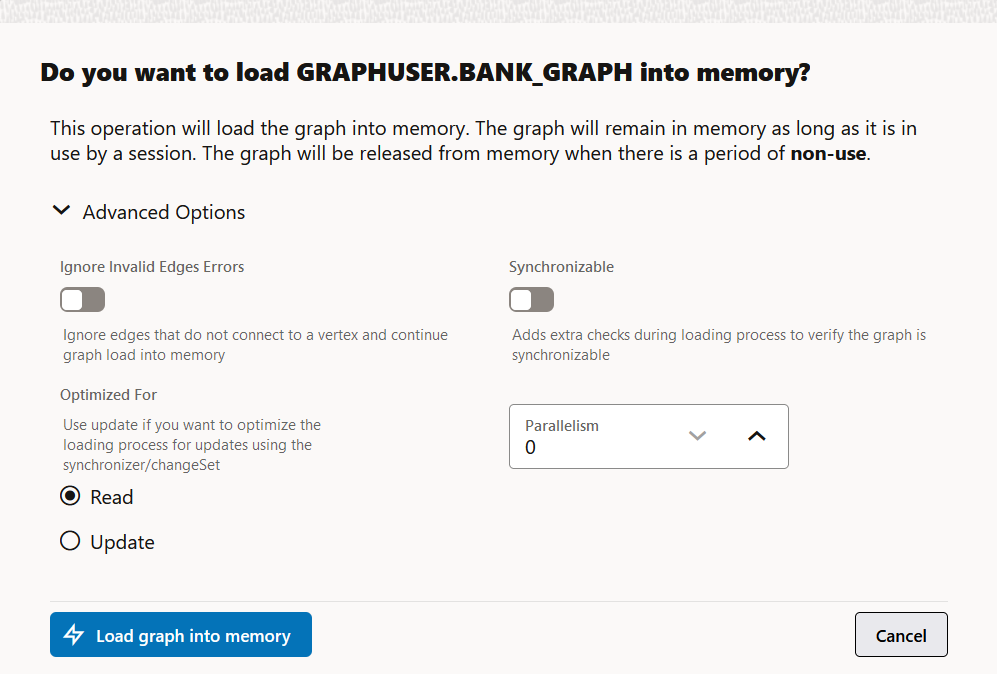
The confirmation dialog for loading the graph into memory opens.
Figure 21-5 Loading Graph Into Memory Confirmation
- Optionally, click to expand the Advanced Options
configuration.
The following advanced options can be configured:
- Ignore Invalid Edges Errors: Switch ON this toggle to ignore all edges that do not connect to a vertex.
- Synchronizable: Switch ON this toggle to verify that the graph can be synchronized.
- Optimized For: Select one of the
following graph optimization strategies:
READ: To optimize for read-intensive scenarios.-
UPDATE: To optimize for update-intensive scenarios.
- Parallelism: To specify the degree of parallelism.
- Click Load graph into memory.
The In Progress status against the graph indicates that the graph loading process is initiated and once the graph is successfully loaded into memory, the status gets updated to Memory.
- Click Close and click the Get Graphs List icon to verify that the graph is loaded into memory.
Running PGQL queries on the graph
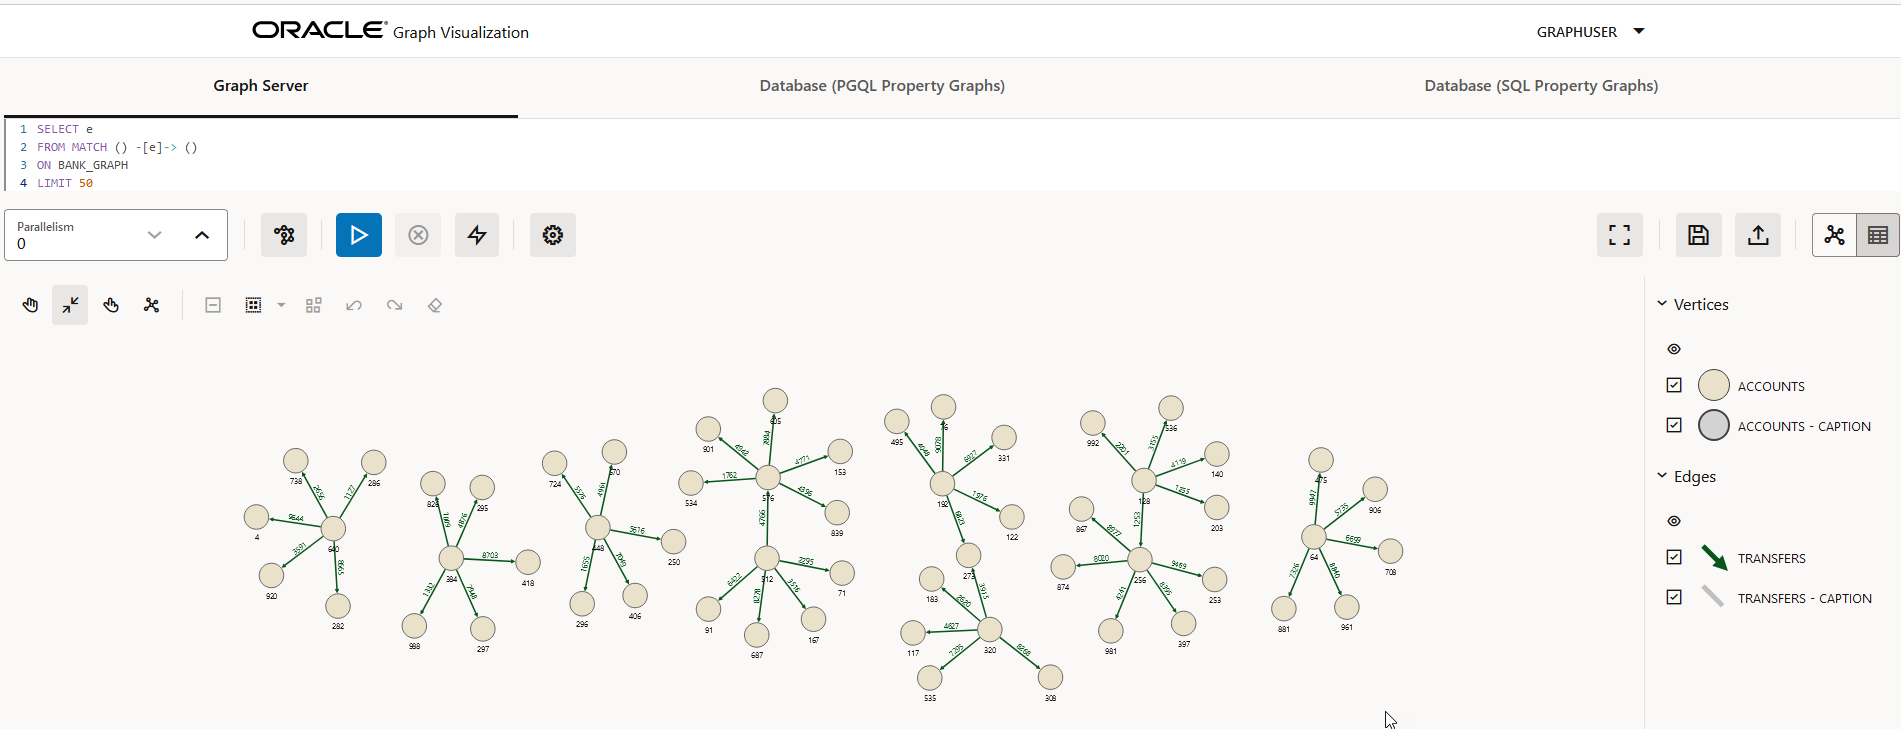
You can enter a PGQL query on the desired graph and click Run Query to execute the query. On successful execution, the graph visualization result (including nodes and their connections) is displayed in the bottom panel. You can right-click a node or connection to display tooltip information, and you can drag the nodes around.
The following figure shows a sample query visualization identifying all edges that are directed edges from any vertex in the graph to any other vertex.
Parent topic: Using the Graph Visualization Application
21.2 Visualizing PGQL Queries on PGQL Property Graphs
You can visualize PGQL queries on PGQL property graphs in the database in the Database (PGQL Property Graphs) tab of the Graph Visualization application.
You can create, query, modify and visualize PGQL property graphs in the database using the Graph Visualization application. The following PGQL operations are supported:
CREATE PROPERTY GRAPH: To create a new PGQL property graph as shown:Figure 21-7 Creating a PGQL property graph
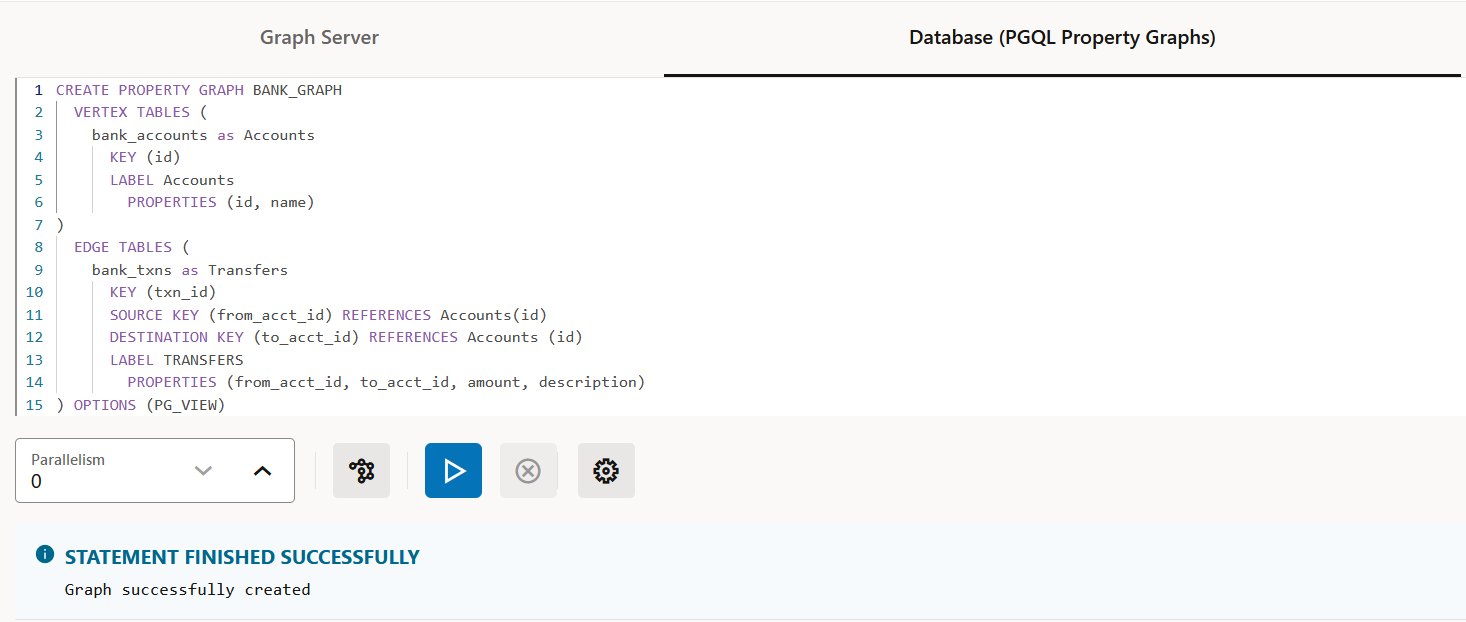
Description of "Figure 21-7 Creating a PGQL property graph"INSERT,UPDATEandDELETE: To modify an existing PGQL property graph. For example:Figure 21-8 Updating an Edge in a PGQL property graph

Description of "Figure 21-8 Updating an Edge in a PGQL property graph"Note that you must provide the graph name in the PGQL query. You can click the List of available graphs icon to view the list of PGQL property graphs to which you have access.
Figure 21-9 Deleting an Edge in a PGQL property graph

Description of "Figure 21-9 Deleting an Edge in a PGQL property graph"SELECT: To query a PGQL property graph as shown:Figure 21-10 Querying a PGQL property graph
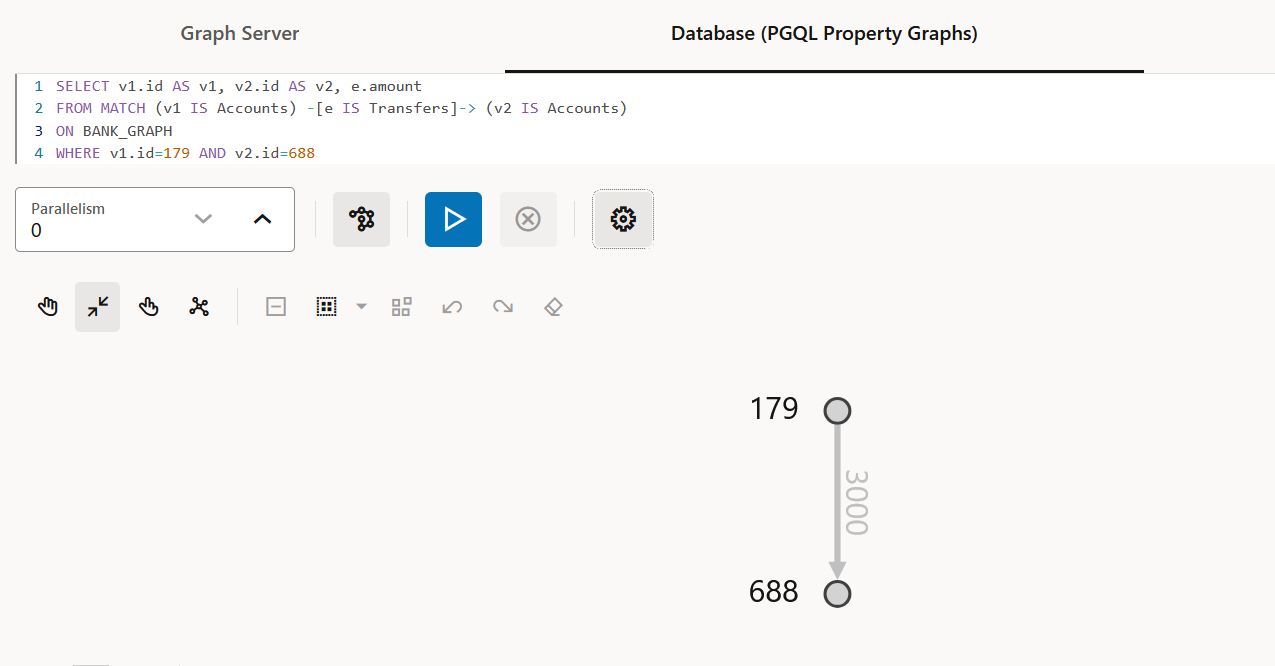
Description of "Figure 21-10 Querying a PGQL property graph"DROP PROPERTY GRAPH: To delete a PGQL property graph as shown:Figure 21-11 Dropping a PGQL property graph

Description of "Figure 21-11 Dropping a PGQL property graph"
Parent topic: Using the Graph Visualization Application
21.3 Visualizing Graph Queries on SQL Property Graphs
You can query and visualize a SQL property graph in the database in the Database (SQL Property Graphs) tab of the Graph Visualization application.
However, in order to visualize the vertices and edges of a
GRAPH_TABLE query together with their IDs and all their labels and
properties, the query must return the vertex ID, or edge ID, or both.
For example, the following figure shows the visualization of a SQL
GRAPH_TABLE query on a SQL property graph. Note that the
COLUMNS clause in the query uses the VERTEX_ID and
EDGE_ID functions.
Note:
The Graph Visualization application supports onlySELECT graph queries.
Figure 21-12 Graph Query on a SQL Property Graph
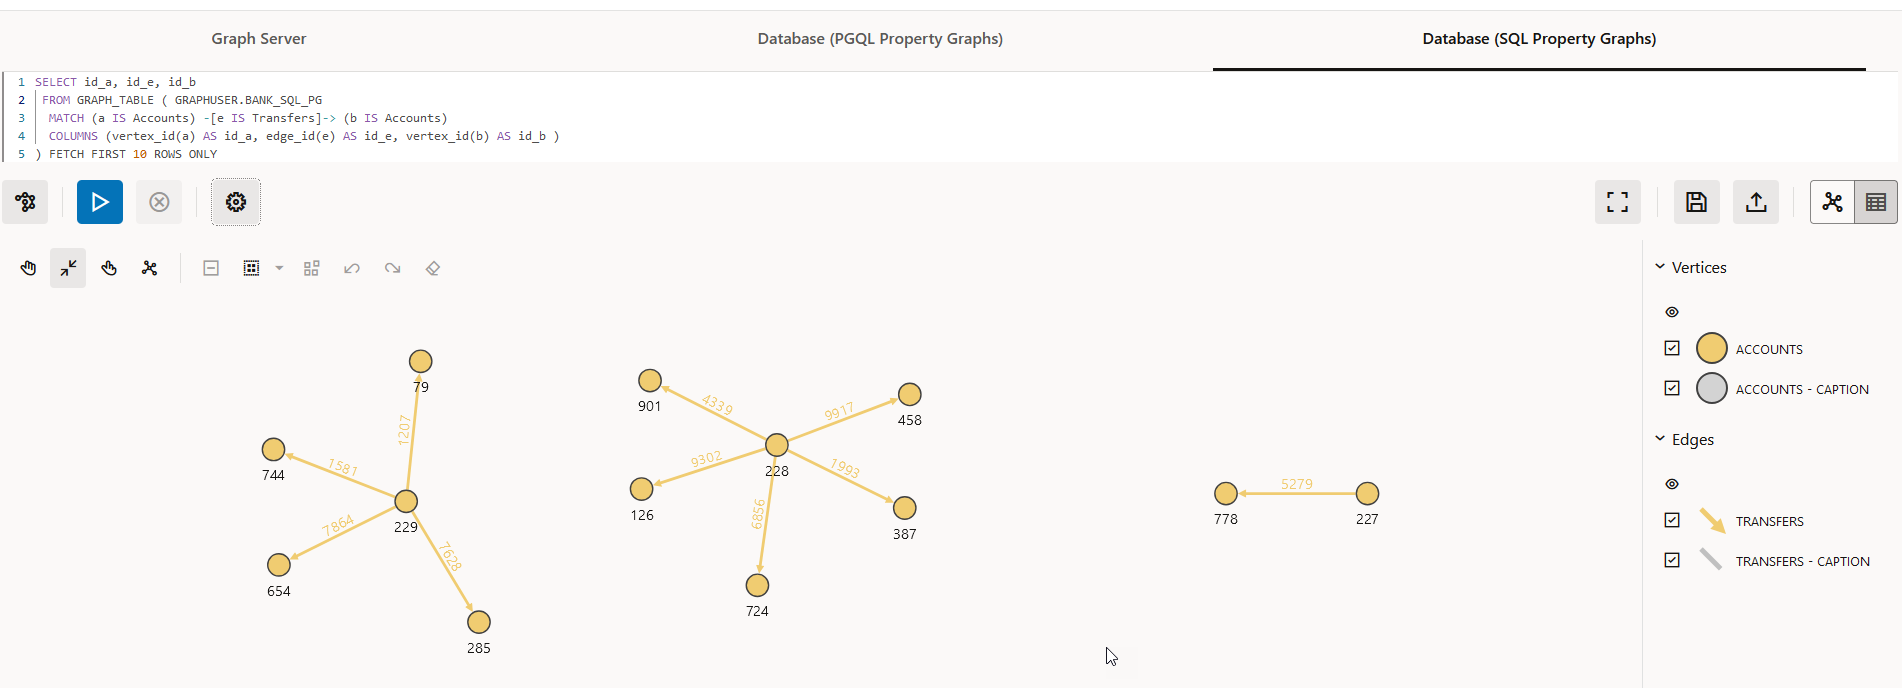
Description of "Figure 21-12 Graph Query on a SQL Property Graph"
The name of the graph must be provided in the SQL graph query. You can click the List of available graphs icon (shown highlighted in the preceding figure) to view the list of SQL property graphs to which you have access.
See Also:
SQL Graph Queries for more informationParent topic: Using the Graph Visualization Application
21.4 Graph Visualization Modes and Graph Legends
Learn about the graph visualization toolbar, supported graph visualization modes and graph legend if you are viewing the results of the query in graph format.
Graph Visualization Toolbar
The toolbar supports the following graph visualization modes:
- Move/Zoom: This mode allows you to zoom in and out, as well as to move to another part of the visualization.
- Fit to Screen: This mode fits the resulting graph in the graph visualization view.
- Toggles Sticky Mode: This mode allows you to cancel the action of dragging the nodes around.
- Activate Network Evolution: This allows you to activate or deactivate network evolution.
- Graph Manipulation: This mode allows you to
interact with your graph visualization. Supported actions are:
- Drop: To remove selected vertices from the visualization. Can also be executed from the tooltip.
- Group: To group selected multiple vertices and collapse them into a single one.
- Ungroup: To select a group of collapsed vertices and ungroup them.
- Undo: To undo the last action.
- Redo: To redo the last action.
- Reset: To reset the visualization to the original state after the query.
In addition, ![]() Toggle fullscreen mode is available on the right of the graph
visualization panel.
Toggle fullscreen mode is available on the right of the graph
visualization panel.
Graph Visualization Legends
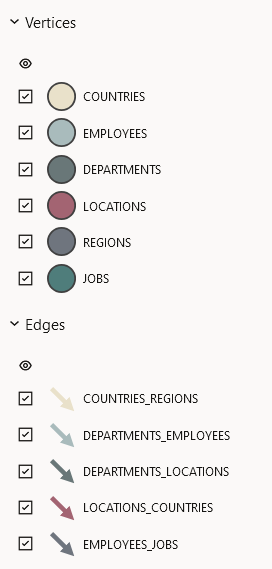
The graph visualization legend panel appears on the right of the graph visualization panel and displays the legend items that represent the vertices and edges of the graph. For example:
You can view or edit the style used for a legend in the Styles tab of the Graph Visualization settings. See Configuring Vertex and Edge Styles for more information.
Parent topic: Using the Graph Visualization Application
21.5 Graph Visualization Settings
You can click the Settings gear icon to open the Graph Visualization settings window.
The Visualization settings window comprises the General, Graph Exploration, and Styles tab.
Configuring General Settings
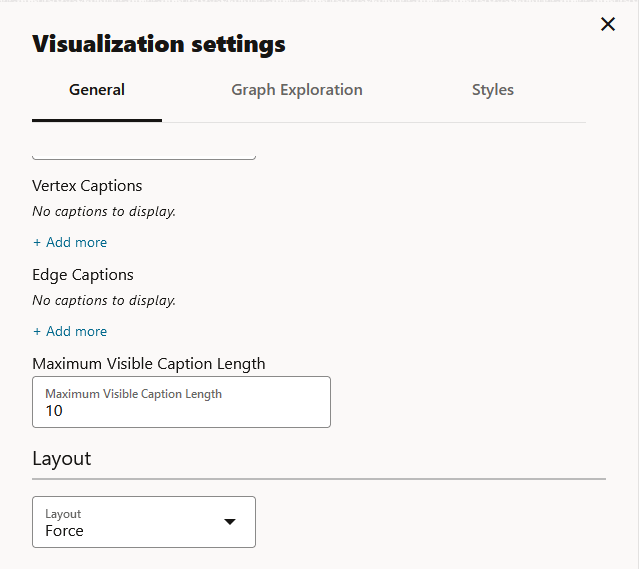
You can add vertex and edge captions, set the graph layout and page size in the General of the Graph Visualization settings:
- Vertex Caption Orientation: Determines where the selected vertex property will be displayed.
- Vertex Caption: Determines the property to be displayed for
a vertex.
Click + Add more to add a vertex caption and select the required vertex Label and vertex Property.
- Edge Caption: Determines the property to be displayed for an
edge.
Click + Add more to add an edge caption and select the required edge Label and edge Property.
- Maximum Visible Caption Length: Maximum caption length before truncating.
- Layout: Computes the position of the nodes and determines the
visual structure of the graph.
Supported layouts are: Circle, Concentric, Force (default), Grid, Hierarchical, Preset, Radial, and Random.
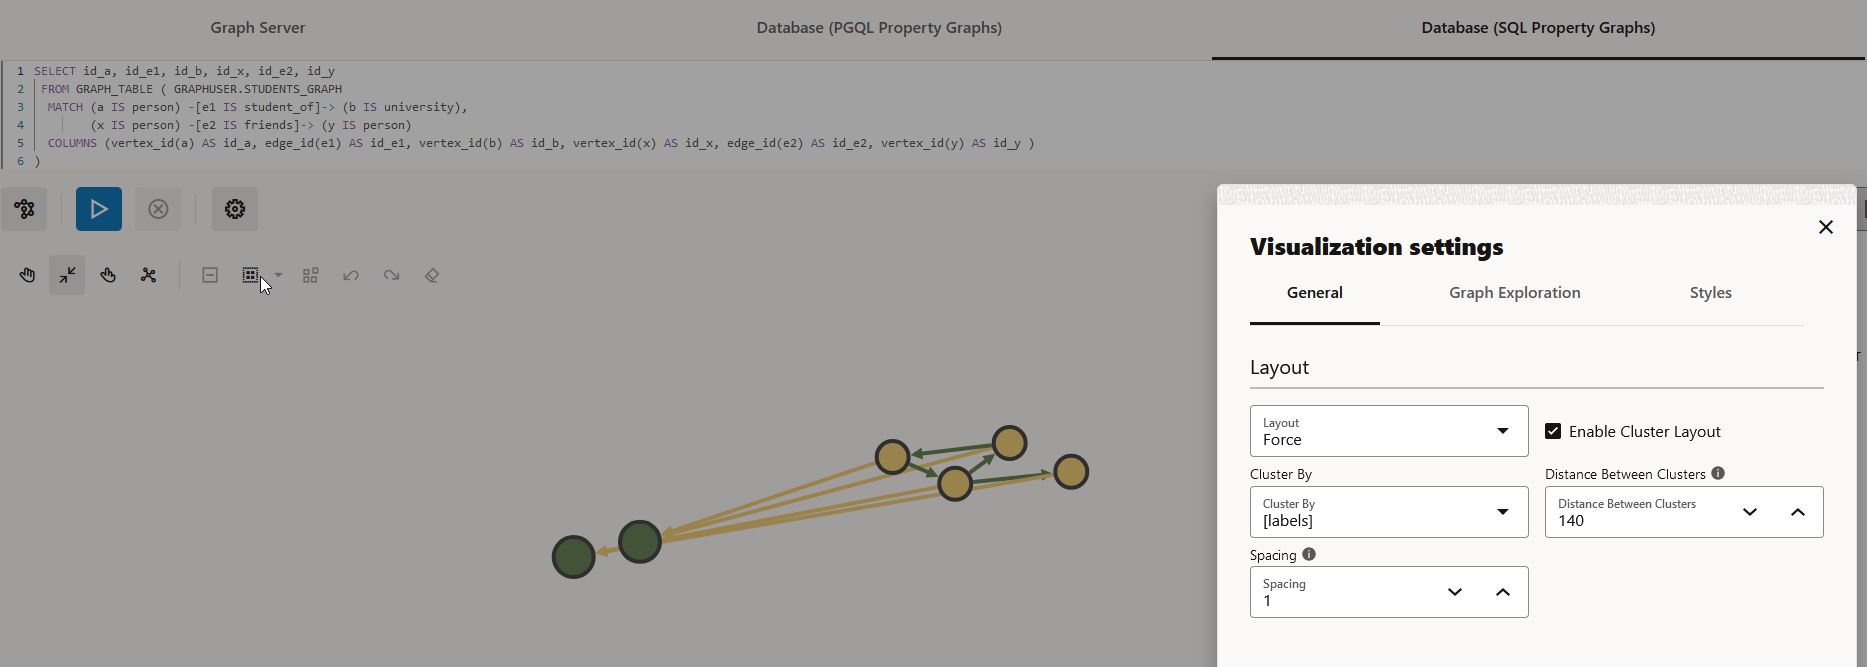
The Force layout also supports a clustering option, which allows you to visualize a graph with clustered vertices. See Enabling Cluster Option in Graph Visualization for more information.
- Page Size: Determines the number of entries to be visualized from the result set.
Configuring Graph Exploration Settings
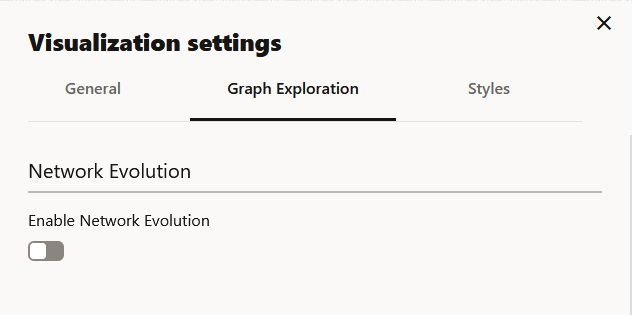
You can enable and configure Network Evolution in the Graph Exploration tab of the Graph Visualization settings. See Using Network Evolution in Graph Visualization for more information.
Figure 21-16 Graph Exploration Tab Configuration
Configuring Vertex and Edge Styles
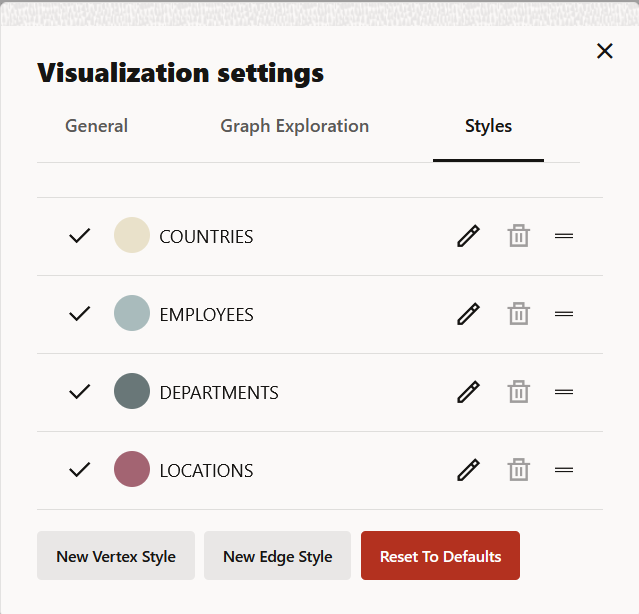
You can configure and manage vertex and edge styles to customize the appearance of vertices and edges in the graph. The Styles tab of the Graph Visualization settings displays both the default and custom vertex and edge styles.
You can perform the following actions in this tab:
- Add a new custom vertex style.
- Add a new custom edge style.
- Edit the default styling of a vertex or an edge element.
- Edit or delete the custom styling of a vertex or an edge element.
- Restore the default style settings.
Figure 21-17 Vertex and Edge Styles Configuration
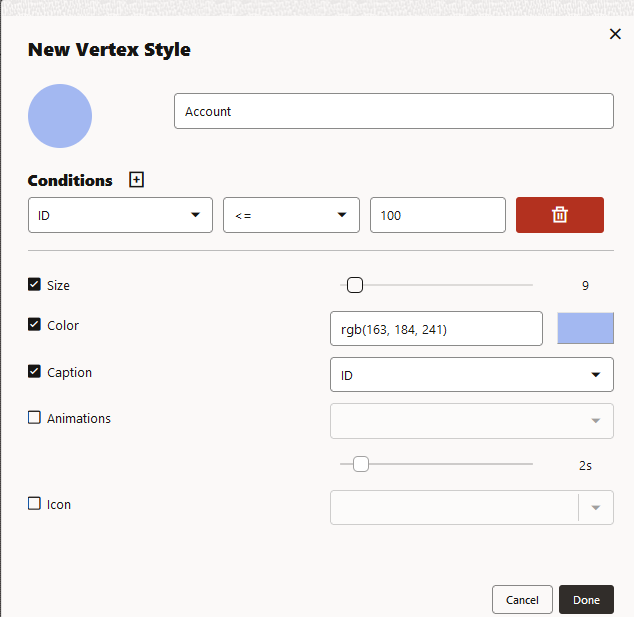
To add a new vertex or edge style, click New vertex style or New edge style as appropriate and configure the following values:
- Name: Name of the style
- Conditions: Click + to add a condition
for an element (vertex or edge) and provide the following values:
- Property of the vertex or edge element.
- Operator to be applied. The
following operators are supported:
=(equal to)<(less than)<=(less than or equal to)>(greater than)>=(greater than or equal to)!=(not equal to)~(filter is a regular expression)*(any: like a wildcard, can match to anything)
- Value that needs to be fulfilled for the property and the operator
You can add as many conditions as required. For all elements that meet the conditions, you can configure any of the following styling highlights:
- Size: Size of the vertex or edge
- Color: Color of the vertex or edge
- Caption: Caption for the vertex or edge
- Animations: Animation (Pulsating or Flashing) and duration of the animation cycle
- Icon: Image for the vertex (does not apply for edges)
The following example shows a sample vertex style configuration.
Parent topic: Using the Graph Visualization Application
21.6 Enabling Cluster Option in Graph Visualization
You can enable the cluster option with Force layout to group vertices by labels or by any specific vertex property in your graph visualization.
Perform the following steps to apply clustering of vertices in your graph visualization:
Parent topic: Using the Graph Visualization Application
21.7 Importing and Exporting Graph Visualization Settings
You can import and export the graph visualization settings as a JSON file.
Figure 21-20 Importing and Exporting Settings
Parent topic: Using the Graph Visualization Application
21.8 Using Network Evolution in Graph Visualization
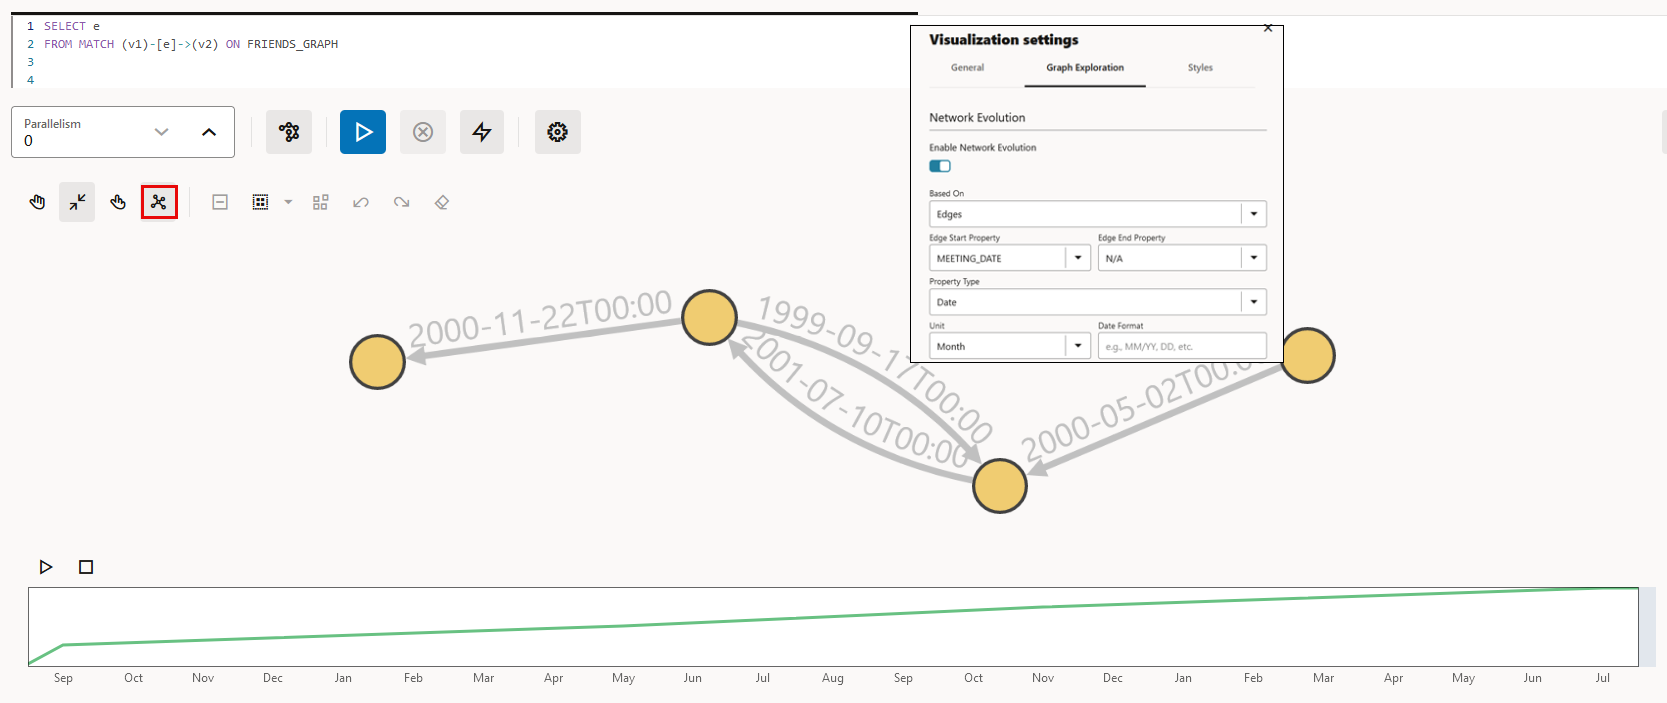
You can visualize the evolution of a graph over time using the Network Evolution feature in the Graph Visualization application.
In order to visualize a dynamic graph, it is important that the graph contains date or time properties. It can either be a vertex or an edge property.
Perform the following steps for configuring network evolution:
Parent topic: Using the Graph Visualization Application

