Usage
Usage examples on Github
Base Styles
When neither base styles nor any rule based styles are defined (or applied), the following default base styles are applied to the graph:
  1
  2
  3
  4
  5
  6
  7
  8
  9
 10
 11
 12
 13
 14
 15
 16
 17
 18
 19
 20
 21
 22
 23
 24
 25
 26
 27
 28
 29
 30
 31
 32
 33
 34
 35
 36
 37
 38
 39
 40
 41
 42
 43
 44
 45
 46
 47
 48
 49
 50
 51
 52
 53
 54
 55
 56
 57
 58
 59
 60
 61
 62
 63
 64
 65
 66
 67
 68
 69
 70
 71
 72
 73
 74
 75
 76
 77
 78
 79
 80
 81
 82
 83
 84
 85
 86
 87
 88
 89
 90
 91
 92
 93
 94
 95
 96
 97
 98
 99
100
101
102
103
104
105
106
107
108
109
110
111
112
113
114
115
116 | const border = {
width: 1,
color: '#404040'
};
const badge = {
size: 6,
color: '#FF584A',
label: {
text: '${group.size}',
angle: null,
color: 'white',
font: {
weight: 'bold'
}
}
};
const defaults: Styles = {
'*': {
filter: 'none',
label: {
maxLength: 15,
font: {
size: 10
}
}
},
vertex: {
size: 8,
color: 'lightgray',
image: {
scale: 1
},
border,
icon: {
color: 'white'
},
label: {
angle: 270,
d: 2
}
},
'vertex:group': {
size: '${interpolate("group.size", 8, 16)}',
opacity: 1,
color: '#75BBF0',
border,
label: {
text: '',
angle: 270,
d: 2
},
icon: null,
image: null,
legend: null,
children: {
size: badge
}
},
edge: {
width: 2,
color: '#C0C0C0',
label: {
position: 0,
d: 1
}
},
'edge:group': {
width: 2,
opacity: 1,
label: null,
children: {
size: badge
}
},
'* > *': {
size: 5,
d: 0,
color: 'darkgray',
border: null,
icon: {
color: 'white'
},
image: {
scale: 1
},
label: {
d: 1
}
},
'vertex > *': {
angle: 45
},
'edge > *': {
position: 0
},
':unselected': {
filter: 'grayscale(100%)'
},
'vertex:unselected': {
opacity: 0.3
},
'edge:unselected': {
opacity: 0.3
},
'vertex:hover': {
size: '${previous + 4}'
},
'edge:hover': {
width: '${previous + 2}'
},
'edge:hover > *': {
size: '${previous + 2}'
}
};
|
defaults by supplying their own settings.baseStyles, allowing for customization of the base styles used by the component.
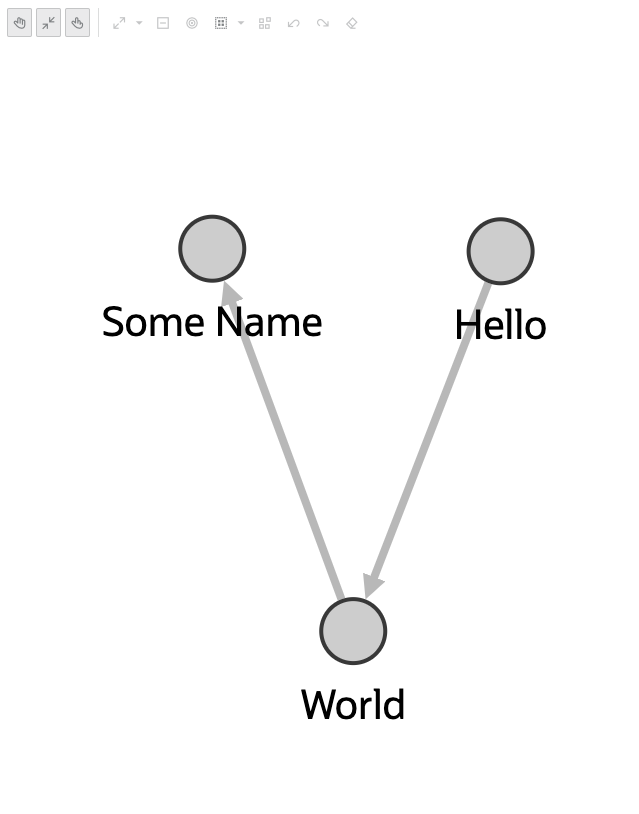
Example JavaScript usage (@gvt/graphviz also contains TypeScript definitions if you are using TypeScript). For base styles, it applies styles for all vertices/edges.
 1
 2
 3
 4
 5
 6
 7
 8
 9
10
11
12
13
14
15
16
17
18
19
20
21
22
23
24
25
26
27
28
29
30
31
32
33
34
35
36
37
38
39
40
41
42
43
44
45
46
47
48
49
50
51
52
53
54
55
56
57 | // This import is not necessary if you are using Oracle JET.
import '@ovis/graph/alta.css';
import Visualization from '@gvt/graphviz';
const vertices = [
{
id: 1,
properties: {
label: 'blue',
name: 'Hello'
},
labels: ['color']
},
{
id: 2,
properties: {
label: 'blue',
name: 'World'
},
labels: ['color']
},
{
id: 3,
properties: {
name: 'Some Name'
},
labels: ['text']
}
];
const edges = [
{
id: 1,
source: 1,
target: 2,
labels: ['edge']
},
{
id: 2,
source: 2,
target: 3,
labels: ['edge']
}
];
const settings = {
baseStyles: {
vertex: {
label: { text: '${properties.name}' }
}
}
};
new GraphVisualization({
target: document.body,
props: { data: { vertices, edges }, settings }
});
|
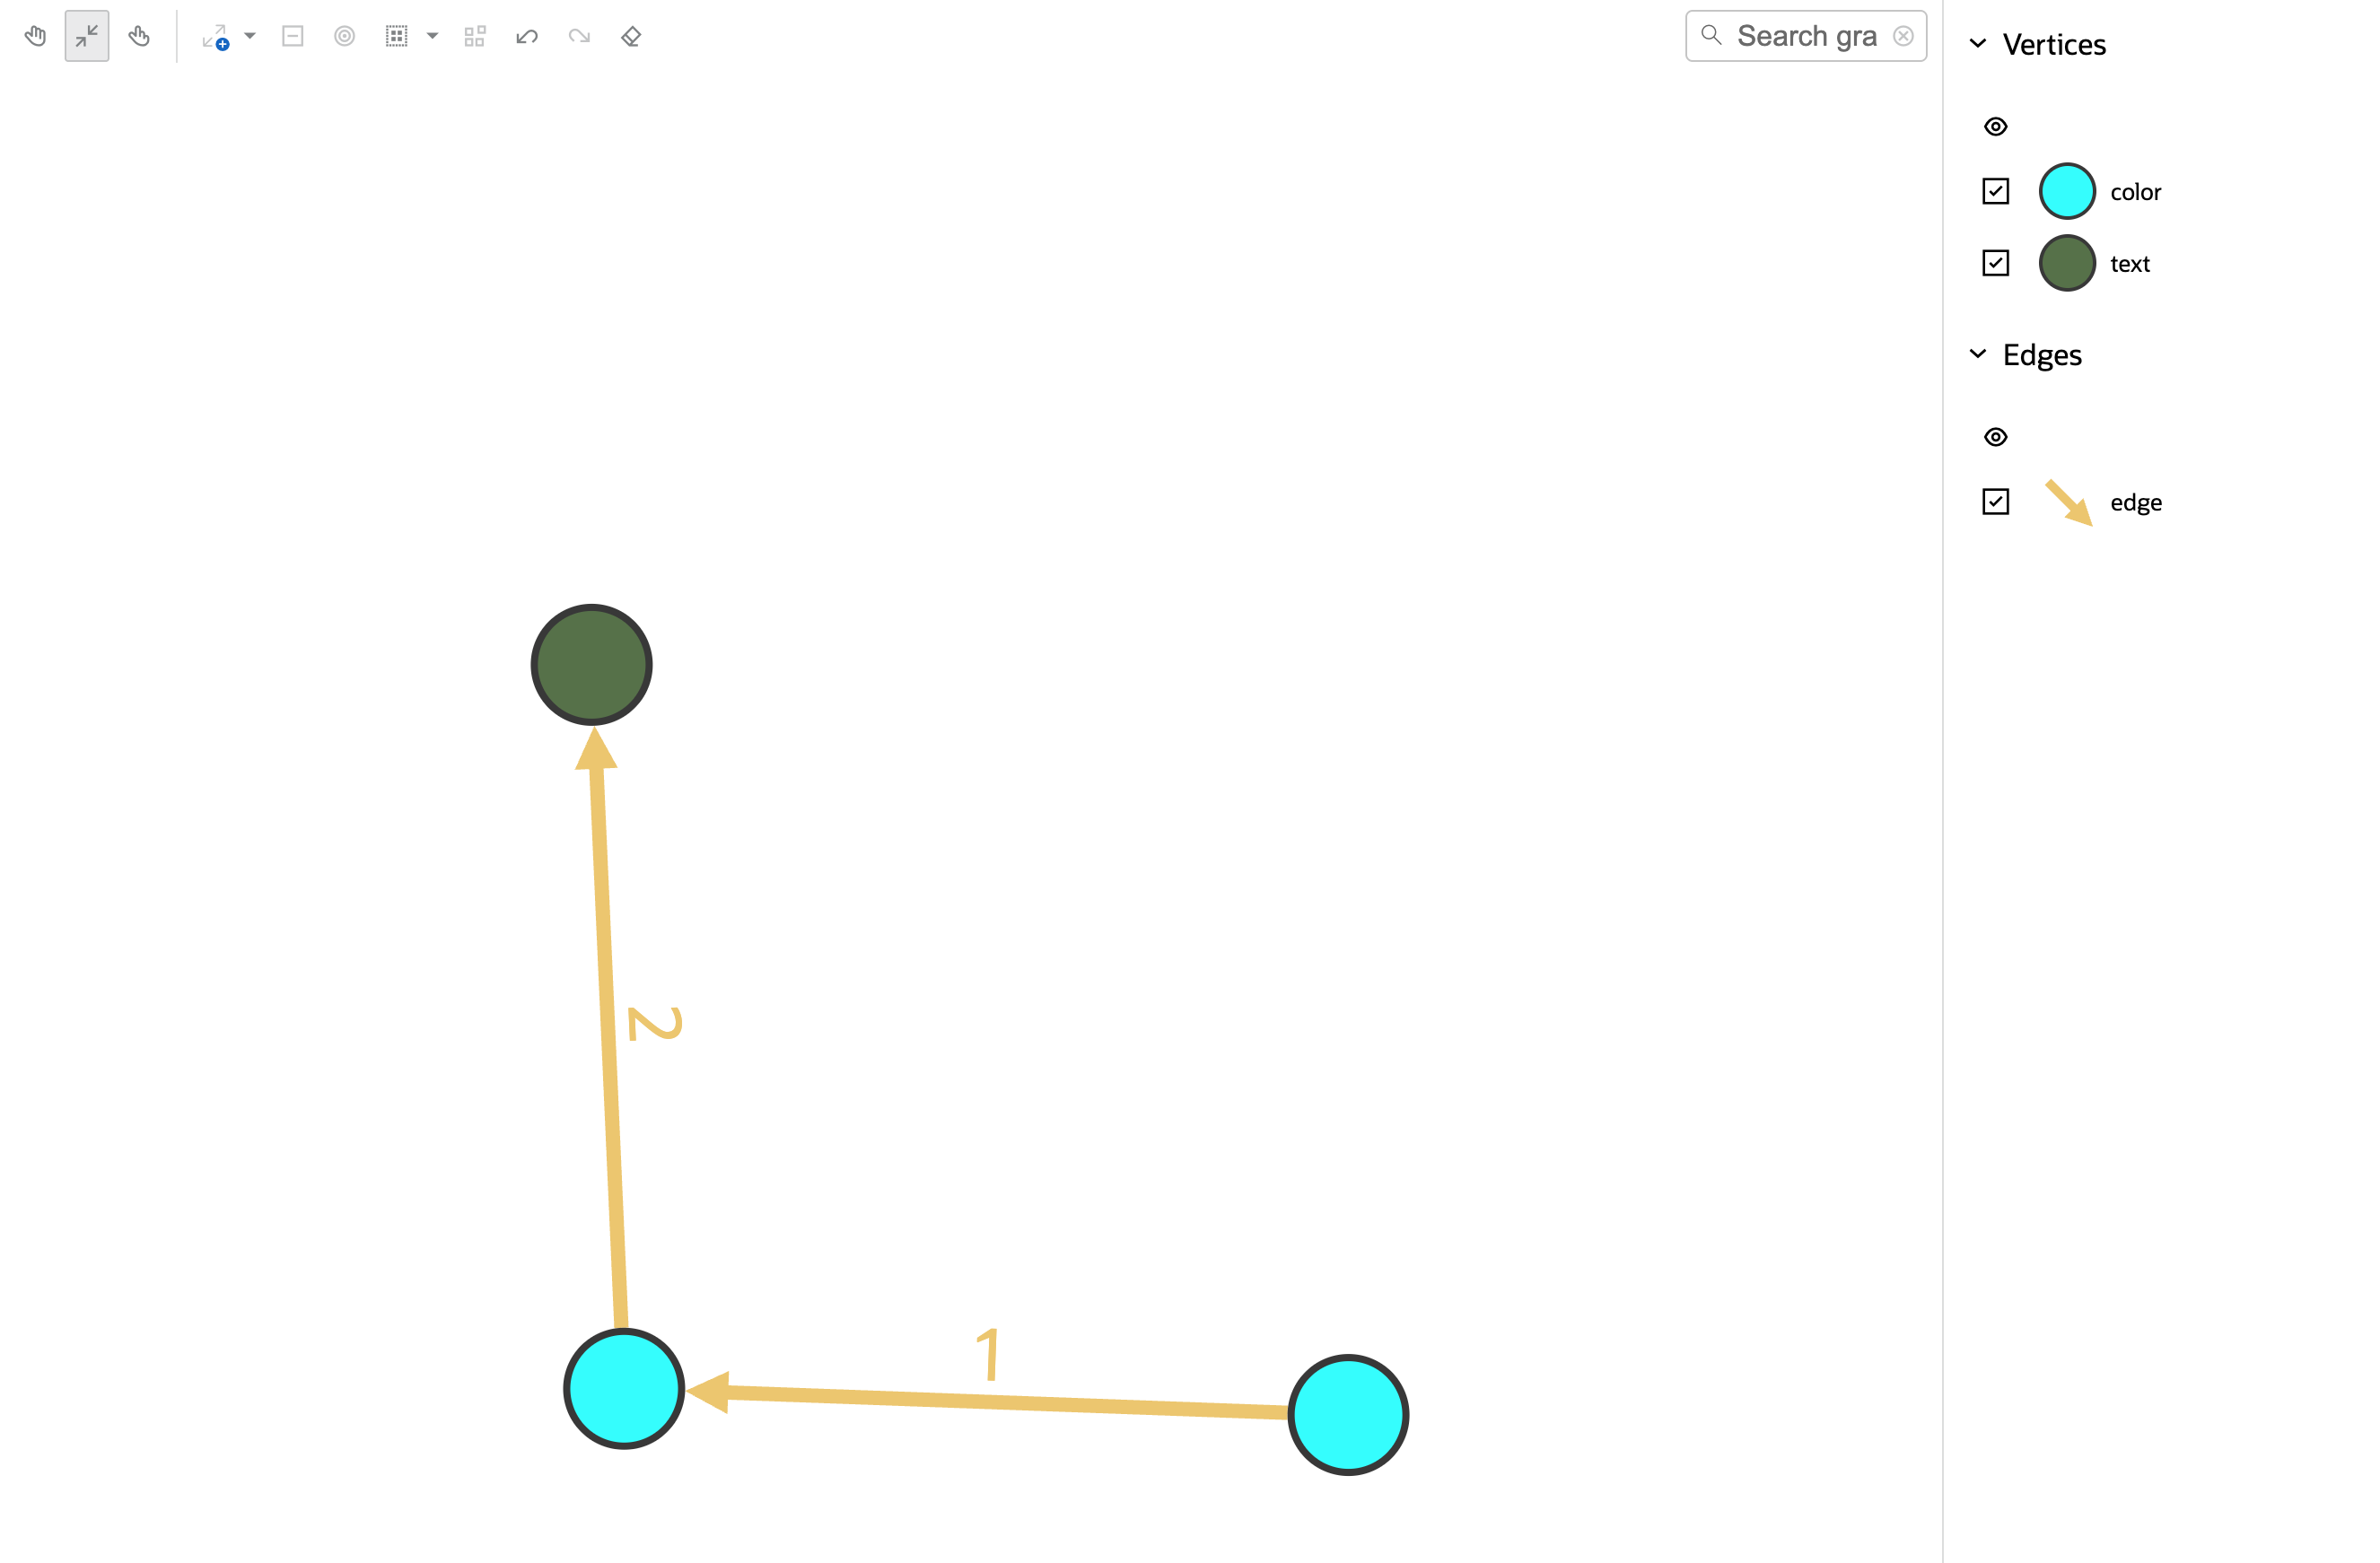
Default Legend Styles
When vertices or edges include labels, corresponding legend entries will be automatically generated based on those labels.
 1
 2
 3
 4
 5
 6
 7
 8
 9
10
11
12
13
14
15
16
17
18
19
20
21
22
23
24
25
26
27
28
29
30
31
32
33
34
35
36
37
38
39
40
41
42
43
44
45
46
47 | const vertices = [
{
id: 1,
properties: {
label: 'blue',
name: 'Hello'
},
labels:['color']
},
{
id: 2,
properties: {
label: 'blue',
name: 'World'
},
labels:['color']
},
{
id: 3,
properties: {
name: 'Some Name'
},
labels:['text']
}
];
const edges = [
{
id: 1,
source: 1,
target: 2,
labels: ['edge']
},
{
id: 2,
source: 2,
target: 3,
labels: ['edge']
}
];
const settings = {baseStyles: {}};
const graphViz = new GraphVisualization({
target: document.body,
props: { data: { vertices, edges }, settings }
});
|
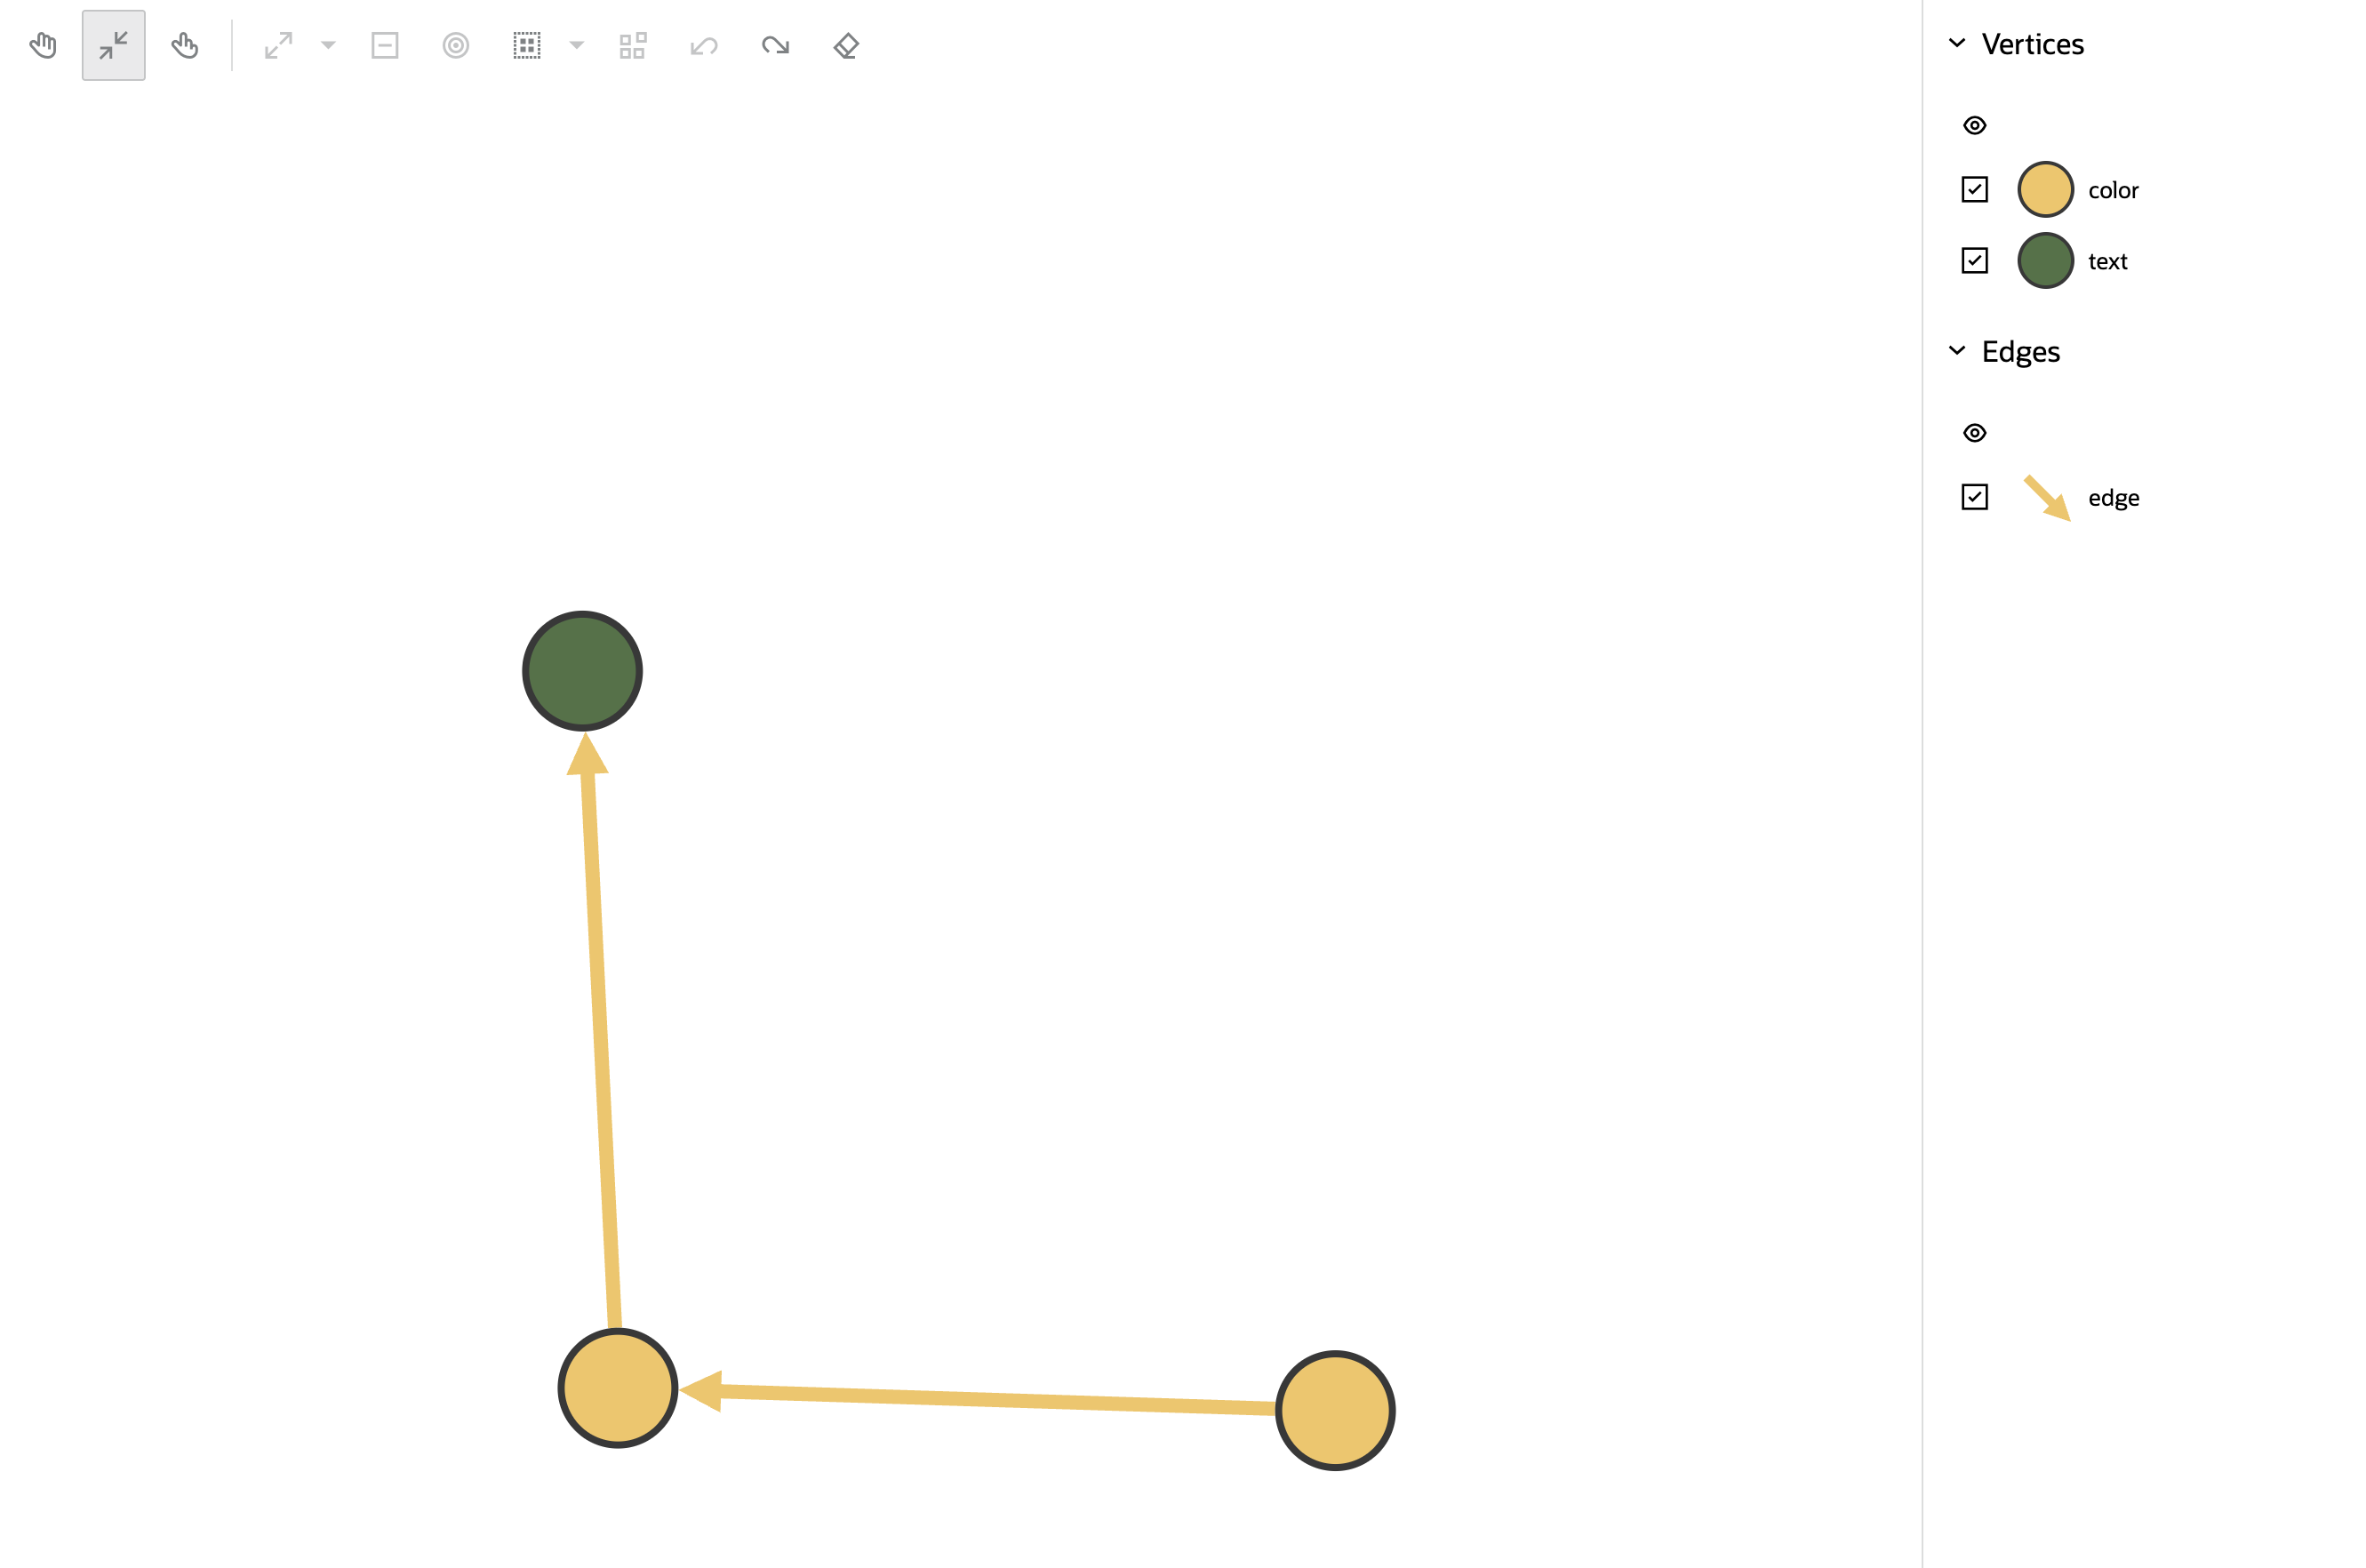
The getCurrentRuleBasedStyles function returns the currently defined rule-based styles, including both user-defined and auto-generated rule-based styles. You can use this function to change auto-generated rule-based styles as shown in the following example:
 1
 2
 3
 4
 5
 6
 7
 8
 9
10
11
12
13
14
15
16
17
18
19
20
21
22
23
24
25
26
27
28
29
30
31
32
33
34
35
36
37
38
39
40
41
42
43
44
45
46
47
48
49
50
51
52
53
54
55
56
57
58
59
60
61
62
63
64
65 | const graphViz = new GraphVisualization({
target: document.body,
props: { data: { vertices, edges }, settings }
});
const receivedRules = grpahViz.getCurrentRuleBasedStyles();
/*
Here is exmple of receivedRules. If the rule is default, rule.isDefault is true.
[
{
"_id": "2",
"stylingEnabled": true,
"target": "vertex",
"conditions": {
"operator": "and",
"conditions": [
{
"property": "labels",
"operator": "~",
"value": "color"
}
]
},
"component": "vertex",
"style": {
"color": "#F0CC71"
},
"legendTitle": "color",
"isDefaultRule": true
},
...
]
*/
//modify receivedRules. Notice: Do not edit _id, isDefaultRule, and conditions.
//modify _id = 2 default rule, color to aqua
receivedRules = [
{
"_id": "2",
"stylingEnabled": true,
"target": "vertex",
"conditions": {
"operator": "and",
"conditions": [
{
"property": "labels",
"operator": "~",
"value": "color"
}
]
},
"component": "vertex",
"style": {
"color": "aqua"
},
"legendTitle": "color",
"isDefaultRule": true
},
...
]
//assgin the modified received rulest to settings.ruleBasedStyles
settings.ruleBasedStyles = recivedRules;
graphViz.$set({setting});
|
Themes
Dark theme can be enabled through settings.
 1
 2
 3
 4
 5
 6
 7
 8
 9
10
11
12
13
14
15
16
17
18
19
20
21
22
23
24
25
26
27
28
29
30
31
32
33
34
35
36
37
38
39
40
41
42
43
44
45
46
47
48
49
50
51
52
53
54
55
56
57
58 | // This import is not necessary if you are using Oracle JET.
import '@ovis/graph/alta.css';
import Visualization from '@gvt/graphviz';
const vertices = [
{
id: 1,
properties: {
label: 'blue',
name: 'Hello'
},
labels:['color']
},
{
id: 2,
properties: {
label: 'blue',
name: 'World'
},
labels:['color']
},
{
id: 3,
properties: {
name: 'Some Name'
},
labels:['text']
}
];
const edges = [
{
id: 1,
source: 1,
target: 2,
labels: ['edge']
},
{
id: 2,
source: 2,
target: 3,
labels: ['edge']
}
];
const settings = {
theme: 'dark',
baseStyles: {
vertex: {
label: { text: '${properties.name}' }
}
}
};
new GraphVisualization({
target: document.body,
props: { data: { vertices, edges }, settings }
});
|

Customized Theme can be applied to modify the background and foreground colors.
 1
 2
 3
 4
 5
 6
 7
 8
 9
10
11
12
13
14
15
16
17
18
19
20
21
22
23
24
25
26
27
28
29
30
31
32
33
34
35
36
37
38
39
40
41
42
43
44
45
46
47
48
49
50
51
52
53
54
55
56
57
58
59
60
61 | // This import is not necessary if you are using Oracle JET.
import '@ovis/graph/alta.css';
import Visualization from '@gvt/graphviz';
const vertices = [
{
id: 1,
properties: {
label: 'blue',
name: 'Hello'
},
labels:['color']
},
{
id: 2,
properties: {
label: 'blue',
name: 'World'
},
labels:['color']
},
{
id: 3,
properties: {
name: 'Some Name'
},
labels:['text']
}
];
const edges = [
{
id: 1,
source: 1,
target: 2,
labels: ['edge']
},
{
id: 2,
source: 2,
target: 3,
labels: ['edge']
}
];
const settings = {
customTheme: {
'backgroundColor': '#2F3C7E',
'textColor': '#FBEAEB'
},
baseStyles: {
vertex: {
label: { text: '${properties.name}' }
}
}
};
new GraphVisualization({
target: document.body,
props: { data: { vertices, edges }, settings }
});
|

Important Notes:
- When both dark theme and custom theme are applied simultaneously, the colors defined in the custom theme will take precedence over the dark theme colors.
- If the settings specify a label color, the label will use the color from the label settings rather than the color from the theme settings.
Children
The children attribute allows for the user to to create children nodes that appear on the circumference of the nodes they are indicated. Styles can be applied like they would be applied to any node.
 1
 2
 3
 4
 5
 6
 7
 8
 9
10
11
12
13
14
15
16
17
18
19
20
21
22
23
24
25
26
27
28
29
30
31
32
33
34
35
36
37
38
39
40
41
42
43
44
45
46
47
48
49
50
51
52
53
54
55
56
57
58
59
60
61
62
63
64
65
66
67
68
69
70
71
72
73
74
75
76
77
78
79
80
81
82
83
84
85
86 | // This import is not necessary if you are using Oracle JET.
import '@ovis/graph/alta.css';
import Visualization from '@gvt/graphviz';
const vertices = [
{
id: 1,
properties: {
label: 'blue',
name: 'Hello'
}
},
{
id: 2,
properties: {
label: 'blue',
name: 'World'
}
},
{
id: 3,
properties: {
name: 'Some Name'
}
}
];
const edges = [
{
id: 1,
source: 1,
target: 2
},
{
id: 2,
source: 2,
target: 3
}
];
const settings = {
showLegend: false,
baseStyles: {
vertex: {
label: { text: '${properties.name}' },
// This would add two children to every vertex, any name can be assigned to these children nodes.
children: {
firstChild: {
size: '4',
color: 'red',
children: {
size: '2'
}
},
secondChild: {
size: '2',
color: 'green',
border: {
'width': 1,
'color': 'black'
}
}
}
}
}
};
settings.ruleBasedStyles = [{
component: 'vertex',
target: 'vertex',
stylingEnabled: true,
conditions: {
operator: 'and',
conditions: [{
property: "label",
operator: "=",
value: "blue"
}]
},
style: { color: 'blue' }
}];
new GraphVisualization({
target: document.body,
props: { data: { vertices, edges }, settings }
});
|

Interpolation
Interpolation has two use cases, it can be applied to the size or color of the vertices or edges. Additionally, interpolation has three different types, linear interpolation, discrete interpolation and color interpolation.
The normal interpolation can be used to define the size of nodes or edges within a range using a property as the value to interpolate in said range.
 1
 2
 3
 4
 5
 6
 7
 8
 9
10
11
12
13
14
15
16
17
18
19
20
21
22
23
24
25
26
27
28
29
30
31
32
33
34
35
36
37
38
39
40
41
42
43
44
45
46
47
48
49
50
51
52
53
54
55
56
57
58
59
60
61
62
63
64
65
66
67
68
69
70
71
72
73 | // This import is not necessary if you are using Oracle JET.
import '@ovis/graph/alta.css';
import Visualization from '@gvt/graphviz';
const vertices = [
{
id: 1,
properties: {
label: 'blue',
name: 'Hello',
age: 10
}
},
{
id: 2,
properties: {
label: 'blue',
name: 'World',
age: 20
}
},
{
id: 3,
properties: {
name: 'Some Name',
age: 30
}
}
];
const edges = [
{
id: 1,
source: 1,
target: 2
},
{
id: 2,
source: 2,
target: 3
}
];
const settings = {
showLegend: false,
ruleBasedStyles: [{
component: 'vertex',
target: 'vertex',
stylingEnabled: true,
conditions: {
operator: 'and',
conditions: [{
property: "label",
operator: "=",
value: "blue"
}]
},
style: { color: 'blue' }
}],
baseStyles: {
vertex: {
// The label is changed to see the size of the node on it.
label: { text: '${interpolate("properties.age", 1, 20)}' },
// The size will be defined by the interpolation of properties.age in the range of 1 -> 20.
size: '${interpolate("properties.age", 1, 20)}'
}
}
};
new GraphVisualization({
target: document.body,
props: { data: { vertices, edges }, settings}
});
|

Additionally, multiple values can be used in the interpolation instead of just using one range.
 1
 2
 3
 4
 5
 6
 7
 8
 9
10
11
12
13
14
15
16
17
18
19
20
21
22
23
24
25
26
27
28
29
30
31
32
33
34
35
36
37
38
39
40
41
42
43
44
45
46
47
48
49
50
51
52
53
54
55
56
57
58
59
60
61
62
63
64
65
66
67
68
69
70
71
72
73 | // This import is not necessary if you are using Oracle JET.
import '@ovis/graph/alta.css';
import Visualization from '@gvt/graphviz';
const vertices = [
{
id: 1,
properties: {
label: 'blue',
name: 'Hello',
age: 10
}
},
{
id: 2,
properties: {
label: 'blue',
name: 'World',
age: 20
}
},
{
id: 3,
properties: {
name: 'Some Name',
age: 30
}
}
];
const edges = [
{
id: 1,
source: 1,
target: 2
},
{
id: 2,
source: 2,
target: 3
}
];
const settings = {
showLegend: false,
ruleBasedStyles: [{
component: 'vertex',
target: 'vertex',
stylingEnabled: true,
conditions: {
operator: 'and',
conditions: [{
property: "label",
operator: "=",
value: "blue"
}]
},
style: { color: 'blue' }
}],
baseStyles: {
vertex: {
// The label is changed to see the size of the node on it.
label: { text: '${interpolate("properties.age", 1, 20, 40)}' },
// The size will be defined by the interpolation of properties.age using the values of 1, 20, 40.
size: '${interpolate("properties.age", 1, 20, 40)}'
}
}
};
new GraphVisualization({
target: document.body,
props: { data: { vertices, edges }, settings}
});
|
Using the new API can achieve the same result.

Discrete interpolation can be used to define the size of nodes or edges within a range using a property as the value to interpolate in said range. Except that contrary to the normal interpolation, the resulting values while using discrete interpolation can only be exactly the start or ending value of the range, if the property being used lies in the first half between the min and max values, it will be rounded down, and otherwise will be rounded up. Discrete interpolation can also be used for colors.
 1
 2
 3
 4
 5
 6
 7
 8
 9
10
11
12
13
14
15
16
17
18
19
20
21
22
23
24
25
26
27
28
29
30
31
32
33
34
35
36
37
38
39
40
41
42
43
44
45
46
47
48
49
50
51
52
53
54
55
56
57
58
59
60
61
62
63
64
65
66
67
68
69
70
71
72
73
74 | // This import is not necessary if you are using Oracle JET.
import '@ovis/graph/alta.css';
import Visualization from '@gvt/graphviz';
const vertices = [
{
id: 1,
properties: {
label: 'blue',
name: 'Hello',
age: 10
}
},
{
id: 2,
properties: {
label: 'blue',
name: 'World',
age: 20
}
},
{
id: 3,
properties: {
name: 'Some Name',
age: 30
}
}
];
const edges = [
{
id: 1,
source: 1,
target: 2
},
{
id: 2,
source: 2,
target: 3
}
];
const settings = {
showLegend: false,
ruleBasedStyles: [{
component: 'vertex',
target: 'vertex',
stylingEnabled: true,
conditions: {
operator: 'and',
conditions: [{
property: "label",
operator: "=",
value: "blue"
}]
},
style: { color: 'blue' }
}],
baseStyles: {
vertex: {
// The label is changed to see the size of the node on it.
label: { text: '${interpolate.discrete("properties.age", 1, 20)}' },
// The size will be defined by the interpolation of properties.age in the range of 1 -> 20.
// In this example since the node with age 20 is exactly in the middle, it will be rounded up to 20.
size: '${interpolate.discrete("properties.age", 1, 20)}'
}
}
};
new GraphVisualization({
target: document.body,
props: { data: { vertices, edges }, settings}
});
|

Discrete interpolation can also be used using colors. All that is required is to define the colors that want to be discretely interpolated.
 1
 2
 3
 4
 5
 6
 7
 8
 9
10
11
12
13
14
15
16
17
18
19
20
21
22
23
24
25
26
27
28
29
30
31
32
33
34
35
36
37
38
39
40
41
42
43
44
45
46
47
48
49
50
51
52
53
54
55
56 | // This import is not necessary if you are using Oracle JET.
import '@ovis/graph/alta.css';
import Visualization from '@gvt/graphviz';
const vertices = [
{
id: 1,
properties: {
label: 'blue',
name: 'Hello',
age: 10
}
},
{
id: 2,
properties: {
label: 'blue',
name: 'World',
age: 20
}
},
{
id: 3,
properties: {
name: 'Some Name',
age: 30
}
}
];
const edges = [
{
id: 1,
source: 1,
target: 2
},
{
id: 2,
source: 2,
target: 3
}
];
const settings = {
baseStyles: {
vertex: {
label: { text: '${interpolate.discrete("properties.age", "black", "white")}' },
color: '${interpolate.discrete("properties.age", "black", "white")}'
}
}
};
new GraphVisualization({
target: document.body,
props: { data: { vertices, edges }, settings }
});
|

Colors can also be linearly interpolated using the interpolate.color function. All that is required is to send in the colors between which the user wants to interpolate the desired property.
 1
 2
 3
 4
 5
 6
 7
 8
 9
10
11
12
13
14
15
16
17
18
19
20
21
22
23
24
25
26
27
28
29
30
31
32
33
34
35
36
37
38
39
40
41
42
43
44
45
46
47
48
49
50
51
52
53
54
55
56 | // This import is not necessary if you are using Oracle JET.
import '@ovis/graph/alta.css';
import Visualization from '@gvt/graphviz';
const vertices = [
{
id: 1,
properties: {
label: 'blue',
name: 'Hello',
age: 10
}
},
{
id: 2,
properties: {
label: 'blue',
name: 'World',
age: 20
}
},
{
id: 3,
properties: {
name: 'Some Name',
age: 30
}
}
];
const edges = [
{
id: 1,
source: 1,
target: 2
},
{
id: 2,
source: 2,
target: 3
}
];
const settings = {
baseStyles: {
vertex: {
label: { text: '${properties.age}' },
color: '${interpolate.color("properties.age", "black", "white")}'
}
}
};
new GraphVisualization({
target: document.body,
props: { data: { vertices, edges }, settings }
});
|

RuleBasedStyles
RuleBasedStyles can be applied on any attribute of the graph that can be found inside the properties from vertices or edges. Once the property or properties have been defined, a condition is verified and the vertices or edges are filtered accordingly on wether or not the properties return true for the given coditions.
The supported operators on which the properties are verified are =, >, <, >=, <=, != and ~ which verifies if there is a match of the value on the property.
The example below demonstrates how to create a rule that turns vertices blue if they have a label with the value "blue" in properties.
 1
 2
 3
 4
 5
 6
 7
 8
 9
10
11
12
13
14
15
16
17
18
19
20
21
22
23
24
25
26
27
28
29
30
31
32
33
34
35
36
37
38
39
40
41
42
43
44
45
46
47
48
49
50
51
52
53
54
55
56
57
58
59
60
61
62
63
64
65
66
67
68
69
70
71
72
73
74
75
76
77
78
79
80
81 | // This import is not necessary if you are using Oracle JET.
import '@ovis/graph/alta.css';
import Visualization from '@gvt/graphviz';
const vertices = [
{
id: 1,
properties: {
label: 'blue',
name: 'Hello',
age: 10
}
},
{
id: 2,
properties: {
label: 'blue',
name: 'World',
age: 20
}
},
{
id: 3,
properties: {
name: 'Some Name',
age: 30
}
}
];
const edges = [
{
id: 1,
source: 1,
target: 2
},
{
id: 2,
source: 2,
target: 3
}
];
const settings = {};
settings.baseStyles = {
vertex: {
label: { text: '${properties.name}' }
}
};
settings.ruleBasedStyles = [
{
// Rule's target
target: 'vertex',
component: 'vertex',
// The conditions on which the filter will be applied
conditions: {
operator: 'and',
conditions: [
// This condition will verify if the label on a vertex is equals to 'blue'
{
property: "label",
operator: "=",
value: "blue"
}
]
},
// The title for the filter that will show in the legend
legendTitle: 'Rule by label',
// The colors to apply to the nodes that match the rule
style: {
color: 'blue'
},
stylingEnabled: true
}
];
new GraphVisualization({
target: document.body,
props: { data: { vertices, edges }, settings }
});
|
RuleBasedStyles can also be applied to adjust the size of nodes, with the flexibility to use multiple conditions simultaneously. These conditions can be configured using and or or operators, allowing the filter to apply only when all specified conditions are met or when any of the conditions are satisfied, respectively.
 1
 2
 3
 4
 5
 6
 7
 8
 9
10
11
12
13
14
15
16
17
18
19
20
21
22
23
24
25
26
27
28
29
30
31
32
33
34
35
36
37
38
39
40
41
42
43
44
45
46
47
48
49
50
51
52
53
54
55
56
57
58
59
60
61
62
63
64
65
66
67
68
69
70
71
72
73
74
75
76
77
78
79
80
81
82
83
84
85
86
87 | // This import is not necessary if you are using Oracle JET.
import '@ovis/graph/alta.css';
import Visualization from '@gvt/graphviz';
const vertices = [
{
id: 1,
properties: {
label: 'blue',
name: 'Hello',
age: 10
}
},
{
id: 2,
properties: {
label: 'blue',
name: 'World',
age: 20
}
},
{
id: 3,
properties: {
name: 'Some Name',
age: 30
}
}
];
const edges = [
{
id: 1,
source: 1,
target: 2
},
{
id: 2,
source: 2,
target: 3
}
];
const settings = {};
settings.baseStyles = {
vertex: {
label: {text: '${properties.name}'}
}
};
settings.ruleBasedStyles = [
{
// Rule's target
target: 'vertex',
component: 'vertex',
// The conditions on which the rule will be applied
conditions: {
operator: 'and',
conditions: [
// This condition will verify that the name contains the letter o
{
property: "label",
operator: "~",
value: "o"
},
// This condition will verify that the name contains the letter l
{
property: "label",
operator: "~",
value: "l"
}
]
},
// The title for the filter that will show in the legend
legendTitle: 'Rule by name',
// The colors to apply to the nodes that match the rule
style: {
size: 15
},
stylingEnabled: true
}
];
new GraphVisualization({
target: document.body,
props: { data: { vertices, edges }, settings }
});
|
Animations
Animations allows the user to show dynamic movement on the vertices and/or edges of the graph in order to highlight attributes of it. They are applied via the settings filters.
To show a graph where the vertices' stroke width is animated the following example can be applied:
 1
 2
 3
 4
 5
 6
 7
 8
 9
10
11
12
13
14
15
16
17
18
19
20
21
22
23
24
25
26
27
28
29
30
31
32
33
34
35
36
37
38
39
40
41
42
43
44
45
46
47
48
49
50
51
52
53
54
55
56
57
58
59
60
61
62
63
64
65
66
67
68
69
70
71
72
73
74
75
76
77
78
79
80
81
82
83
84
85
86
87
88
89
90
91
92
93 | // This import is not necessary if you are using Oracle JET.
import '@ovis/graph/alta.css';
import Visualization from '@gvt/graphviz';
const vertices = [
{
id: 1,
properties: {
label: 'blue',
name: 'Hello',
age: 10
}
},
{
id: 2,
properties: {
label: 'blue',
name: 'World',
age: 20
}
},
{
id: 3,
properties: {
name: 'Some Name',
age: 30
}
}
];
const edges = [
{
id: 1,
source: 1,
target: 2
},
{
id: 2,
source: 2,
target: 3
}
];
const settings = {};
settings.baseStyles = {
vertex: {
label: { text: '${properties.name}' }
}
};
settings.ruleBasedStyles= [
{
target: 'vertex',
component: 'vertex',
legendTitle: 'Vertex animation',
animations: [[
{
duration: 1,
keyFrames: [
{
percentage: 0,
style: {
strokeWidth: '3px'
}
},
{
percentage: 50,
style: {
strokeWidth: '7px'
}
},
{
percentage: 100,
style: {
strokeWidth: '3px'
}
}
]
}
]],
conditions: {
operator: 'and',
// This rule is applied to all vertices
conditions: []
}
}
];
new GraphVisualization({
target: document.body,
props: { data: { vertices, edges }, settings }
});
|
The values that have to be provided to the animation are:
duration: defines the duration of the animation in seconds.keyframes: an array representing all the changes that have to be applied to the entity during the animation.
The keyframes properties that need to be provided are:
percentage: represents at what percentage of the animation duration should this keyframe be applied, for smooth animations, when working with multiple keyframes, the values should start on 0 and end in 100. If only a single keyframe is provided the percentage should be 100; this option is only meaningful when working with strokeDashoffset as explained further below.style: the styles that should be applied to the entity at each keyframe.
For the style properties, the supported ones are:
strokeWidth: defines the width of the stroke that surrounds the vertices and the width of the edges, this can be passed as any valid css value (px is recommended).stroke: defines the color of the stroke that surrounds the vertices and the width of the edges.opacity: defines the opacity on a scale of 0 to 1, 0 being that the element is completely hidden and 1 being the element being shown with full opacity.r: defines the radius of the vertices that it is applicable to. Only applicable to vertices.strokeDashoffset: defines the amount of offset that has to be applied to the dash patter on the edges. Negative values make the offset go in the oposite direction. For this animation to be visible, the edges must have a dashed pattern applied to them, otherwise, nothing will be seen on the graph. This attribute is only applicable to edges.
Here's an example on how to apply edge animation using strokeDashoffset:
 1
 2
 3
 4
 5
 6
 7
 8
 9
10
11
12
13
14
15
16
17
18
19
20
21
22
23
24
25
26
27
28
29
30
31
32
33
34
35
36
37
38
39
40
41
42
43
44
45
46
47
48
49
50
51
52
53
54
55
56
57
58
59
60
61
62
63
64
65
66
67
68
69
70
71
72
73
74
75
76
77
78
79
80
81
82
83
84
85
86 | // This import is not necessary if you are using Oracle JET.
import '@ovis/graph/alta.css';
import Visualization from '@gvt/graphviz';
const vertices = [
{
id: 1,
properties: {
label: 'blue',
name: 'Hello',
age: 10
}
},
{
id: 2,
properties: {
label: 'blue',
name: 'World',
age: 20
}
},
{
id: 3,
properties: {
name: 'Some Name',
age: 30
}
}
];
const edges = [
{
id: 1,
source: 1,
target: 2
},
{
id: 2,
source: 2,
target: 3
}
];
const settings = {};
settings.baseStyles = {
vertex: {
label: { text: '${properties.name}' }
}
};
settings.ruleBasedStyles = [
{
target: 'edge',
component: 'edge',
legendTitle: 'Edge animation',
style: {
dasharray: 'dashed'
},
animations: [
[
{
duration: 1,
keyFrames: [
{
percentage: 100,
style: {
strokeDashoffset: 50
}
}
]
}
]]
,
conditions: {
operator: 'and',
conditions: []
}
}
];
new GraphVisualization({
target: document.body,
props: { data: { vertices, edges }, settings }
});
|