8.3 Configure Attributes for the APEX Graph Visualization Plug-in
Learn how to customize your graph visualization using the Graph Visualization plug-in attributes in your APEX application.
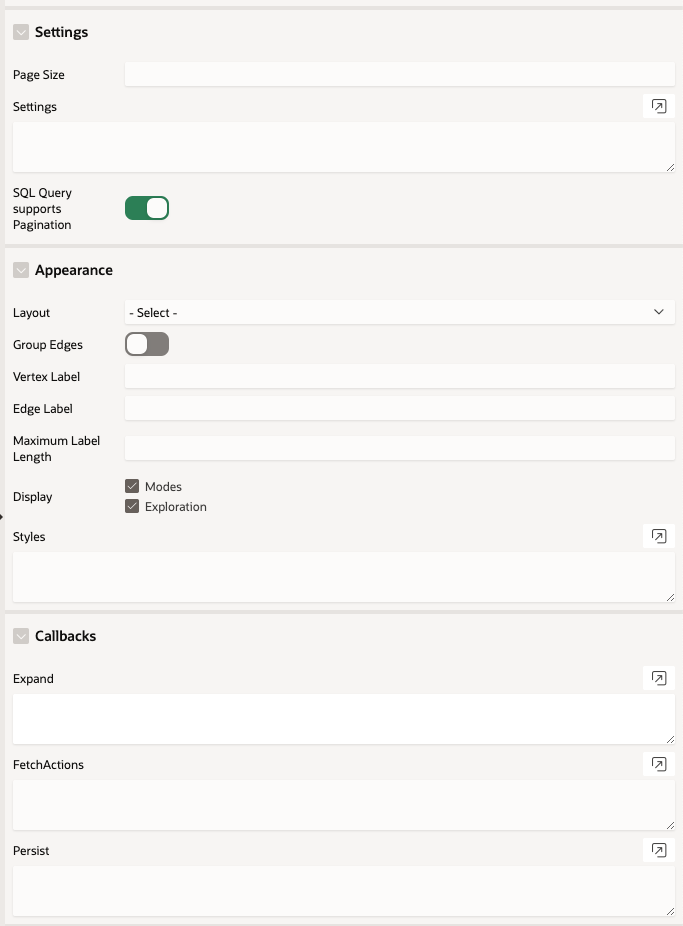
You can configure the attributes for the plug-in component in the Attributes tab (Property Editor) on the right pane of the Page Designer.

Description of the illustration apex_plugin_attr.png
See the Interface page in Graph JavaScript API Reference for Property Graph Visualization which describes the interface mapping for the plugin attributes.
The attributes are grouped as per their scope in the following panels:
Settings
Appearance
| Attribute | Description |
|---|---|
| Layout | Specify the graph layout. |
| Group Edges | Switch on this toggle to group edges. |
| Vertex Label | Specify the property to be used for the vertex label. |
| Edge Label | Specify the property to be used for the edge label. |
| Maximum Label Length | Specify the maximum length of the label. |
| Display Modes | Select this checkbox to display the modes panel with the
following options:
|
| Display Exploration | Select this checkbox to display the following graph exploration
actions:
|
| Styles | Specify the styles configuration in JSON format. See Styles for more information. |
Callbacks
| Attribute | Description |
|---|---|
| Expand | To expand a selected vertex in the graph visualization, see Expand for more information. |
| FetchActions | To retrieve the graph actions from a data source, refer to fetchActions for more information. |
| Persist | To persist the graph actions to a data source, refer to persist for more information. |
- Settings
You can apply different graph settings such as switching layouts, grouping edges, or showing the evolution of the graph entities based on a property using the Settings attribute in the Property Editor of the Page Designer. - Styles
You can style a graph using the Styles attribute in the Property Editor of the Page Designer. - Expand
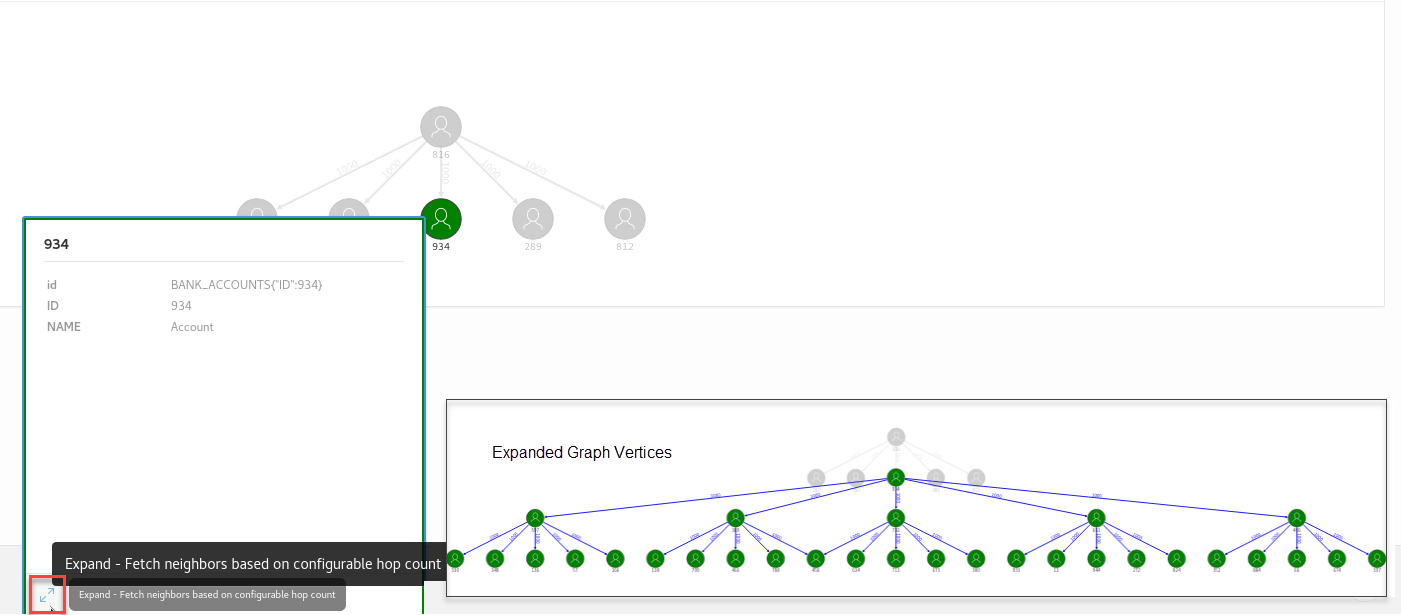
You can expand a selected vertex in the graph and fetch the adjacent vertices using the Expand attribute in the Property Editor of the Page Designer.
8.3.1 Settings
You can apply different graph settings such as switching layouts, grouping edges, or showing the evolution of the graph entities based on a property using the Settings attribute in the Property Editor of the Page Designer.
8.3.2 Styles
You can style a graph using the Styles attribute in the Property Editor of the Page Designer.
