Usage
Usage examples on Github
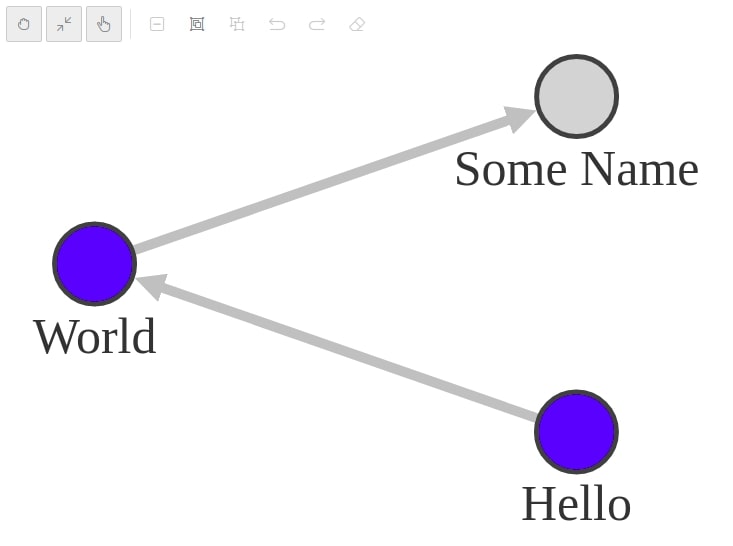
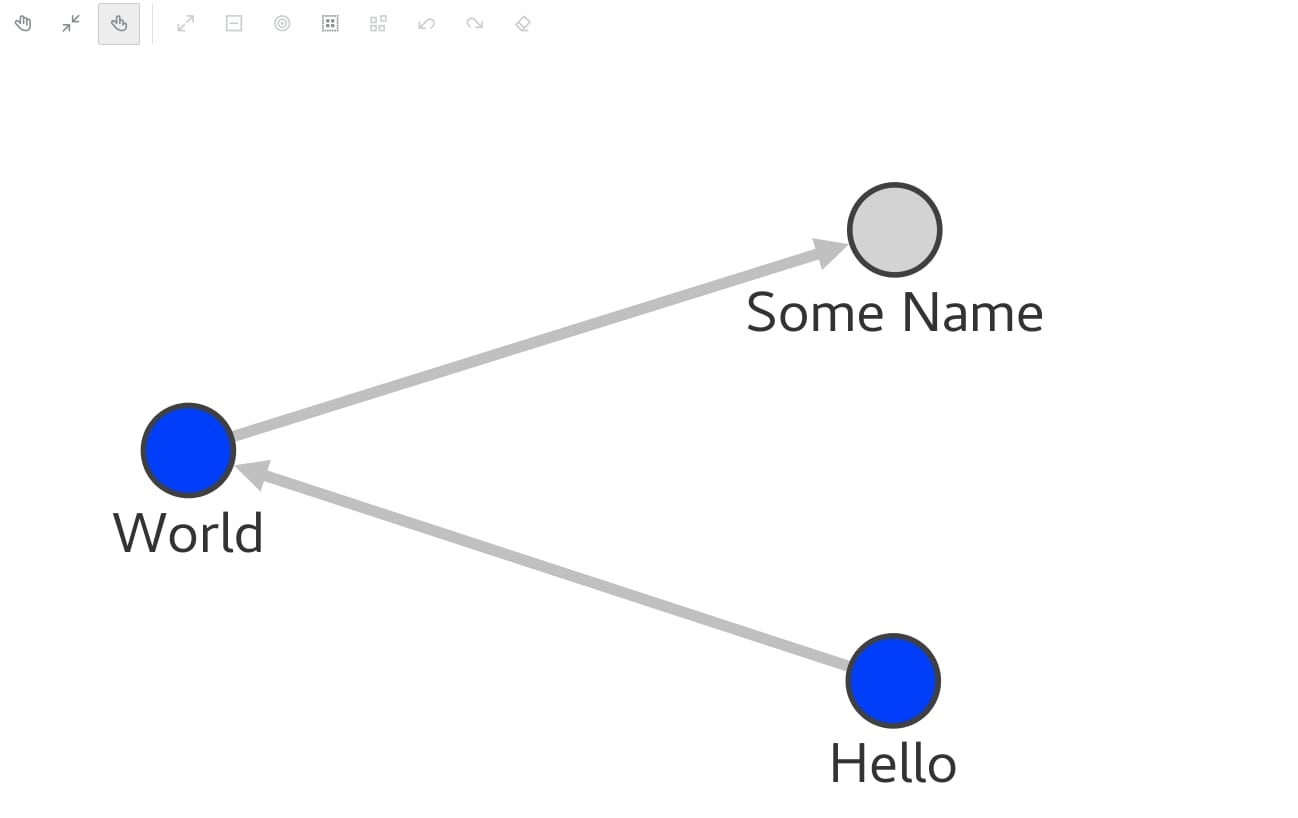
Example JavaScript usage (@gvt/graphviz also contains TypeScript definitions if you are using TypeScript).
 1
 2
 3
 4
 5
 6
 7
 8
 9
10
11
12
13
14
15
16
17
18
19
20
21
22
23
24
25
26
27
28
29
30
31
32
33
34
35
36
37
38
39
40
41
42
43
44
45
46
47
48
49
50
51
52
53 | // This import is not necessary if you are using Oracle JET.
import '@ovis/graph/alta.css';
import Visualization from '@gvt/graphviz';
const vertices = [
{
id: 1,
properties: {
label: 'blue',
name: 'Hello'
}
},
{
id: 2,
properties: {
label: 'blue',
name: 'World'
}
},
{
id: 3,
properties: {
name: 'Some Name'
}
}
];
const edges = [
{
id: 1,
source: 1,
target: 2
},
{
id: 2,
source: 2,
target: 3
}
];
const styles = {
vertex: {
label: '${properties.name}'
},
'vertex[properties.label === "blue"]': {
color: 'blue'
}
};
new GraphVisualization({
target: document.body,
props: { data: { vertices, edges }, styles }
});
|

@gvt/graphviz picks the icon library that you're using in your app, but it only supports
Font APEX and
Redwood. The example above is using Font
APEX library, to use Redwood icons you need to link the following stylesheet in your project
ojuxIconFont.css.


