3.1.2 Explore Data
Explore the data to understand and assess the quality of the data. At this stage assess the data to identify data types and noise in the data. Look for missing values and numeric outlier values.
Data Understanding and Preparation
This stage focuses on building a clear understanding of the dataset through the following steps:
Import necessary libraries: Load essential Python libraries along with Oracle Machine Learning (OML).Load the dataset: Import the dataset for initial exploration.Create a DataFrame proxy object: Represent the table using a proxy object to simplify data manipulation.Perform initial analysis: Examine the dataset's structure, including its shape, data types, missing values, and categorical feature cardinality.
These steps provide a solid foundation for deeper data exploration and preprocessing.
For data preparation and understanding run the following steps:
-
Import necessary libraries
Run the following script in a%pythoninterpreter paragraph to import theomlmodules, the Panda's module, and set the display options:import oml import ssl import pandas as pd import numpy as np import matplotlib.pyplot as plt import warnings warnings.simplefilter(action='ignore', category=FutureWarning) -
Load the dataset
url="https://objectstorage.us-ashburn-1.oraclecloud.com/n/adwc4pm/b/OML_Data/o/brooklyn_sales.csv"
ssl._create_default_https_context = ssl._create_unverified_context
brooklyn_sales = pd.read_csv(url, engine='python')
z.show(brooklyn_sales.head())
Figure 3-1 Raw Brooklyn Data

-
Replace missing values (NaN with None)
df = brooklyn_sales.apply(lambda x: x.replace(np.nan, None) if x.dtypes == 'object' else x) -
Impute missing values based on data type
First, the code removes any columns that are entirely empty or contain only missing values. Then, it goes through each remaining column, checks the data type of the non-missing values, and fills in any missing data with the most appropriate replacement based on the column's type.# Drop columns where all values are missing brooklyn_sales1 = brooklyn_sales.dropna(axis=1, how="all") d = {} # Iterate through each column and fill missing values based on its data type for col in brooklyn_sales1: x = brooklyn_sales1[col].dropna().tolist() # Get non-null values to check the column type if len(x) > 0: # For text columns, replace missing values with an empty string if isinstance(x[0], str): y = brooklyn_sales1[col].fillna("") # For integer columns, missing values are left unchanged elif isinstance(x[0], int): y = brooklyn_sales1[col] # For other numeric columns (e.g., floats), replace missing values with 0.0 else: y = brooklyn_sales1[col].fillna(float(0)) d[col] = y # Store the modified column # Convert the dictionary back into a DataFrame brooklyn_sales2 = pd.DataFrame.from_dict(d) # Print the shape of the updated DataFrame print(brooklyn_sales2.shape)(390883, 110) -
Create dataframe proxy object
try: oml.drop(table = 'BROOKLYN') except: pass # Create a persistent table named BROOKLYN in the Oracle database BROOKLYN = oml.create(brooklyn_sales2, table="BROOKLYN") -
Analyze the dataframe
Examine and interpret the shape, data types, missing values and find columns having low cardinality.- Shape of DataFrame:
BROOKLYN.shape(390883, 110) - Data Types of Columns:
BROOKLYN.dtypesID <class 'oml.core.integer.Integer'> borough <class 'oml.core.integer.Integer'> neighborhood <class 'oml.core.string.String'> building_class_category <class 'oml.core.string.String'> tax_class <class 'oml.core.string.String'> ... PFIRM15_FL <class 'oml.core.float.Float'> Version <class 'oml.core.string.String'> MAPPLUTO_F <class 'oml.core.float.Float'> SHAPE_Leng <class 'oml.core.float.Float'> SHAPE_Area <class 'oml.core.float.Float'> Length: 110, dtype: object - Identify columns with missing values (>75% ):
def percent_missing(dat):
    per_miss={}
    large_miss_columns=[]
    for i in dat.columns:
        l=len(dat)
        a=100-(dat[i].count()/l)*100
        if a>=75:
            per_miss[i]=round(a)
    return per_miss

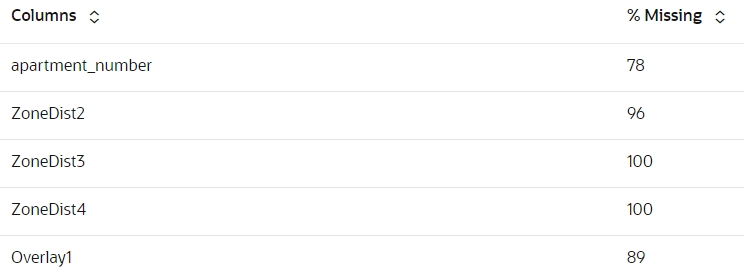
z.show(pd.DataFrame(list(percent_missing(BROOKLYN).items()), columns=["Columns", "% Missing"]))
Figure 3-2 View columns and their missing percentage.

- Identify columns with low cardinality:
def unique_values_less_10(data):
    cols=[]
    for x in data.columns:
        unique_values=data[x].nunique()
        if  unique_values< 10:
            cols.append(x)
    return cols

print(unique_values_less_10(BROOKLYN))
['borough', 'tax_class_at_sale', 'Borough', 'SanitBoro', 'ZoneDist4', 'Overlay1', 'Overlay2', 'SPDist2', 'SPDist3', 'LtdHeight', 'SplitZone', 'Easements', 'OwnerType', 'AreaSource', 'Ext', 'ProxCode', 'IrrLotCode', 'BsmtCode', 'BoroCode', 'CondoNo', 'ZMCode', 'PLUTOMapID', 'FIRM07_FLA', 'PFIRM15_FL', 'Version', 'MAPPLUTO_F']
- Shape of DataFrame:
- Data Preparation
Data preparation is the process of cleaning (handling missing values, outliers, and inconsistencies), transforming (scaling, encoding, and creating new features) and organizing raw data to make it more compatible with machine learning algorithms.
Parent topic: Regression Use case