6.2 View Data Monitor Results
The Data Monitor Results page displays the information on the selected data monitor that have run successfully, along with data drift details for each monitored feature.
- Settings — The Settings section displays the data monitor
settings. Click on the arrow against Settings to expand
this section. You have the option to edit the data monitor settings by clicking
Edit on the top right corner of the page. In this
screenshot, the settings for the data monitor Power
Consumption is seen.
Figure 6-10 Settings section on the Data Monitor Results page
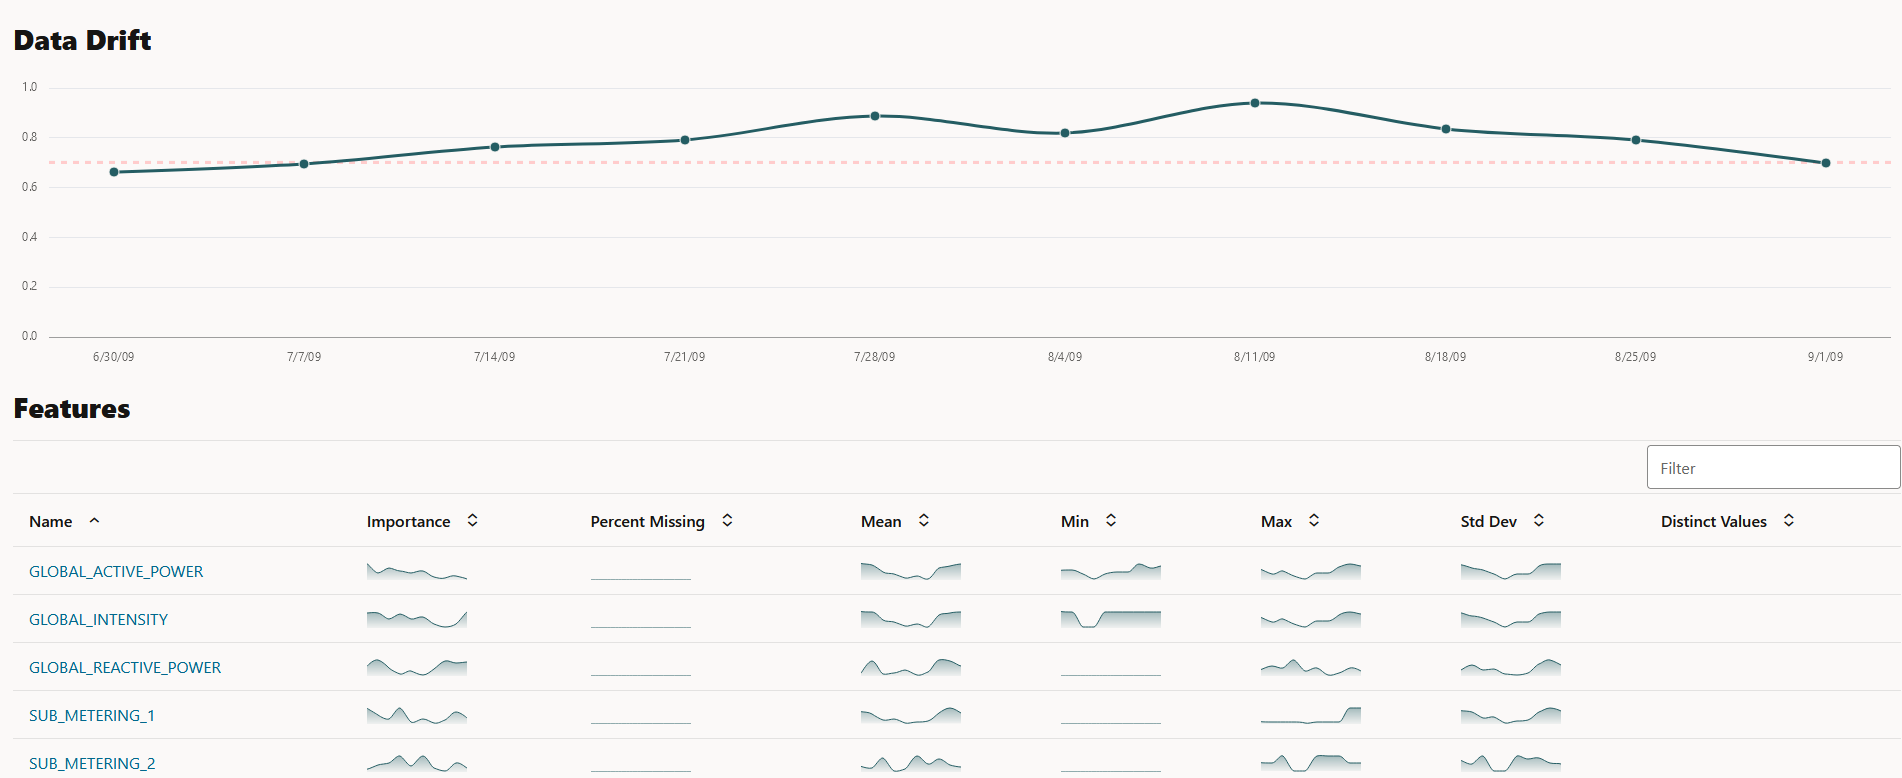
- Drift — The Drift section displays the details of data drift
for each monitored feature. In this example, the data monitor Power
consumption data monitor is selected. The X axis depicts the
analysis period, and the Y axis depicts the data drift values. The horizontal
dotted line is the threshold value, and the line depicts the drift value for
each point in time for the analysis period. Hover your mouse over the line to
view the drift values.
Figure 6-11 Data Drift section on the Data Monitor Results page
-
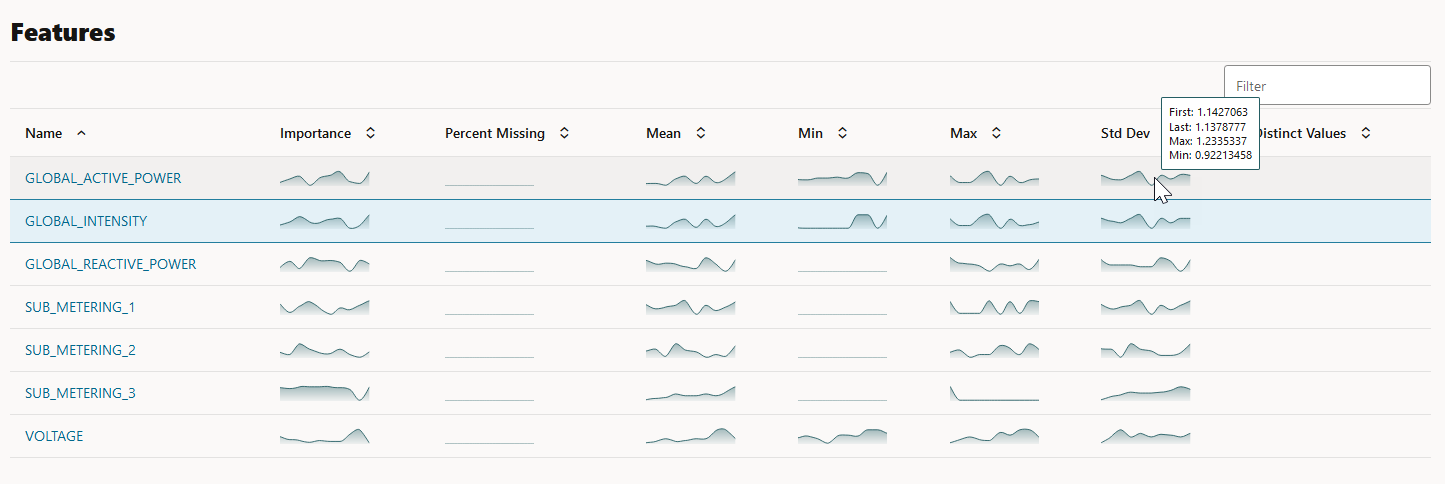
Features — The Features section displays the monitored features along with the computed statistics.
Figure 6-12 Features section on the Data Monitor Results page
The value in the Importance column indicates how impactful the feature has been on data drift over a specified time period.
For numerical data, the following statistics are computed:- Mean
- Standard Deviation
- Range (Minimum, Maximum)
- Number of nulls
For categorical data, the following statistics are computed:- Number of unique values
- Number of nulls
For each monitored feature, hover your mouse to view the following additional details, as shown in the screenshot here.
- First: This is the first value of the computed statistics for the analysis period.
- Last: This is the last value of the computed statistics for the analysis period.
- Max: This is the highest value of the computed statistics for the analysis period.
- Min: This is the lowest value of the computed statistics for the analysis period.
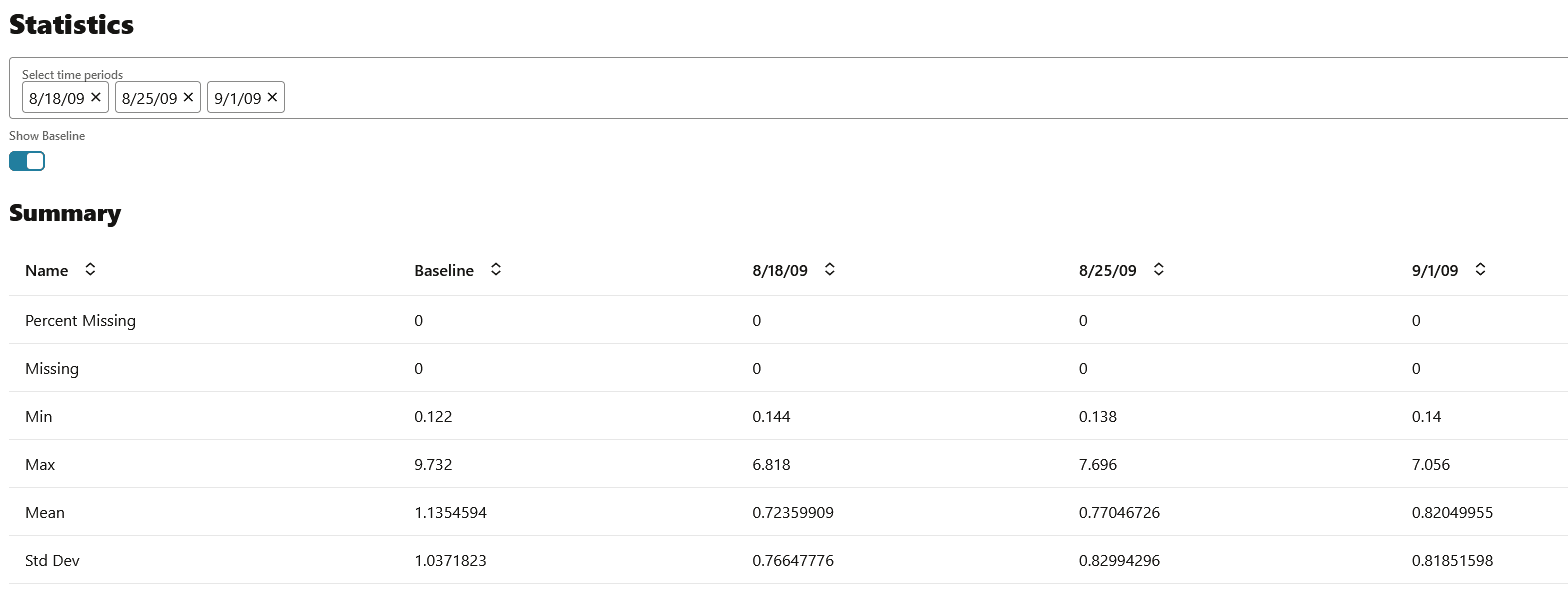
- Click on any monitored feature in the Features section to view the Metric, Statistics, Distribution, and Distribution with Crosstab Column, as shown in the screenshot here. In the screenshot here, the Population Stability Index is shown for the feature GLOBAL_REACTIVE_POWER.
The computations include:
- Metric: The following metrics are computed:
- Population Stability Index (PSI): This is a measure of how much a population has shifted over time or between two different samples of a population in a single number. The two distributions are binned into buckets, and PSI compares the percents of items in each of the buckets. PSI is computed as
The interpretation of PSI value is:PSI = sum((Actual_% - Expected_%) x ln (Actual_% / Expected_%))PSI < 0.1implies no significant population change0.1 <= PSI < 0.2implies moderate population changePSI >= 0.2implies significant population change
- Jenson Shannon Distance (JSD): This is a measure of the similarity between two probability distributions. JSD is the square root of the Jensen-Shannon Divergence which is related to the Kullbach-Leibler Divergence (KLD). JSD is computed as:
SD(P || Q)= sqrt(0.5 x KLD(P || M) + 0.5 x KLD(Q || M))Where, P and Q are the 2 distributions,
M = 0.5 x (P + Q), KLD(P || M) = sum(Pi x ln(Pi / Mi)), and KLD(Q || M) = sum(Qi x ln(Qi / Mi))The value of JSD ranges between 0 and 1.
- Crosstab Population Stability Index: This is the PSI for two variables.
- Crosstab Jenson Shannon Distance: This is the JSD for two variables.
- Population Stability Index (PSI): This is a measure of how much a population has shifted over time or between two different samples of a population in a single number. The two distributions are binned into buckets, and PSI compares the percents of items in each of the buckets. PSI is computed as
- Statistics: You can view statistics for up to 3 selected periods. Data drift is quantified using these statistical computations.
For numerical data, the following statistics are computed:
- Mean
- Standard Deviation
- Range (Minimum, Maximum)
- Number of nulls
For categorical data, the following statistics are computed:- Number of unique values
- Number of nulls
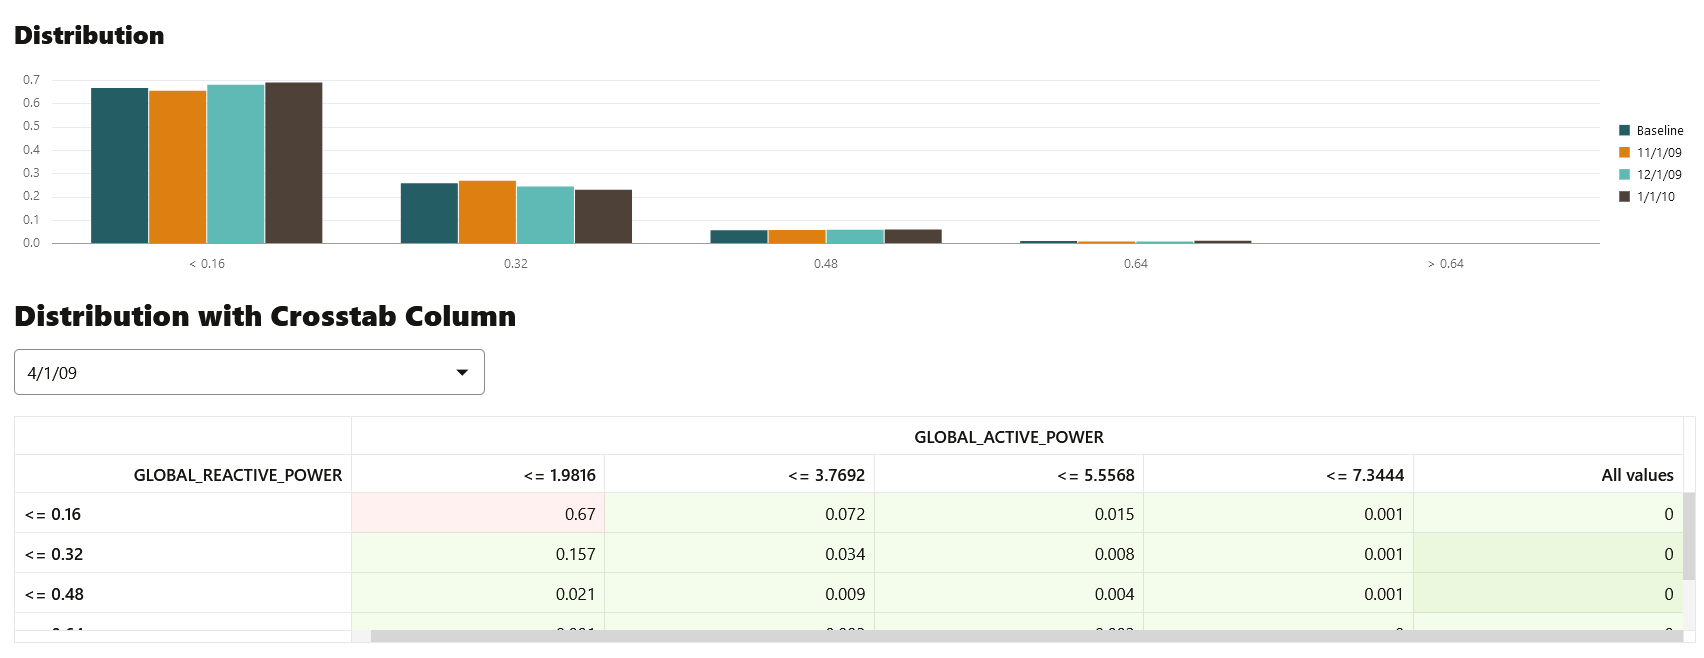
- Distribution: The feature distribution chart with legend displays bins of feature for selected periods and the baseline (optional).
Figure 6-15 Distribution Chart and Distribution with Crosstab column
- Distribution with Crosstab Column: The heat map indicates the density of distribution for the selected crosstab and the feature column. Red denotes highest density.
Note:
In data drift monitoring,nullsare are tracked separately asnumber_of_missing_values.
- Metric: The following metrics are computed:
Parent topic: Data Monitoring


