6.1 Create a Data Monitor
Data Monitoring allows you to detect data drift over time and the potentially negative impact on the performance of your machine learning models. On the Data Monitor page, you can create, run, and track data monitors and the results.
To create a data monitor:
- On the Oracle Machine Learning UI left navigation menu, expand Monitoring and then click Data to open the Data Monitoring page.
- On the Data Monitoring page, click Create to open the New Data Monitor page.
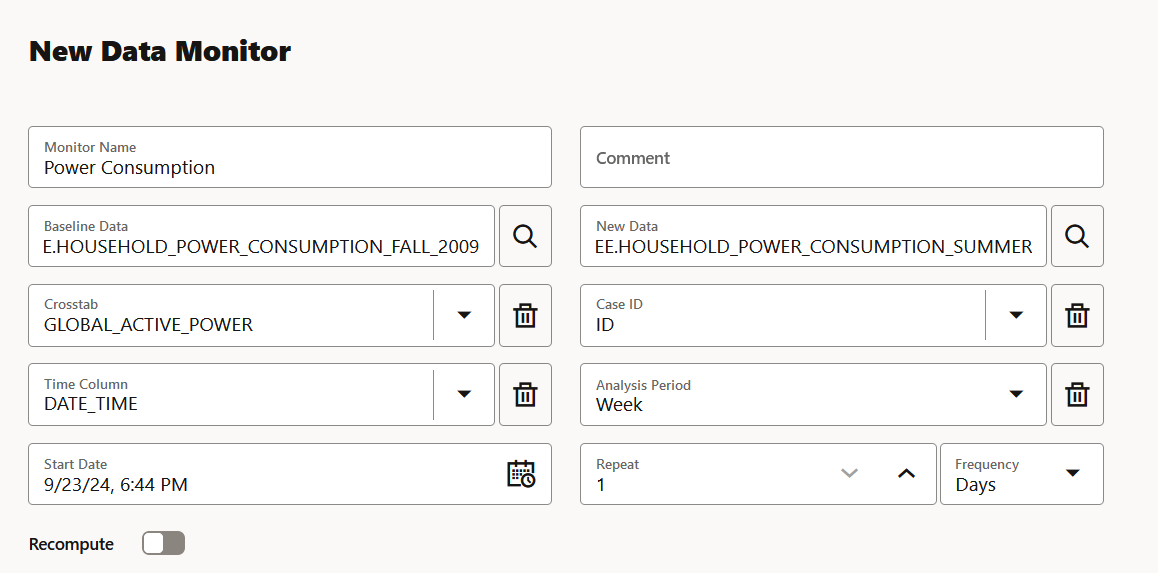
- On the New Data Monitor page, enter the following details:
- Monitor Name: Enter a name for the data monitor.
- Comments: Enter comments. This is an optional field.
- Baseline Data: This is a table or view that contains baseline data to monitor. Click the search icon to open the Select Table dialog. Here, select a schema, and then a table.
Note:
The supported data types for data monitoring areNUMBER, BINARY_DOUBLE, FLOAT, BINARY_FLOAT, VARCHAR2, CHAR, NCHAR,andNVARCHAR2with length<=4000. - New Data: This is a table or view with new data to be compared against the baseline data. Click the search icon to open the Select Table dialog. Select a schema, and then a table.
Note:
The supported data types for data monitoring areNUMBER, BINARY_DOUBLE, FLOAT, BINARY_FLOAT, VARCHAR2, CHAR, NCHAR,andNVARCHAR2with length<=4000. - Crosstab: Select an attribute from the drop-down
list. This attribute in the baseline and new data acts as an anchor or
target for bi-variate analysis of your data.
Note:
The target column in supervised problems can be passed as an anchor column in this field. For unsupervised problems, it can be any column of interest. However, it will be application specific. - Case ID: This is an optional field. Enter a case identifier for the baseline and new data to improve the repeatability of the results.
- Time Column: This is the name of a column storing time information in the New Data table or view. Select the time column from the drop-down list.
Note:
If the Time Column is blank, the entire New Data is treated as one period. - Analysis Period: This is the length of time for which data monitoring is performed on the New Data. Select the analysis period for data monitoring. The options are
Day,Week,Month,Year. - Start Date: This is the start date of your data monitor schedule. If you do not provide a start date, the current date will be used as the start date.
- Repeat: This value defines the number of times the data monitor run will be repeated for the frequency defined. Enter a number between 1 and 99. For example, if you enter
2in the Repeat field here, andMinutesin the Frequency field, then the data monitor will run every 2 minutes. - Frequency: This value determines how frequently the data monitor run will be performed on the New Data. Select a frequency for data monitoring. The options are Minutes, Hours, Days, Weeks, Months. For example, if you select
Minutesin the Frequency field,2in the Repeat field, and5/30/23in the Start Date field, then as per the schedule, the data monitor will run from 5/30/23 every 2 minutes.
- Click Recompute: Select this option to recompute the analysis for the already computed time period. By default, Recompute is disabled.
- When enabled, the data drift analysis is performed for the time period specified in the Start Date field and the end time. The analysis will overwrite the already existing results for the specified time period. This means that the analysis will be computed for the time period with new data other than the current data. New analysis results may overlap with the existing results depending on the selected frequency.
- When disabled, the data for the time period that is present in the results table will be retained as is. Only the new data for the most recent time period will be considered for analysis, and the results will be added to the results table.
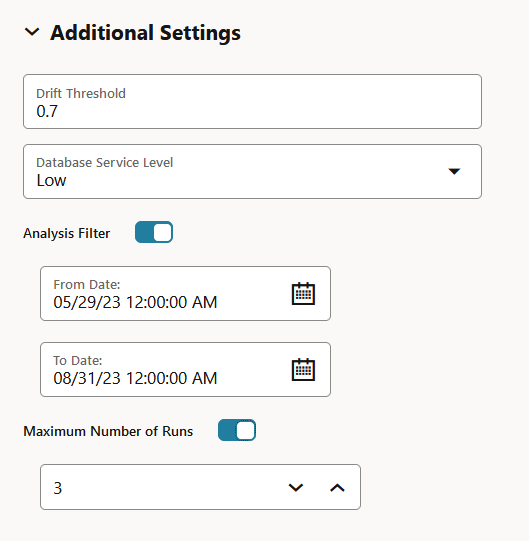
- Click Additional Settings to expand this section and provide advanced settings for your data monitor:
Figure 6-8 Data Monitoring Additional Settings
- Drift Threshold: Drift captures the relative change in performance between the baseline data and the new data period. Based on your specific machine learning problem, set the threshold value for your data drift detection. The default is
0.7.Note:
You may adjust the threshold value depending on your use case. Increasing the value will generate fewer alerts, while decreasing the value will generate more alerts.- A drift above this threshold indicates a significant change in your data. Exceeding the threshold indicates that rebuilding and redeploying your model may be necessary.
- A drift below this threshold indicates that there are insufficient changes in the data to warrant further investigation or action.
- Database Service Level: This is the Autonomous AI Database service levels -
Low,Medium,HighandGPU. The default isLow.- Service level
Mediumprovides more resources to the data monitor run compared toLow. - Service level
Highprovides more resources to the data monitor run compared toMedium.
- Service level
- Analysis Filter: Enable this option if you want the data monitoring analysis for a specific time period. Move the slider to the right to enable it, and then select a date in From Date and To Date fields respectively. By default, this field is disabled.
- From Date: This is the start date or timestamp of monitoring in New Data. It assumes the existence of a time column in the table. This is a mandatory field if you use the Analysis Filter option.
- To Date: This is the end date or timestamp of monitoring in the New Data. It assumes the existence of a time column in the table. This is a mandatory field if you use the Analysis Filter option.
- Maximum Number of Runs: This is the maximum number of times the data monitor can be run according to this schedule. The default is
3.
- Drift Threshold: Drift captures the relative change in performance between the baseline data and the new data period. Based on your specific machine learning problem, set the threshold value for your data drift detection. The default is
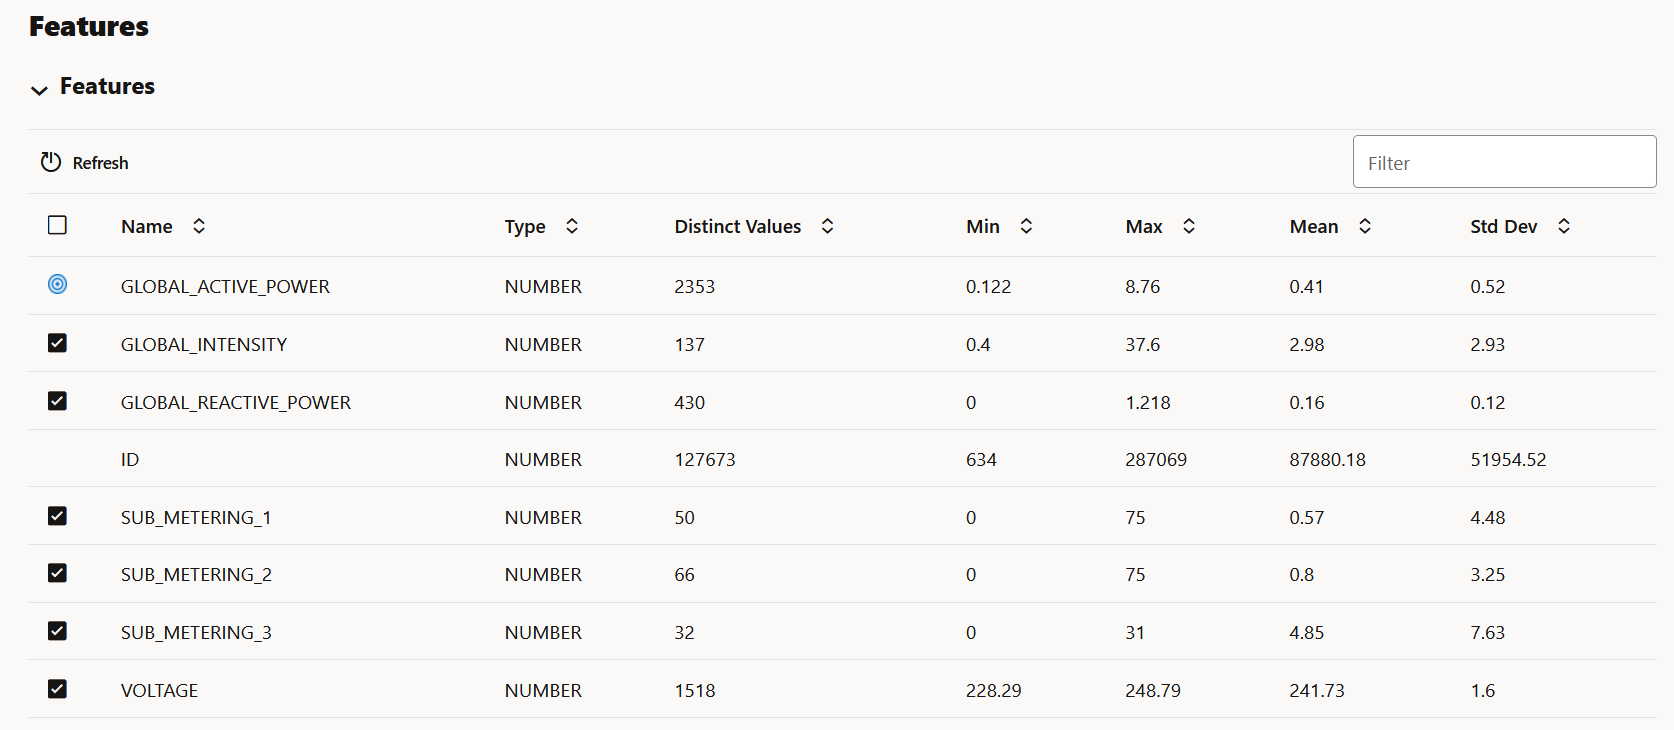
- The Features grid displays the list of features to monitor. Here, you can
select or deselect features to include or exclude from monitoring. By default,
all features are selected. Feature statistics are provided if the selected data
is a table and has RDBMS statistics automatically gathered by Autonomous AI Database. Oracle Machine Learning Services calculates the statistics on the first run for both, tables and
views, and the computations are displayed here after the first run. The
statistics are updated by subsequent runs.
Note:
The Case ID and Cross-Tab columns cannot be selected. - Click Save. This completes the task of creating your data monitor.
Note:
You must now go to the Data Monitoring page, select the data monitor and click Start to begin data monitoring.After the data monitor runs successfully, select the monitor on the Data Monitoring page to view the data drift and other details of the data monitor. See Data Monitoring for more information.
Parent topic: Data Monitoring


