Adding Matrix Columns to Reports
In the footer of most summary reports, there's a Column dropdown list that lets you turn a standard report into a matrix or crosstab report. A matrix report has a variable number of columns depending on your selection in the Column dropdown list.
For financial statements, use the Financial Report Builder to edit columns. See Financial Report Builder Edit Columns Page.
For example, an accountant views the Income Statement for the second quarter of the fiscal year.
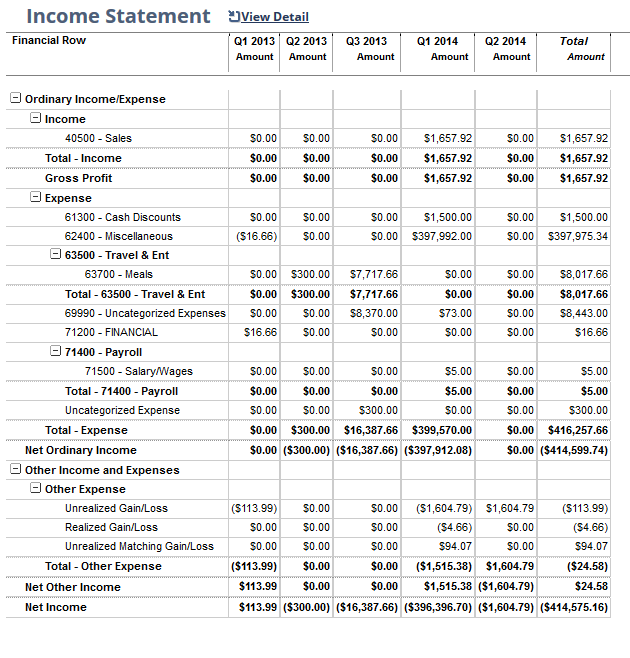
The accountant then selects Accounting Period in the Column field. The result is a report displaying columns for each accounting period in the quarter. The options in the Column field may vary depending on the report you're viewing and the features you have enabled.
If the dimension you select adds too many columns, the report might not load. For tips to avoid this, see Tips for Adding Matrix Columns to a Report.
To add matrix columns to a report:
-
On the Reports page, click the name of the summary report you want to view.
-
In the footer of the report, select an option, other than Total, from the Column dropdown list.
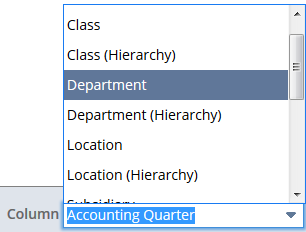
The matrix is based on what you choose in this dropdown list. The data can be displayed in separate columns for each dimension value, or hierarchically, with child values grouped under parent values in the same columns. To display data hierarchically, select a (Hierarchy) option.
-
Click Refresh.
You can create a new matrix report by going to Reports > New Report. See Creating a New Report. For financial statements, you can select a persistent matrix column in the View Columns By dropdown list on the Financial Report Builder Edit Columns Page.