Filter Your Dataset
If you haven't already, complete Step Two: Add Fields and Join Record Types.
The following steps show you how to filter your dataset query results. Any criteria filters you add are automatically applied to both new and existing workbook visualizations based on this dataset. For example, if you set a filter to exclude sales orders created in the last week, data from those orders won't show in any workbook visualizations, old or new, that use this dataset.
To filter your dataset:
-
On the Dataset Builder, drag a record field or formula field from the Fields list to the Criteria Builder above the Data Grid.
(Optional) If the field you want to use is already in the Data Grid, drag the field header from the grid to the Criteria Builder.
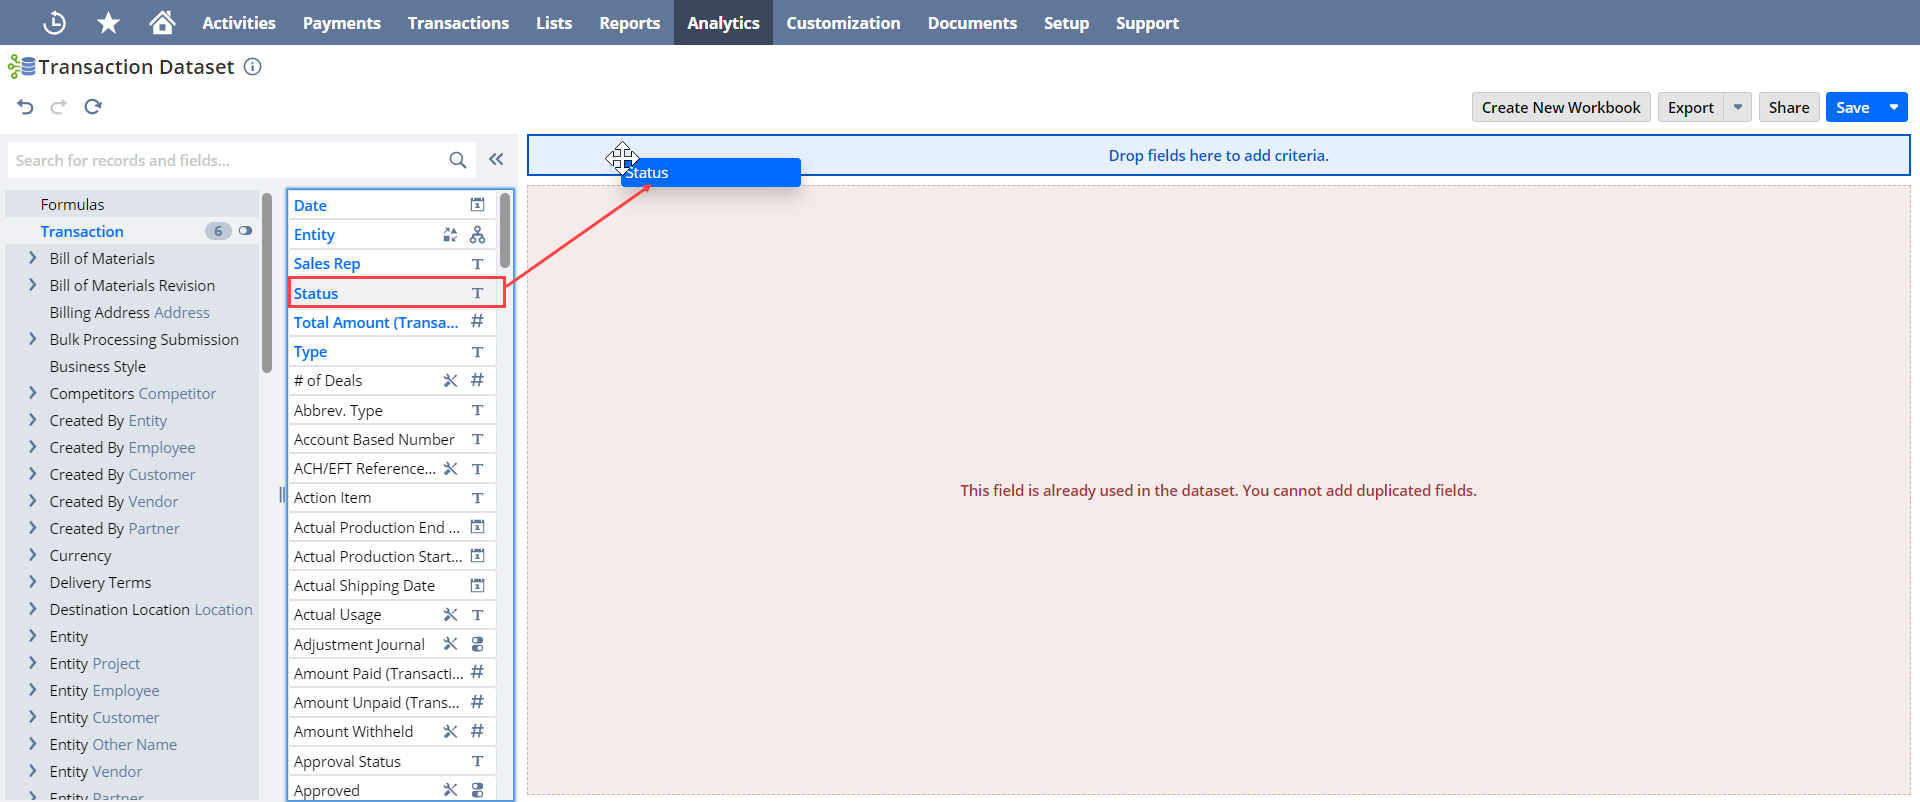
The Filter window appears.
-
In the Filter window, pick the filter conditions you want to apply. You can get up to four filtering options, depending on the field type:
-
Values: Existing values or dates from the source data, or custom values
-
Ranges/Date Ranges: Range of values or dates available in the source data
-
Relative Conditions/Relative Dates: Conditions relative to the existing values in the source data
-
Conditions/Specific Dates: Specific value or date and an expression
For the purposes of this tutorial, no filter conditions are required.
Note:If you want to group filter conditions, click New Group. Grouped filters count as one item and are checked in the order they appear in the Criteria Builder. For more information, see Grouping Filters.
-
-
Repeat steps 1-2 for each filter you want to define.
By default, filters are added using an AND operator. To change the relationship between filters and filter groups, click AND and select OR from the popup window.
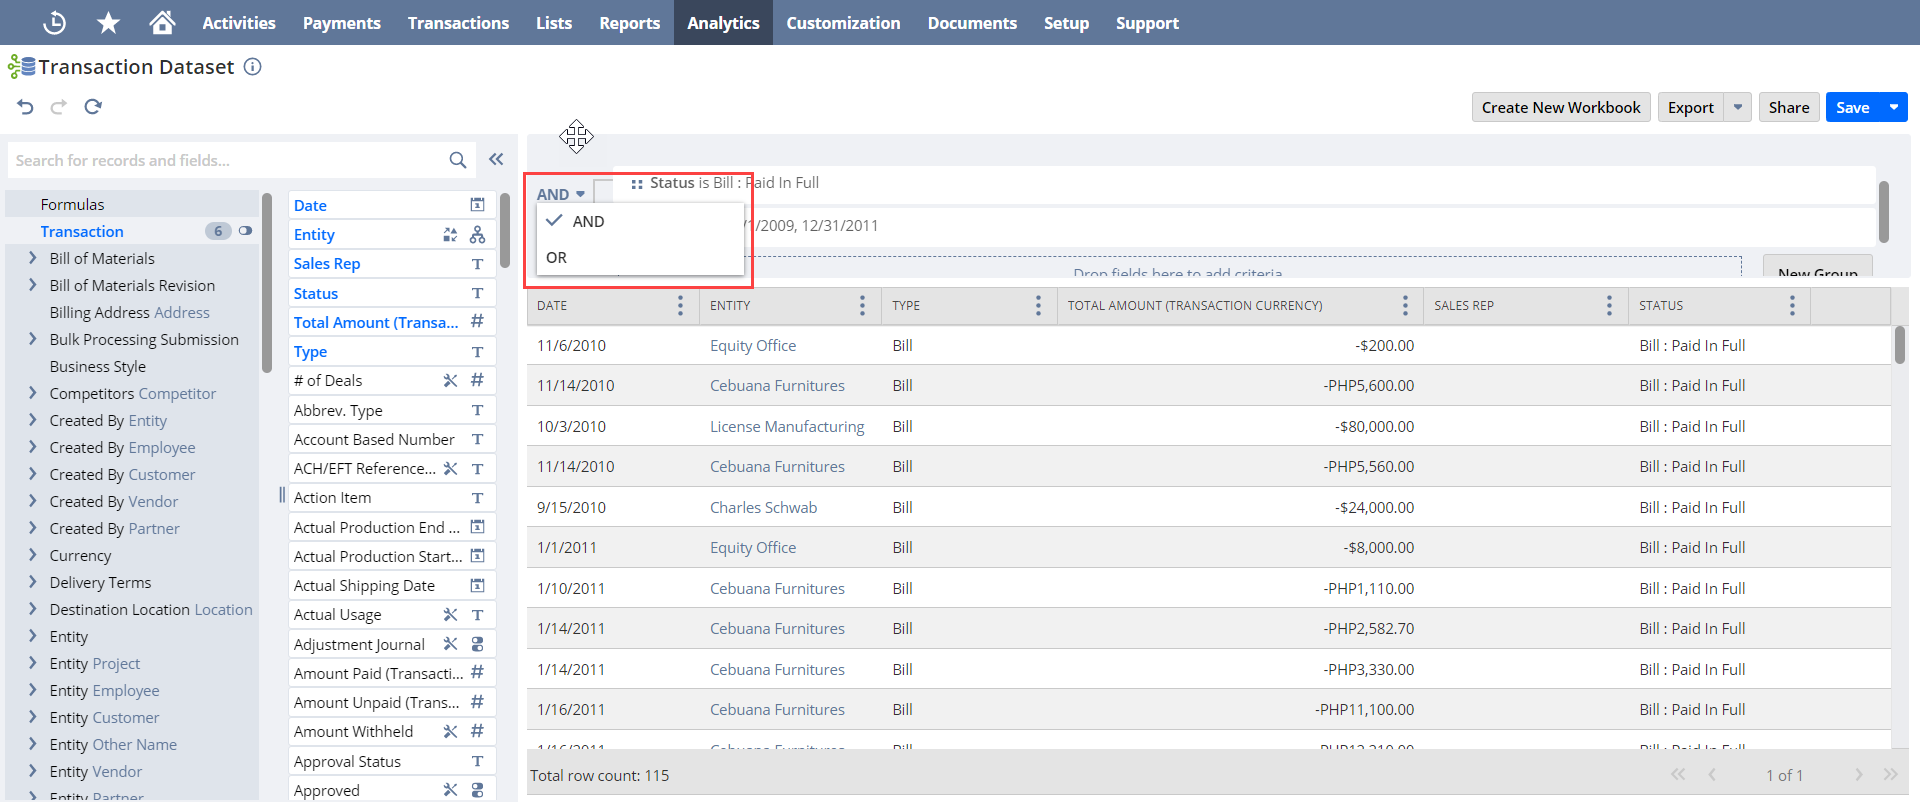
-
After you set each filter, the Data Grid updates to show only data that matches your criteria, and a summary appears above the grid.
Important:If you want to convert field values in multiple currencies, do it within a workbook visualization or by using a custom formula field with the TO_NUMBER function. For more information, see Currency in Datasets and Workbooks.
-
Click Save.
The Save Dataset As window appears.
-
Enter a name and description for the dataset in the fields provided.
-
Click Save.
Continue to Step Four: Create a Workbook Based on Your Dataset.