Working with Calculated Measures
Before you create a calculated measure, you should think about the fields and operators you want to include. To learn about the type of fields and basic operators that you can use in your calculations, see Supported Calculations.
You can define your calculated measure using fields from the dataset connected to your workbook visualization. In visualizations based on linked datasets, this means you can use any combination of fields from either dataset. If you don't see the fields you want to use, edit the connected datasets or contact the dataset owner if you're not the original author. For more information, see Editing a Dataset.
After you've created a calculated measure, you can use it to sort and filter your results. Calculated measures support all sorting and filtering options available for base measures. You can also change the format of a calculated measure's numbers, add totals and grand totals, and apply conditional formatting. For more information about these options, see Workbook Visualization Filters, Pivot Table Customization, and Conditional Formatting.
To open the calculated measure editor, click Create Calculated Measure in the Layout panel of any pivot table or chart. You can create as many calculated measures as you need, but you can only use them in the workbook visualization where you made them. If you want to use the same calculated measure in other visualizations, copy and paste the measure definition.
To learn how to work with calculated measures, see the following:
Creating Calculated Measures
When you create a calculated measure, you define the fields and basic operators for your calculation. All calculated measures need a name and a valid definition. As you create your calculated measure, a message at the bottom of the editor tells you if the definition is valid. If the definition isn't valid, an error icon appears next to the line with validation errors. Hover over the icon to see how to fix it.
After you create your measure, you can edit or delete it from the Layout panel of the chart or pivot table.
To create a calculated measure:
-
On a pivot table or chart, click Create Calculated Measure from the Layout panel. Alternatively, from within a pivot table, click the Field Menu icon
 next to the field that you want to use in your calculated measure and select Create Calculated Measure.
The calculated measure editor appears with instructions on how to set up your calculations.
-
In the Name field, enter the name of your calculated measure.
-
Add fields to the editor:
-
Drag fields from the Dataset Panel to the Definition field. In visualizations based on linked datasets, you can switch between the fields within each dataset by clicking the dataset name.
-
In the Definition field, start typing the field names.
Fields you use in your calculated measure are highlighted in blue in the Dataset panel.
-
-
Add calculation operators:
-
In the Definition field, type a basic operator such as plus (+), minus (-), multiplied by (*), divided by (/), or parenthesis ().
-
Press Ctrl + Space to display all options and select an operator.
-
-
(Optional) To make changes to one of the fields used in the definition, click the Field Menu icon
 . The following options appear:
-
If you want to change the aggregate function of the field, select a different function from the list.
-
If you are working with fields that have values in multiple currencies, select Currency... to view the consolidation and conversion options. For more information, see Currency Conversion in Workbook.
-
-
(Optional) To remove a field from the definition, place the cursor next to the field and press Backspace, or click the Field Menu icon and select Remove.
-
Click Apply to add the calculated measure to your pivot table or chart.
Your calculated measure appears in the list of measures in the Layout panel with a Calculator icon
 .
. -
On your pivot table or chart, click the Refresh icon
 to see the results of the calculated measure in the viewer.
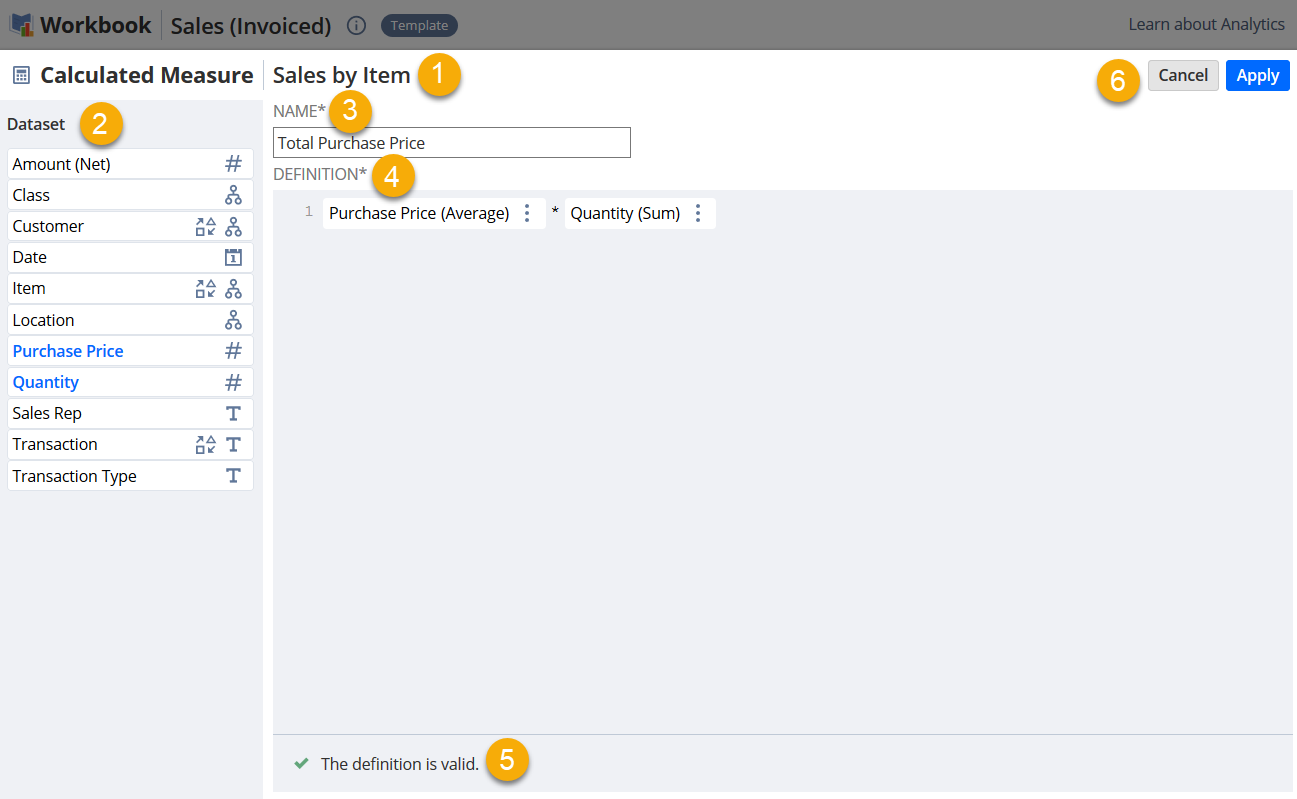
Calculated Measure Editor
The Calculated Measure editor is where you set up new calculated measures.
The elements of the editor are identified in the image below:

|
1 |
Workbook Visualization Name - Displays the name of the visualization where you're creating the calculated measure. |
|
2 |
Dataset Panel - Contains all fields from the connected dataset. In visualizations using linked datasets, both are shown so you can switch between them. To see more info about a field, hover over it and click the Information icon |
|
3 |
Calculated Measure Name - Enter the name of your calculated measure. |
|
4 |
Definition Editor - Create your calculations using fields in the Dataset Panel and basic operators. To create your calculations, you can do the following:
|
|
5 |
Validation Message - Displays a message that tells you if the definition is valid or has errors. If it's not valid, you'll see an error icon next to the line with issues. Hover over it to see how to fix the definition. |
|
6 |
Editor Menu - You can do the following:
|