Creating and Editing Reports in the Report Editor
The report editor lets you create, edit, test, and run reports from a single page, without the need to switch between forms and previews or to refresh the page.
To access the report editor, go to Reports > Management, search for saved report or report template, then do one of the following:
-
Click the edit icon
 under the name of the report in the results panel.
 -
Click New in the preview panel (to create a new report from a report template).
-
Click Edit in the preview panel (to modify a saved report).

The report editor includes the following elements:
-
Report header - The report header shows the report name and the template the report is based on. The report also lets you enter a new name for the report, select a different report template to create a new report, and save or discard the changes made.
-
To change the report name, click the report name and enter a new name. The default name for a new report is "Untitled".
-
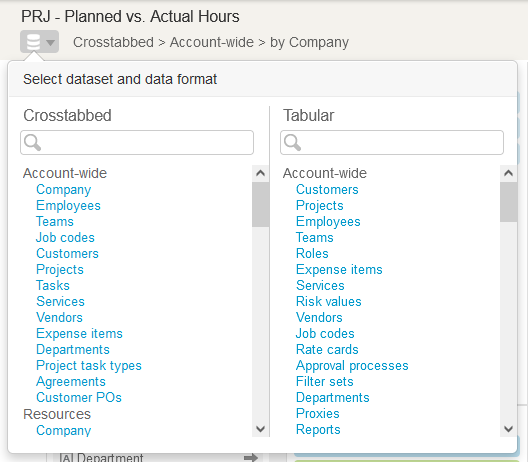
To create a new report from a different report template, click the dataset icon
 and select the report template.
-
The report header for tabular (detail) reports include a Rollup box. Check the Rollup box to add the ability to aggregate and drill down your report data to different levels defined by non-measurable attributes in your report layout.
-
To save changes made to your report, click Save, to clear the report configuration and revert to the default template report configuration, click Reset, to discard unsaved changes and go back to the report management interface.
-
-
Report configuration pane - The report configuration pane includes three vertical subtabs.
-
Rows and Columns - The Rows and Columns subtab shows the information currently included in the report layout. For roll-up tabular reports and crosstabbed reports, it includes three panes, with lists of rows, columns and measure names in the report. For standard tabular reports, it includes the Rows pane only. The Rows and Columns subtab includes the following functionality:
-
Dimensions (non-measurable attributes or aggregation levels) and dates show with a light blue color background. Measures (aggregated values) show with a green color background.
-
Drag a row, column or measure to change the order of rows, columns or measures in the report.
-
Click the remove icon
 to remove the row, column or measure from the report.
 -
Click the visible icon
 to show or hide a row or a column. The icon shows in dark gray color when the row or column is visible on the report, and in light gray color when the row or column is hidden.
 -
Click the total icon
 to show or hide total columns for all measures. The icon shows in dark gray color when the total columns are visible on the report, and in light gray color when the total columns are hidden.
 -
Click the filter icon
 to add or modify a filter based on the row or column. The icon shows in dark gray color when there is an active filter, and in light gray color when there are no active filters.
 -
Click the add icon
 to add an entity attribute or dimension to the report.
 -
Click the edit icon
 to modify the list of entity attributes or dimensions included on the report.
-
-
Datasets The Datasets subtab shows the information that you can include in the report layout. For roll-up tabular reports and crosstabbed reports, it includes two panes, with lists of dimensions (aggregation levels defined by non-measurable attributes) and measures (aggregated values). For standard tabular reports, it includes the Attributes pane only. The Datasets subtab includes the following functionality:
-
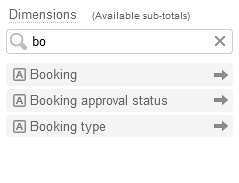
Enter a few characters into the search bar to filter the list of attributes, dimensions, or measures as you type.

-
Icons indicate the dimension or measure type:
-
Dimensions:
 (Text) or
  (Hierarchy).
 -
Measures:
 (Count or Total),
  (Time - Calculated from the number of days),
  (Time - Calculated from the number of hours), or
  (Custom calculation).
-
-
Point to an attribute, a dimension, or a measure to view a tooltip description.
-
Click an attribute, a dimension, or a measure to add it to your report. You can also drag it to the Rows, Columns or Measures panel. The cursor changes to indicate valid or invalid drop locations.
-
-
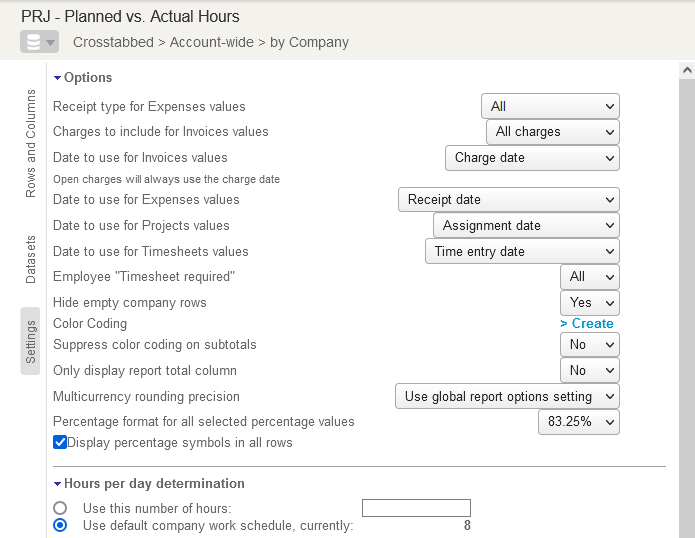
Settings - The Settings subtab shows a form with other report configuration settings.

Note:You can use the Rows and Columns and Datasets subtabs side by side in the configuration pane to add attributes, dimensions and measures to your report. However, the Settings subtab cannot be shown alongside another subtab.
-
-
Report View or Preview pane - Preview your report layout without data as you change the configuration. Click Preview to test your report with sample data limited to one record, click Run to run the full report.
-
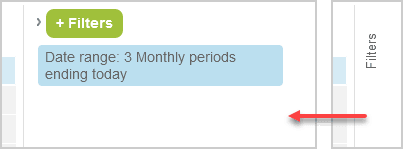
Filters pane - The filters pane lets you review and modify existing filters, or add new filters to include only the information you want to report on.
Click + Filters to add a new filter, or click a filter to modify it. A window appears to let you define the filter or select the values you want to include or exclude.
The filters pane can be minimized. Click the arrow pointing right to minimize the filters pane, or click Filters to view the filters pane.
