Getting Started with the Next-Generation Homepage and Dashboards
Depending on your company's account configuration, you may have access to the next-generation homepage or dashboards. You can personalize your homepage and dashboards to show lists, reports and charts with the information that is relevant to you.
For both homepage and dashboards, depending on your access profile, the next-generation version may be available in addition to the classic version. There are two Home or Dashboard items in the main navigation menu:
-
Home - Classic homepage.
-
Home (new) - Next-generation homepage.
-
Dashboard - Classic dashboards.
-
Dashboard (new) - Next-generation dashboard.
Account administrators control who can view the classic version by role permission when the next-generation version is enabled.
The to-do list introduced in SuiteProjects Pro 2024.2 includes all workflow tasks from the Reminders portlet in the classic homepage, and some workflow tasks from the My status portlet. Workflow tasks in the My status portlet for which you cannot take direct action are not included in the to-do list. For more information about the to-do list, see To-do list.
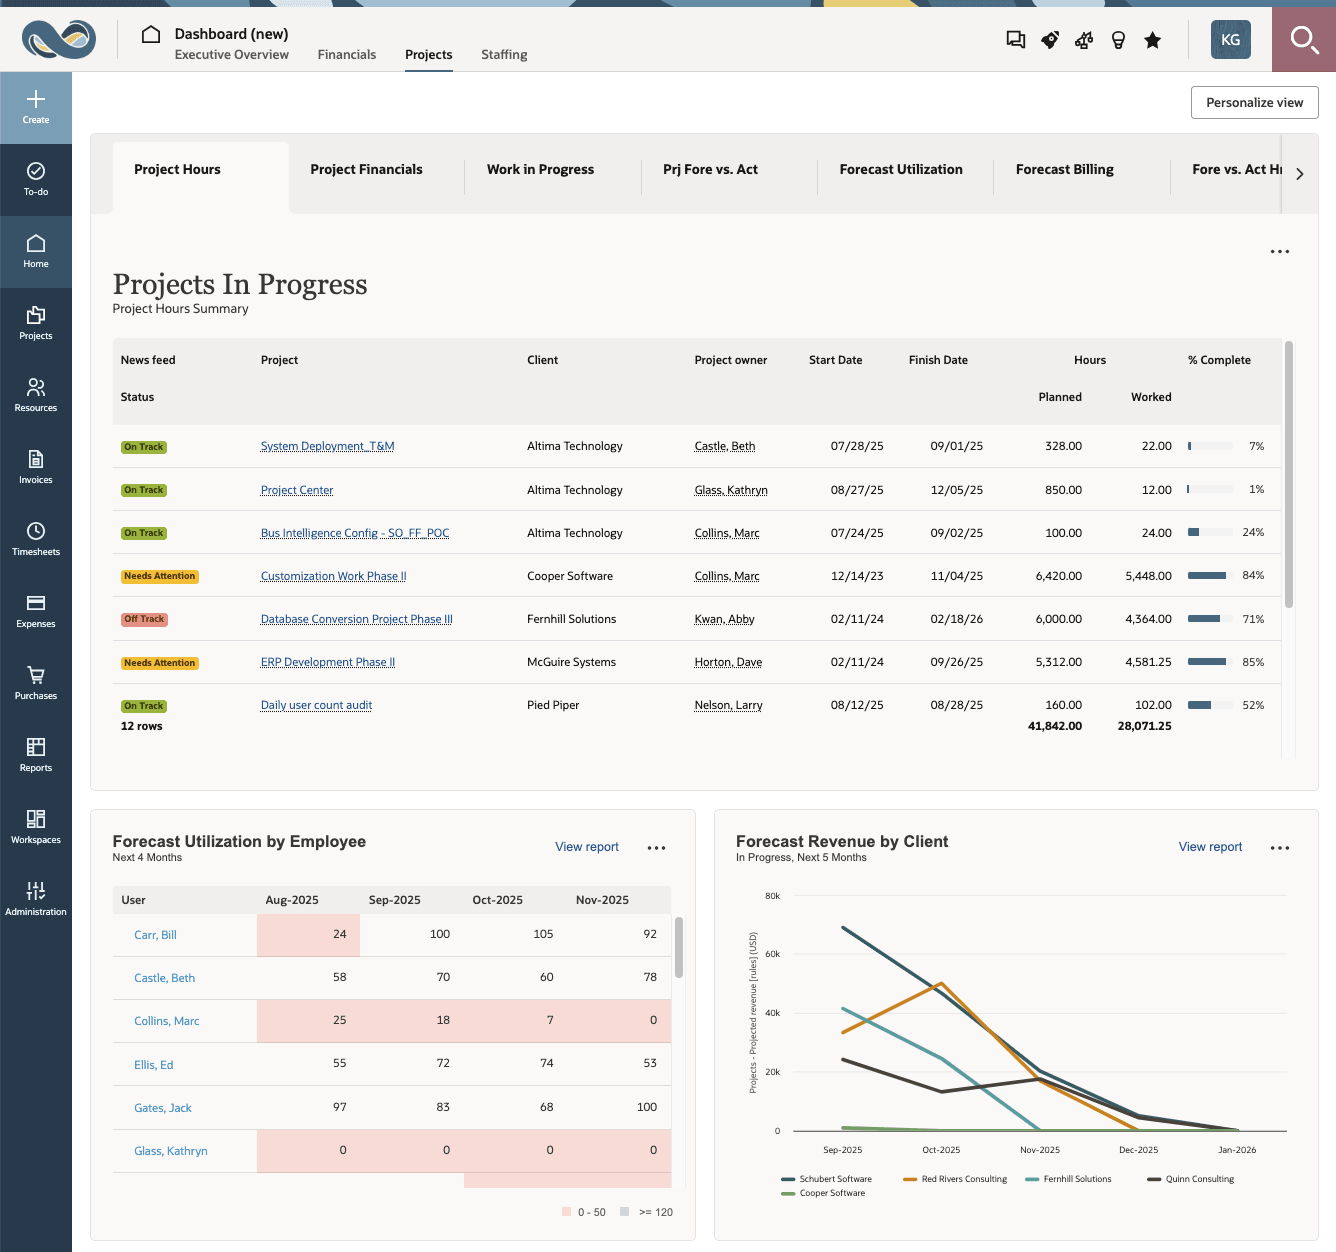
The next-generation homepage and dashboards offer similar layout and functionality. You can show up multiple sections of information across one multitab primary content region and two or three secondary content regions in the next-generation homepage and in each dashboard. The following table describes the different elements of the homepage and dashboards layout, and highlights the differences between the two features.
|
Element |
Homepage |
Dashboards |
|---|---|---|
|
Tabs |
No tabs. |
You can have multiple dashboards, with each dashboard in a separate tab. Use the Create button to add a new dashboard. See Adding a New Dashboard. Reorder dashboard as needed. See Personalizing your Homepage or Dashboard. Move between the different dashboards using tabs in the page header. |
|
Primary content region |
One primary content region always visible at the top of your canvas with up to 10 separate tabs. Move between tabs to explore different sections of information. If there are more tabs than can be shown, use the arrows on each end of the tab bar to view other tabs to the left or to the right. Tab titles with ellipses at the end indicate that the title is truncated. Point to the tab title to view the full title. |
|
|
Occupies either a larger area in the top-left corner, or the full-width of your canvas, depending on the available canvas width. |
Occupies the full-width at the top of your canvas. |
|
|
Secondary content regions |
Two secondary content region always visible with one section of information each. Occupy a smaller area to the right or below the primary content region, depending on the width of the available canvas width. |
Up to three secondary content regions with up to two sections of information each. Occupy the full-width of your canvas as successive rows of content under the primary content region. Each secondary region shows either one full-width or two half-width sections of information, depending on the number of sections of information you add in the content region. A secondary section is not shown if it contains no sections of information. |
You can personalize your homepage or dashboards, and add, reorganize and change the content in each region to suit your own business needs. See Personalizing your Homepage or Dashboard, Editing a Content Region and Setting up a content item.
Currently the next-generation homepage and dashboards support three types of content:
-
List - You can show the most important information from a list on your homepage or dashboard.
-
Homepage or dashboard lists have the following differences with full-page list views:
-
The list toolbar, page navigation and bulk action columns are not shown for lists in the homepage or dashboard.
-
Lists in the homepage or dashboard include the Actions column. You can use an action to run reports from a report list in the homepage or dashboard, for example.
-
Lists in the homepage or dashboard use a different visual style (background color for headers, font and font size, no line separators between columns).
-
Each list in the homepage or dashboard is limited to one page of list data. You can control the maximum number of rows shown when setting up the list for your homepage or dashboard, or modifying the setup. The total row is always visible at the bottom of the list portlet and shows the number of rows visible in the list portlet and if there are the number of rows in the full-page list.
-
Lists in the homepage or dashboard do not support inline-editing even if the full-page lists for the same object type supports inline-editing.
-
Changes to the full-page list view setup do not impact the homepage or dashboard list. If you save changes to the list layout or list filter selected in the homepage or dashboard list setup are reflected in your homepage or dashboard.
-
-
Click the more icon
 in the upper-right corner of the content area and select:
-
Collapse all to collapse all collapsible rows in the list.
-
Expand all to expand all collapsible rows in the list.
-
Set up list portlet to set up the homepage or dashboard list.
-
-
-
Report - You can show data from one of your reports in your homepage or dashboard.
-
All your saved tabular (detail) and crosstabbed (summary) reports are available. Selected advanced reports are also available - See .
-
A report runs automatically when you go to your homepage if the report did not run in the last 12 (or 24 hours ago, depending on your account configuration). The report also runs automatically whenever you change and save the report portlet setup.
-
Reports in the homepage or dashboard use a different visual style (background color for headers, font and font size, no line separators between columns).
-
If the full report uses color-coding, the color-coding legend is included in the bottom-right corner of the content area.
-
Click a column header to sort the report data in ascending order of that column, click it again to change the sort order. Ascending sort order is indicated by an arrow pointing up, descending sort order is indicated by an arrow pointing down.
-
Click View report to go to the full report in the Reports application. In the full report page, you can use a back navigation link to go back to the homepage or dashboard.
-
Click the more icon
in the upper-right corner of the content area and select:-
Clear sort to revert to the default sort order.
-
Collapse all to collapse all collapsible rows in the report.
-
Expand all to expand all collapsible rows in the report.
-
Refresh to run the report and refresh the report data.
-
Set up report portlet to set up the homepage or dashboard report.
-
-
-
Chart - You can use data visualization to quickly interpret and compare your report data.
-
The report used as data source for the chart runs automatically when you go to your homepage if the report did not run in the last 12 (or 24 hours ago, depending on your account configuration). The report also runs automatically whenever you change and save the chart portlet setup.
-
Click View report to go to the full report in the Reports application. In the full report page, use the browser back navigation link to go back to the homepage or dashboard.
-
Click the more icon
in the upper-right corner of the content area and select:-
Refresh to run the report and refresh the report data.
-
Set up chart portlet to set up the homepage or dashboard chart.
-
-
Navigation
You can go to the next-generation homepage or dashboard from anywhere in SuiteProjects Pro.
-
To go to the homepage, go to Home > Home (new).
-
To go to the dashboards, go to Home > Dashboard (new).
Adding a New Dashboard
You can add dashboards as required. Each dashboard shows as a tab in the Dashboard (new) page header.
To add a new dashboard:
-
Click the Create button, then select New dashboard under Dashboard (new).
Personalizing your Homepage or Dashboard
You can personalize the homepage and each dashboard by adding, changing and reorganizing content in each region to suit your own business needs.
To personalize your homepage and dashboard
-
Do one of the following:
-
Go to Home > Home (new).
-
Go to Home > Dashboard (new) and click the dashboard tab you want to move.
-
-
Click Personalize view.
The Personalize view drawer appears on the right.
-
In the Personalize view drawer, you can:
-
(Dashboard only) Change the name.
-
(Dashboard only) Change the position (order) of the dashboard tab. The position of other dashboard tabs changes automatically.
-
Review the list of content items in each content regions.
-
Edit each of the content regions. Click Edit to show the Edit region drawer. You can then add or delete content items from the region.
-
Drag a content item to change the order in which it appears in the region.
-
Delete a content item. Click the more icon
then Delete. -
Delete the dashboard. See Deleting a Dashboard.
Important:All changes you make in this step, including changes to the content setup are only applied temporarily. You must save these changes in the next step.
-
-
Click Save to save your changes, or Cancel to discard your changes.
Editing a Content Region
You can add or remove content items in each region to suit your own business needs.
To edit a region:
-
In the homepage or dashboard, click Personalize view
The Personalize view drawer appears on the right.
-
In the Personalize view drawer, click Edit next to the region you want to edit.
The Edit region drawer appears. It lists the content of the region and the new content you can add. A counter next to the region title shows how many content items there are in the region, and how many content items you can have.
-
In the Edit region drawer, you can:
-
Add a new content item. Under the New section, click the type of content you want to add. This adds an empty content item of the chosen type to the content region if the maximum number of content items for the region was not yet reached.
-
Delete a content item. Click the delete icon
 next to the content item you want to delete.
-
-
Click Apply to save changes temporarily and return to the Personalization drawer.
Important:All changes you make in the Edit region drawer are only applied temporarily. You must click save in the Personalize view drawer to save the changes.
-
Click Save.
Setting up a content item
After you add a content item to a content region, you need to set up the content item.
To set up a content item:
-
Locate the content you want to edit in the homepage or dashboard.
-
In the upper-right corner of the content area, click the more icon
and select Set up <content-type> portlet, where <content-type>is one of the supported content types (list, report or chart).The Set up <content-type> portlet drawer appears.
-
Select or enter all the setup information for your content item. When selecting an option from a dropdown list, such as an object type, for example, you can enter a few characters to filter the dropdown list as you type and show matching options only.
The following table describes the setup information in the different form section for each content type.
Form section
List
Report
Chart
Data
-
Object type - Select the type of records you want the list to show. If the object list in SuiteProjects Pro includes several tabs (by approval status, or by stage, for example), an option corresponding to each tab is available in the dropdown list.
-
List tab - If the object list in SuiteProjects Pro includes several tabs (by approval status, or by stage, for example), an option corresponding to each tab is available in the dropdown list. Select the tab you want to show.
-
List layout - Select one of your saved list layouts associated with the selected object type.
-
List filter - (Optional) Select one of your saved list filters associated with the selected object type. You should use a list filter to limit the number of objects in your list because the homepage or dashboard list can only show a limited number of rows.
-
Number of rows - Select the maximum number of rows you want to show.
-
Data source (report) - Select one of your saved reports from the dropdown list.
The dropdown list shows up to 50 saved reports initially. To find a specific report, enter the report name in the search bar. The list is filtered as you type with matching terms highlighted in bold.
If you have access to more than 50 reports, enter at least three characters from the report name and click Search All to find all matching values. The dropdown list shows up to 1,000 reports containing your search term. A message at the top of the dropdown suggests that you refine your search if there are more than 1,000 search results.
-
Column width - Select
Auto widthto change the column width automatically depending on the portlet width, orFixed widthto keep the same column width when the size of the content region changes.
-
Chart type - Select the type of chart you want to use. The chart portlet currently supports the following types: Bar (bar, stacked bar), Line (area, line), and Pie (donut, pie).
-
Data source (report) - Select one of your saved reports from the dropdown list.
The dropdown list shows up to 50 saved reports initially. To find a specific report, enter the report name in the search bar. The list is filtered as you type with matching terms highlighted in bold.
If you have access to more than 50 reports, enter at least three characters from the report name and click Search All to find all matching values. The dropdown list shows up to 1,000 reports containing your search term. A message at the top of the dropdown suggests that you refine your search if there are more than 1,000 search results.
-
Number of values - Select the number of values to show on the chart or
Allto show all values. The sort order determines whether the lowest (ascending) or highest (descending order) values are shown.-
Pie charts group all remaining values under "Others".
-
Other types of chart do not show remaining values. This setting is not available if Date is used as category (x-axis).
-
-
One line labels - Check this box to show value labels on a single line in pie charts.
Values
-
-
-
Sort order - Select the sort order. The chart shows categories sorted according to the first value in the selected ascending or descending sort order. This setting is not available if Date is used as category (x-axis) for bar and line charts.
-
Value - Select one of the available options.
-
Pie charts can only show one value represented by the area of each slice.
-
Other types of charts can show multiple values represented on the y-axis. If series are not set, the chart shows a line or a bar for each value (y-axis).
-
Category
-
-
Category - For bar and line charts, select either the first report column or Date as the category (x-axis). The date category can be used to show dynamic time periods (months, quarters, years).
Series
-
-
Series - For bar and line charts, you can select either the first report column or Date, whichever is not already selected as Category.
A Series is a set of related data point showing one of the selected Values. Charts show different series as a line or a set of bars in a specific color. If Series are not set, the chart shows a line or a bar for each value (y-axis). If Series are set, the chart shows a line or bar for each combination of series and value (y-axis).
Text
-
<Content-type> title - Enter a title for the homepage or dashboard content item. The title shows above your list or report.
-
<Content-type> subtitle - (Optional) Enter a subtitle for the homepage or dashboard content item. The subtitle shows under the title.
-
<Content-type> description - (Optional) Enter a description for the homepage or dashboard content item.
Tab
Tab title - Enter a tab title for your content-item. When there is more than one content item in the primary content region, there is a tab for each content item. If not specified, the list or report title is used.
-
-
Click Save or press Enter.
Deleting a Dashboard
You can delete dashboards (dashboard tabs) you no longer need.
To delete a dashboard
-
Go to Home > Dashboard (new) and click the dashboard tab you want to delete.
-
Click Personalize view.
The Personalize view drawer appears on the right.
-
Click Delete dashboard.
A confirmation window appears.
-
Click Delete dashboard to delete the dashboard permanently. Tis action can't be undone. Click Cancel to keep the dashboard and return to personalizing your view.
Tips and Troubleshooting
The following table lists potential homepage and dashboard issues and their associated solutions:
|
Issue |
Solution |
|---|---|
|
You don't see the Home (new) or Dashboard (new) menu item. |
Your SuiteProjects Pro account configuration affect whether you can view the next-generation homepage or dashboards. In addition, depending on your account configuration, your access profile may also affect whether you can view the next-generation dashboards. For more information, contact your account administrator. |
|
All your homepage or dashboard content was replaced by a different set of lists, reports and charts. |
Account administrators or users with the relevant permissions can share default homepage and dashboard setup with others. In this case, your existing content is deleted and replaced by new content. For more information, contact your account administrator. |
|
You see the message "We couldn't find the data source for this portlet" or some other message instead of a list, a report or a chart. |
There can be various reasons why the report is not showing. The message usually gives you additional information and general troubleshooting steps. If there's a problem with one of the setup option for a list portlet, such as the selected list layout or the saved filter not being available, for example, SuiteProjects Pro ignores these options and shows the list with the standard layout and no advanced filter. If the message says that the report was deleted or you don't have access to this report, it may be that the report is no longer shared with you. If this is part of a homepage or dashboard setup that was shared with you, report the issue to your account administrator. If there's a problem with the report and you own the report, try going to the report and making the necessary changes. If someone else owns the report, report the issue to the owner of this report or to your account administrator. Alternatively, you can edit the portlet setup and select a different report, or delete the report portlet. |