Inserting Insights in Smart View
You can insert insights in a Microsoft Excel sheet, a Microsoft Word document, and a Microsoft PowerPoint slide.
To insert insights:
- Open an Excel sheet, a Word document, and a PowerPoint slide and connect to your business process that has IPM Insights.
- In the Smart View Panel, right-click the application
name and then click IPM Insights.
Alternatively, you can also click More in the Action panel and then click IPM Insights. The IPM Insights dialog displays all the available insights generated in the application.
You can filter this list based on insight type, POV, and priority. See Viewing Insights in Smart View
- In the IPM Insights dialog, select an insight and click
Insert.

Note:
In Word and PowerPoint, you can select an insight by clicking a row. In Excel, you can insert multiple insights at the same time by selecting the check boxes next to the required insights.The insights are inserted in the following way in an Excel sheet, a Word document, and a PowerPoint slide:
- Optional: You can save the sheet and refresh the inserted insights to display the latest values. See Saving and Refreshing Insights.
Inserting Insights in Microsoft Excel
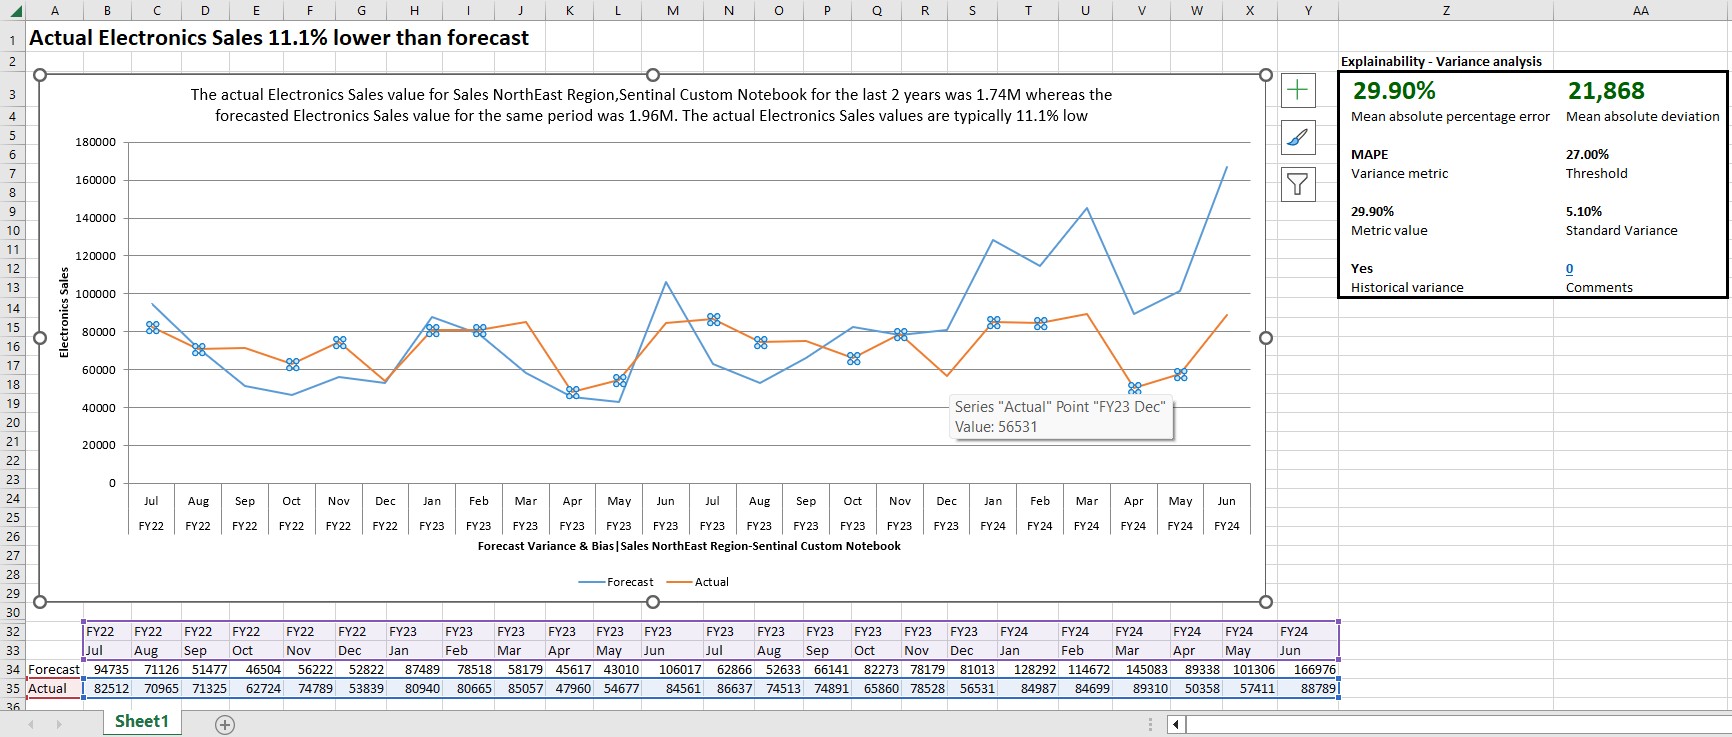
In Excel, the insight is inserted as a chart along with the insight statement and the data table associated with the insight.

You can view the following details:
- Chart: The chart shows a brief description of the insight at the top, and the insight type and POV on the axis. You can hover on the chart to view the specific data points. You can also click a line chart to view the associated row highlighted in the data table.
- Data Table: The data table displays the scenario members in the table header, unlike the web application which displays both scenario members and insight type in the header.
- Explainability: The Explainability table displays details about the insight including metrics and methods used in the insight. These details make the insight data more prominent and more transparent. These details may differ based on the insight type.
- Comments: The number of comments available for the insight are displayed
in the Explainability table. Comments help you collaborate with other users over
insights. To view the comments, you can double-click the number link and view
them in the Add/Delete Insight Comments dialog box. You can also add new
comments in the same dialog box.
- To view the comments, you can double-click the number link and view them in the Add/Delete Insight Comments dialog box. For each comment, the user name of the comment writer is displayed along with the date and time of comment entry.
- To add new comments, in the Add/Delete Insight Comments dialog box, enter your comment in the text box and click the > button.
- To delete a comment, in the Add/Delete Insight Comments dialog box, click the Close icon next to the specific comment.
Note the following considerations about inserting insights in Excel:
- You can insert only one insight per sheet. If you try to insert insight on a sheet that already has an existing insight, form, or ad hoc grid, then the existing content and metadata are cleared before inserting the new insight.
- In Excel, you can insert multiple insights at the same time by selecting the check boxes next to the required insights. If multiple insights are selected while inserting, each insight is inserted on a separate sheet within the workbook.
- If there are any negative values to be plotted in the insight chart, the plotted axis is anchored at 0 (zero) and may possibly show up above the plotted lines.
-
For Prediction type of insight, you can update the forecast values in the data table to the predicted values by changing the relevant cell values. The chart also gets updated to reflect the changed values. You can submit the changed values to update the forecast, provided the POV associated with the cells is writable. The Submit Data action works similar to the Update Forecast action available in the web application.
Not all data cells can be updated and submitted. If you update a cell that is not supposed to be updated, it will display the changed value for the moment, but on submitting data, it will revert to its original value.
- You can view additional details and metadata associated with the insight in the Sheet Information dialog. See Viewing Insight Metadata in Sheet Information.
Inserting Insights in Microsoft Word
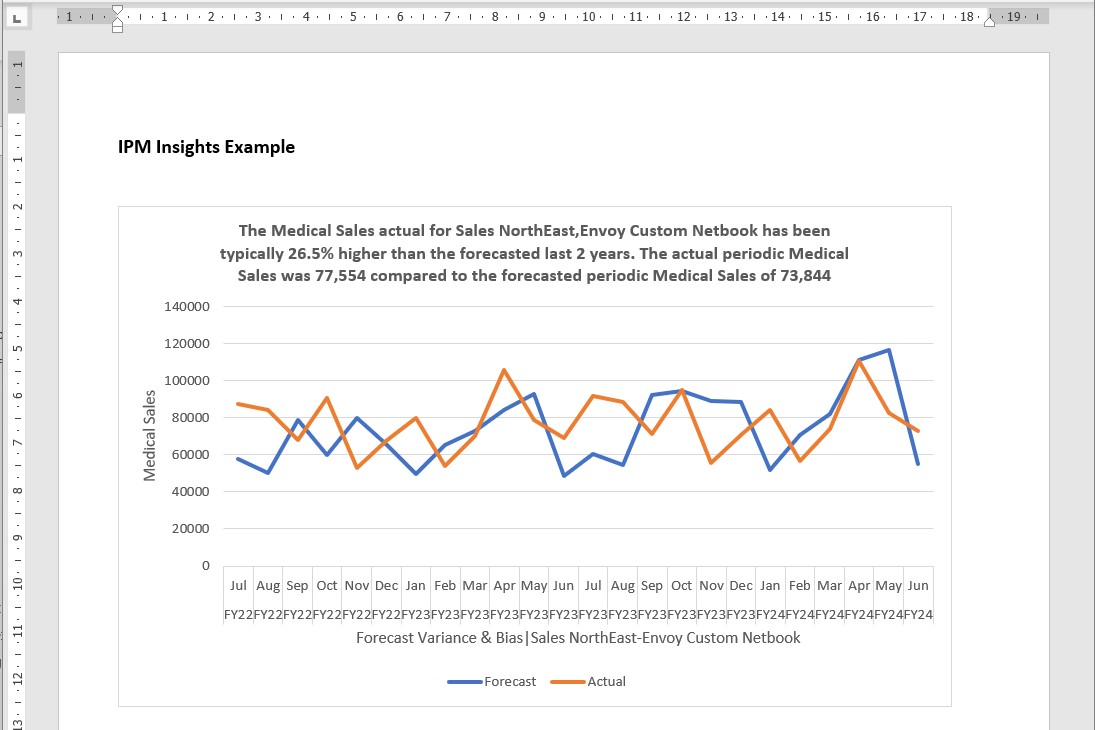
In Word, the insight is inserted as a chart along with the insight description. The chart shows a brief description of the insight at the top, and the insight type and POV on the axis. You can hover on the chart to view the specific data points.

Note the following considerations about inserting insights in Word:
- You can insert only one insight at a time in Word.
- If there are any negative values to be plotted in the insight chart, the plotted axis is anchored at 0 (zero) and may possibly show up above the plotted lines.
Inserting Insights in Microsoft PowerPoint
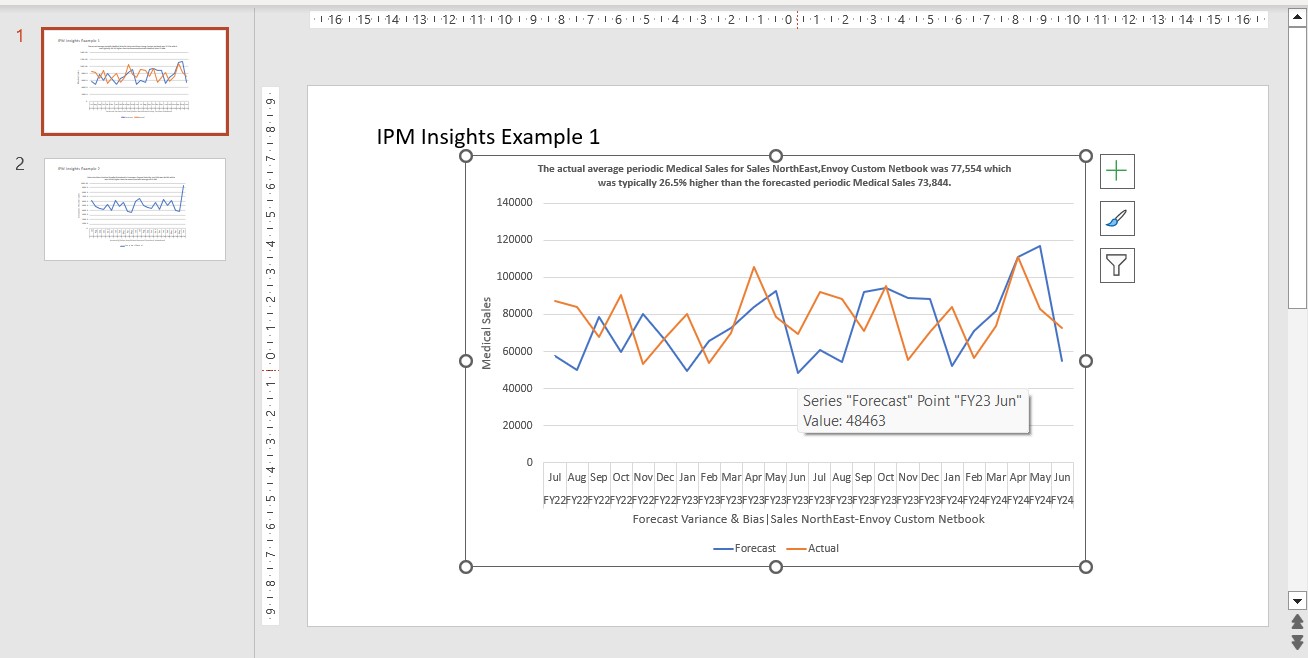
In PowerPoint, the insight is inserted as a chart along with the insight description. The chart shows a brief description of the insight at the top, and the insight type and POV on the axis. You can hover on the chart to view the specific data points.

Note the following considerations about inserting insights in PowerPoint:
- You can insert only one insight at a time in PowerPoint.
- As a best practice, it is recommended to insert only one insight per slide to avoid information clutter.
- If there are any negative values to be plotted in the insight chart, the plotted axis is anchored at 0 (zero) and may possibly show up above the plotted lines.