Work with Business Indicators
Business indicators provide a way to capture and display business metrics specific to your process. You designate selected data objects as business indicators, then plot them in business analytics dashboards. For example, for a sales quotation application, you might track key values that end users enter into a form, such as opportunity amount and region, then plot them in a chart displaying total opportunity amount by region.
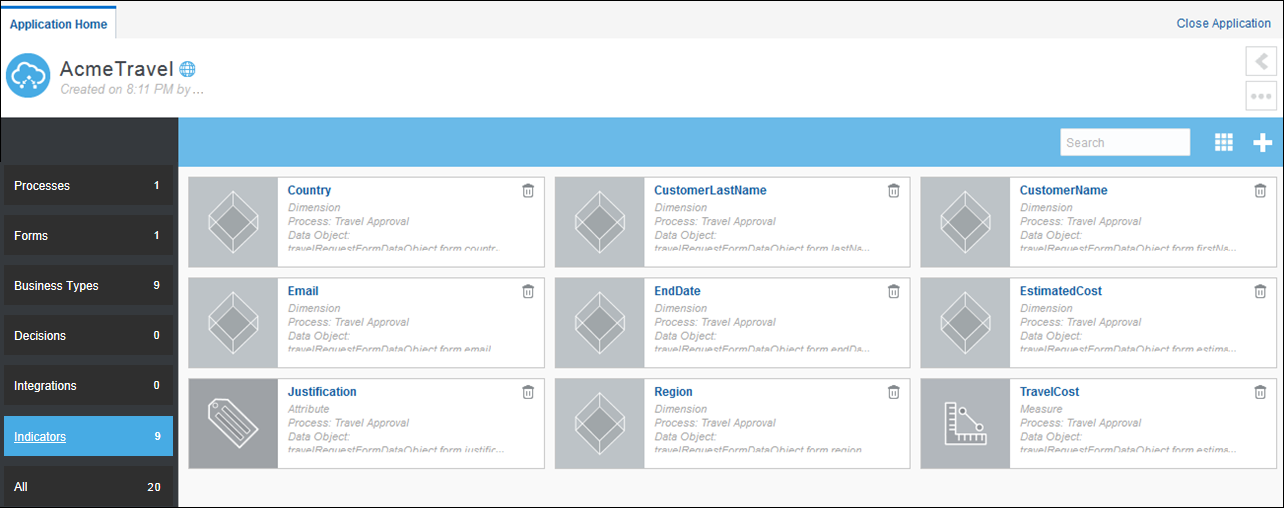
The following image shows sample business indicators defined for an application:

Description of the illustration business-indicators-composer.png
You can create the following types of business indicators. Consider a data object’s type when creating its business indicator.
-
Dimension indicators are available to plot as the X axis in charts, as a series and a group. Available dimension types include string, integer, decimal, Boolean, or date/time.
-
Measure indicators are available to plot as the Y axis in charts, along with a function such as COUNT, SUM or AVG. They must be numeric (integer or decimal). You can set ranges for your numeric measure indicators.
-
Attribute indicators are available to plot as filters in charts. Available attribute types include string, integer, decimal, Boolean, or date/time.
Note:
The X axis, the Y axis and the filters are available in the business analytics section in Dashboards.After activating the application, you can select business indicators to plot charts or graphs in Dashboards using business analytics options as described in Create and View Business Analytics Dashboards. You must be assigned the Process Owner role, the Administrator role, or the Analytics Viewer role to create and view business analytics in Dashboards. Business analytics options are available in production deployments.
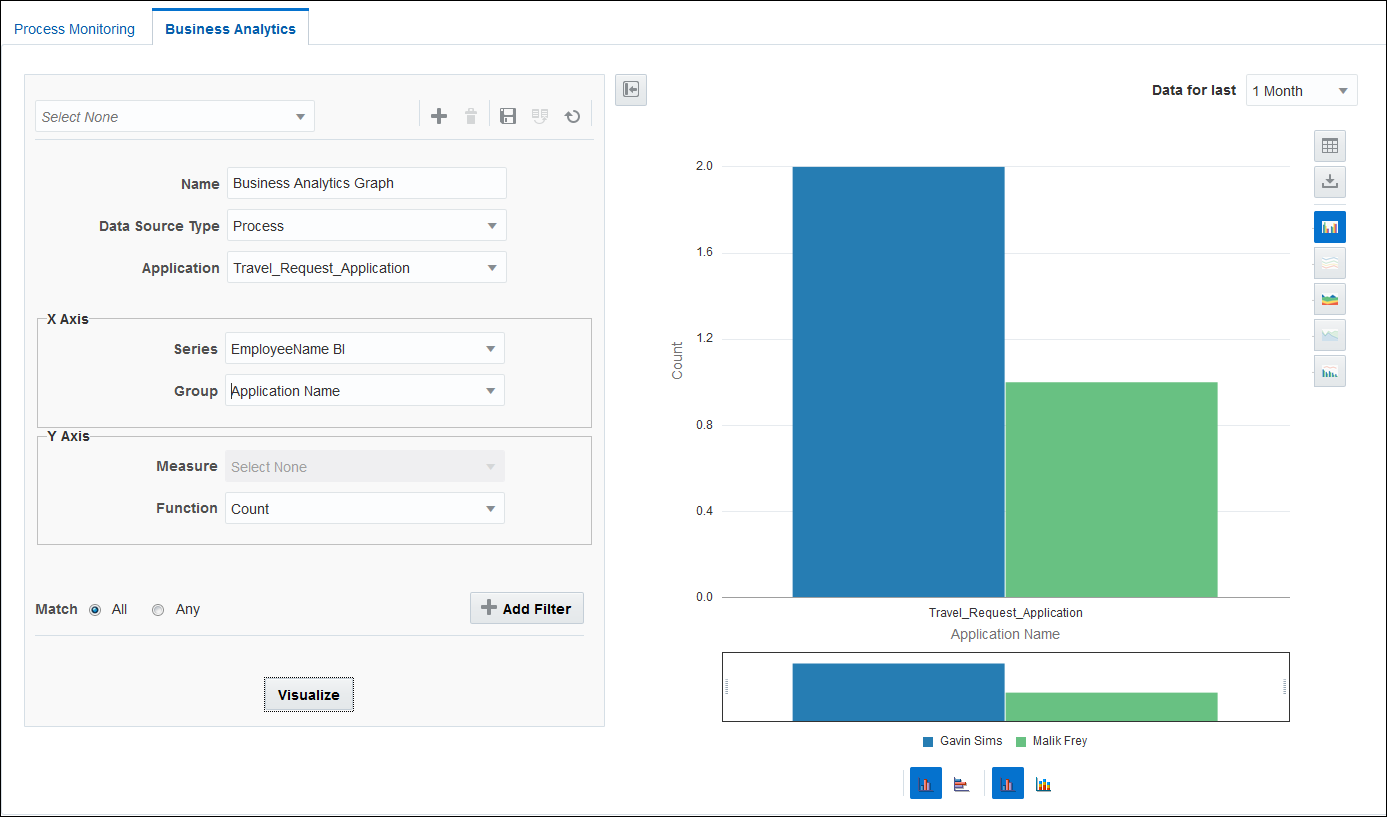
The following image shows a chart plotted using the business indicators defined in the application.

Description of the illustration dashboard-visualization1.png
Create Business Indicators
You can create business indicators to capture key metrics for use in custom visualizations, as described in Creating and Viewing Business Analytics Dashboard. You can create them using the Indicators pane or using data objects options in the process editor.
Create Business Indicators from the Process Editor
- Go to the Application Home tab, click Processes on the left pane, and then select a process.
- On the process editor, click Data Objects.
- In the Data Objects dialog box, expand the process and select a data object. Click Indicator and select a business indicator type to add.
- Select the business indicator type, and enter a name (without spaces) in the Name field for the indicator, or leave the default name, and then click OK. The Type, Process, and Data Object fields are filled in by default. Click Close to close the data object dialog.
Add Dimension Business Indicators
Create dimension indicators to identify data objects whose values you want to display in business analytics dashboards.
Add Measure Business Indicators
Create measure indicators to identify numeric data objects whose values you want to display in business analytics dashboards.
Add Attribute Business Indicators
Create attribute indicators to identify data objects whose values you want to use as filters in business analytics dashboards.
