Score
You can call the predict method to make predictions with the test
dataset, and the score method to obtain the R-squared metric with
the test dataset.
predictions_test = spatial_error_pipeline.predict(X_test.drop(["MEDIAN_INCOME"])).flatten()
print(f"\n>> predictions (X_test):\n {predictions_test[:10]}")

score_test = spatial_error_pipeline.score(X_test, y="MEDIAN_INCOME")
print(f"\n>> r2_score (X_test):\n {score_test}")
The output is as shown:
>> predictions (X_test):
 [103705.9560757  107611.13674597  22112.24223308  37592.05306079
 170447.29190844  49590.69485066 104998.38030099  25865.98085974
  83318.68789415  15481.54002089]

>> r2_score (X_test):
 0.6433383305587677
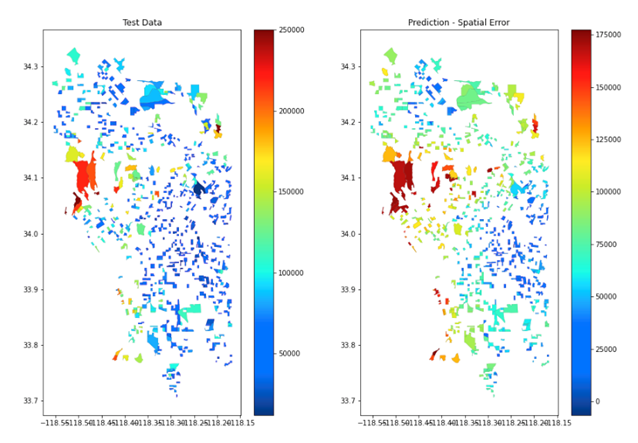
The following code displays the test set and the model’s predictions in a map.
import matplotlib.pyplot as plt
from oraclesai.vis import plot_geometries

fig, ax = plt.subplots(1, 2, figsize=(15,10))

# Set plot's labels and titles
ax[0].set_title('Test Data');
ax[1].set_title('Prediction - Spatial Error');

# Plot the choropleth map
plot_geometries(data=X_test, ax=ax[0], column=X_test["MEDIAN_INCOME"].values, cmap=plt.get_cmap("jet"), legend=True, edgecolor='black', linewidth=0.1 )
plot_geometries(data=X_test, ax=ax[1], column=predictions_test, cmap=plt.get_cmap("jet"), legend=True, edgecolor='black', linewidth=0.1 )