SQL Interpreter
Graph Studio provides a SQL interpreter which allows you to run SQL statements in a notebook paragraph.
To use the SQL interpreter, you must
specify %sql at the beginning of the notebook paragraph and then input
the SQL statement. You can run only one SQL statement in a single paragraph.
Tip:
You can hover over the bottom part of a notebook paragraph and click theThe database connection is established for the currently logged in user. For example, the following SQL statement retrieves the name of the user logged on to the database.
%sql
-- Get Current user
SELECT SYS_CONTEXT('USERENV','CURRENT_USER') FROM DUAL;
The following topics describe a few scenarios using the SQL interpreter.
Create, Query, Visualize, and Delete SQL Property Graphs
The following code uses the CREATE PROPERTY GRAPH DDL
statements for creating a SQL property graph in a notebook paragraph:
%sql
CREATE PROPERTY GRAPH bank_sql_pg
  VERTEX TABLES (
    bank_accounts
      KEY (id)
      LABEL account
      PROPERTIES ALL COLUMNS
  )
  EDGE TABLES (
    bank_txns
      KEY (txn_id)
      SOURCE KEY (from_acct_id) REFERENCES bank_accounts (id)
      DESTINATION KEY (to_acct_id) REFERENCES bank_accounts (id)
      LABEL transfer
      PROPERTIES ALL COLUMNS
  );
You can query the SQL property graph using SQL graph queries.
%sql
SELECT * FROM GRAPH_TABLE (bank_sql_pg
  MATCH
  (a IS account WHERE a.id = 816) -[e IS transfer]-> (b IS account)
  COLUMNS (a.id AS acc_a, e.amount AS amount, b.id AS acc_b)
);
The preceding query produces the following output:
ACC_A	AMOUNT	ACC_B
816	8781	287
816	6381	590
816	9011	934
816	6890	289
816	4443	812
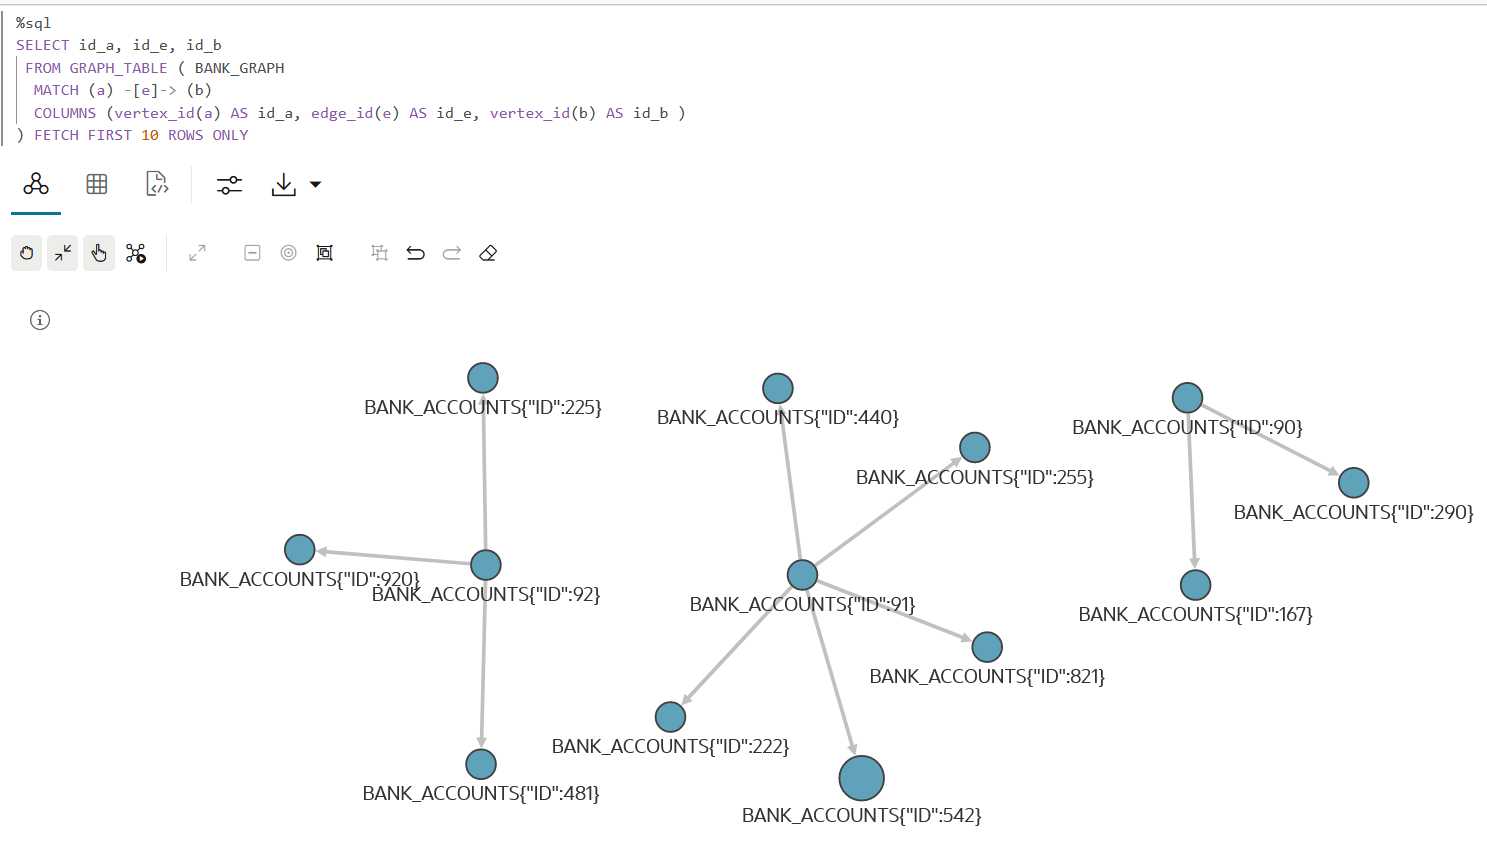
You can also visualize the output of SQL graph queries. In order to visualize the vertices and edges of the SQL graph query, you must return the vertex and edge IDs. For example:
SELECT id_a, id_e, id_b
FROM GRAPH_TABLE ( BANK_GRAPH
MATCH (a) -[e]-> (b)
COLUMNS (vertex_id(a) AS id_a, edge_id(e) AS id_e, vertex_id(b) AS id_b )
) FETCH FIRST 10 ROWS ONLY
Note that the COLUMNS clause in the preceding query
uses the VERTEX_ID and EDGE_ID operators. The
visualization output of the SQL graph query is as shown:
Finally, you can delete the SQL property graph using the DROP
PROPERTY GRAPH DDL statement as shown:
%sql
DROP PROPERTY GRAPH bank_sql_pg;See Also:
- SQL DDL Statements for Property Graphs in Oracle AI Database Graph Developer's Guide for Property Graph
- SQL Graph Queries in Oracle AI Database Graph Developer's Guide for Property Graph
- Vertex and Edge Identifiers in Oracle AI Database Graph Developer's Guide for Property Graph
Create and Use Custom Database Views for PGQL Property Graphs
As shown in the following sequence of SQL paragraphs, database views are created on the SALES
and CUSTOMERS tables in SH schema. Also, the
primary key and foreign key constraints are defined for the views.
%sql
CREATE VIEW sh_customers
AS SELECT cust_id, cust_first_name, cust_last_name, country_id, cust_city, cust_state_province
FROM sh.customers;
%sql
ALTER VIEW sh_customers
ADD CONSTRAINT shcustomers_id PRIMARY KEY (cust_id)
DISABLE NOVALIDATE;%sql
CREATE VIEW sh_sales
AS SELECT rownum sale_id, cust_id, prod_id, channel_id, promo_id, quantity_sold, amount_sold
FROM sh.sales;%sql
ALTER VIEW sh_sales
ADD CONSTRAINT shsales_id PRIMARY KEY (sale_id)
DISABLE NOVALIDATE;%sql
ALTER VIEW sh_sales
ADD CONSTRAINT shsale_cust_fk FOREIGN KEY (cust_id)
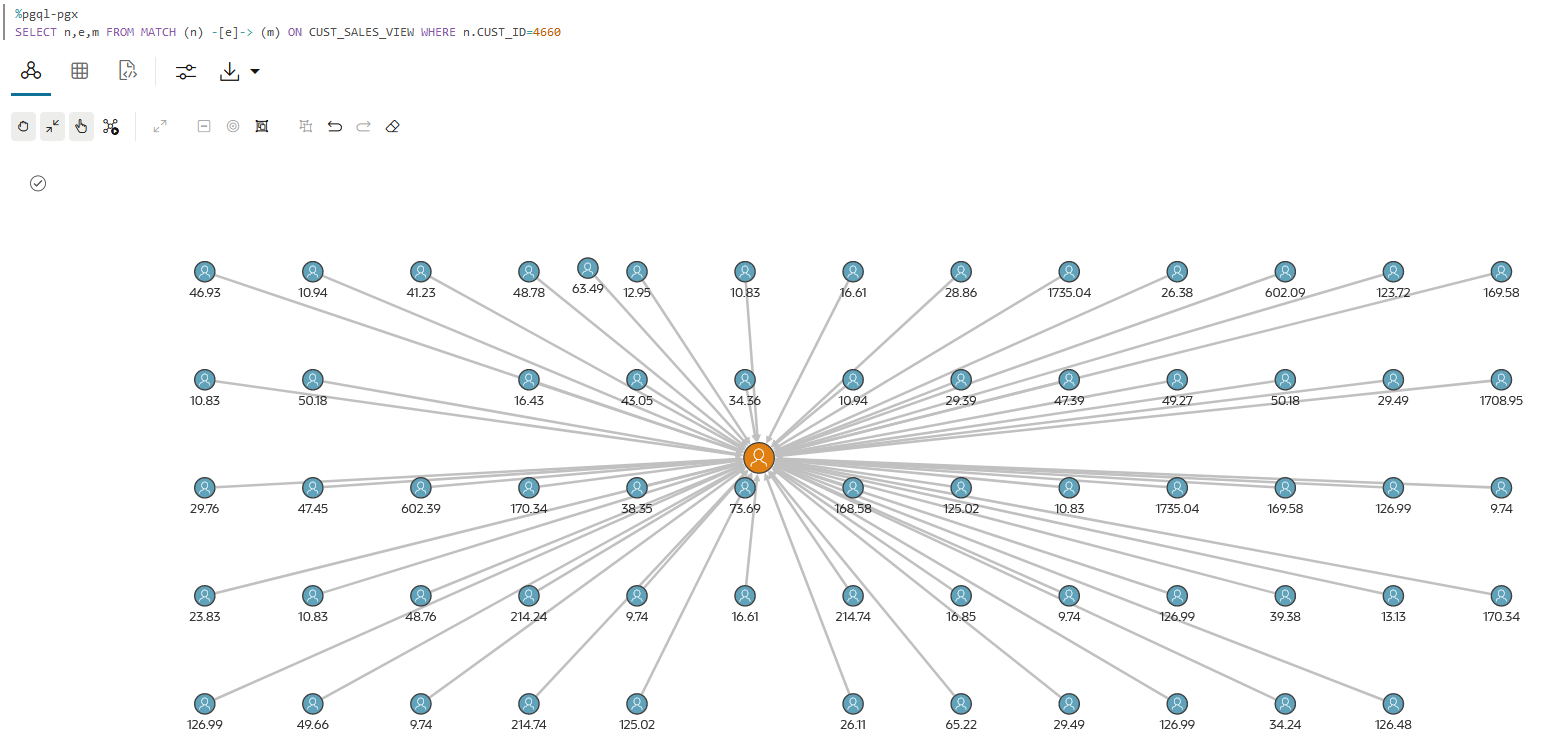
REFERENCES sh_customers DISABLE NOVALIDATE;You can then create a PGQL Property Graph graph using these database views (see Create a Property Graph from Existing Relational Tables) and then perform graph visualizations in a PGQL (PGX) paragraph as shown:
Visualization Using Charts
The SQL query in the following example determines the products bought by a specific customer and the resulting query output is visualized using a Bar Chart:
%sql
SELECT p.prod_name, count(p.prod_name) AS sold
FROM sh.products p, sh.sales s, sh.customers c
WHERE p.prod_id = s.prod_id AND s.cust_id = c.cust_id AND c.cust_id= 3221
GROUP BY p.prod_name;
Description of the illustration sql_viz.png
XML Support in Table Visualization
Graph Studio provides support for visualizing tabular data with
XMLType and CLOB data type columns. The
results of these columns are parsed and rendered as tree of items. You can modify
the rendering by changing the XML Expansion Level in the
table visualization settings. The default is 1.


