Create a Property Graph from Existing Relational Tables

You can create a property graph from existing relational tables.

Note:

  • The PG Objects graph type is desupported. It is recommended that you create a PGQL Property Graph or SQL Property Graph.

  • SQL property graphs are supported only in Oracle AI Database 26ai. Therefore, if you are using an Autonomous AI Database instance with Oracle AI Database 26ai, then you have the option to create SQL property graphs.

It is also important to note that when creating a graph, the property graph wizard will throw a warning if the source tables used to create a PGQL or SQL property graph include any Datetime data types in the primary key. Additionally, a warning will be issued if the tables contain composite vertex keys in the case of PGQL property graphs.

However, you can still create a property graph by ignoring the warning. But you cannot load the property graph into memory.

To create a property graph from existing relational tables:
  1. Navigate to the Graphs page.
  2. Select the Property Graph tab and click Create Graph.
    The property graph wizard opens displaying the Overview page.
  3. Enter the Graph Name

    Description of pg_workflow_overview.png follows
    Description of the illustration pg_workflow_overview.png

    Note that the graph name is not case sensitive and is normalized to uppercase by default in Graph Studio. However, you can enable case sensitivity through the Preserve Case toggle as explained in step 12.

  4. Optionally enter the graph Description and click Next.
  5. Select the required Graph Type.

    Graph Studio supports the creation of two types of property graphs:

    • SQL Property Graph: The option to create a SQL property graph is available only if you are using an Autonomous AI Database instance with Oracle AI Database 26ai.
    • PGQL Property Graph: The option to create a PGQL property graph is available on all types of tenancies and supported on all database versions.
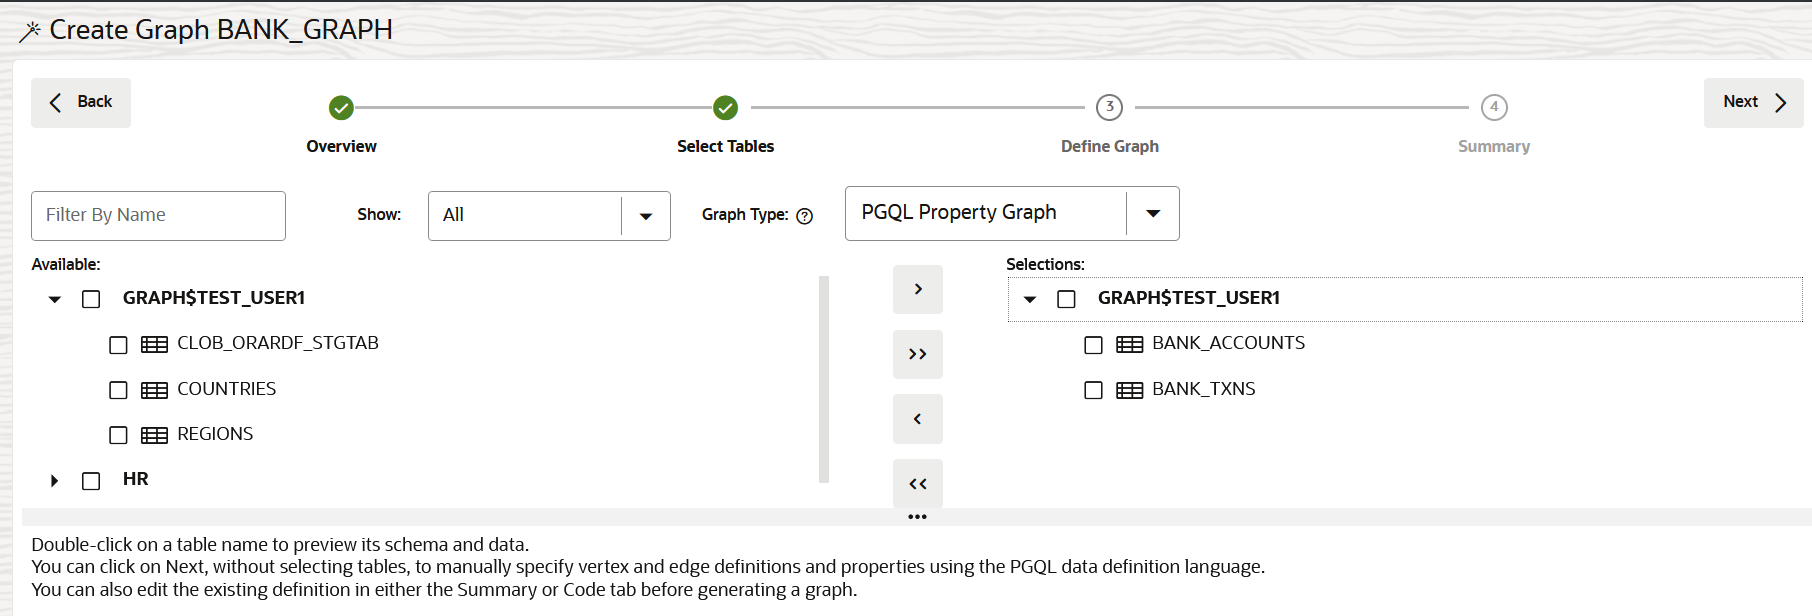
  6. Select the source data tables that are required as input for the graph and move them to the Selections section on the right.

    Description of pg_workflow_select_tables.png follows
    Description of the illustration pg_workflow_select_tables.png

    See Mapping Oracle Data Types to PGX Data Types to learn how the Oracle data types are mapped to the graph server (PGX) data types.

  7. Choose the mode for creating the new graph using the Graph Schema drop-down.
    The following modes are supported:
    • From foreign key relationships: In this default mode, vertices and edges of a graph are automatically deduced by Graph Studio using the foreign key relationships in the underlying source database tables (selected in the previous step).
    • Manually: In this mode, you can manually create the graph vertices and edges based on the database tables selected in the previous step.
  8. Click Next.
    • If you chose to manually add the graph vertices and edges, then see Build a Graph Manually for more information.
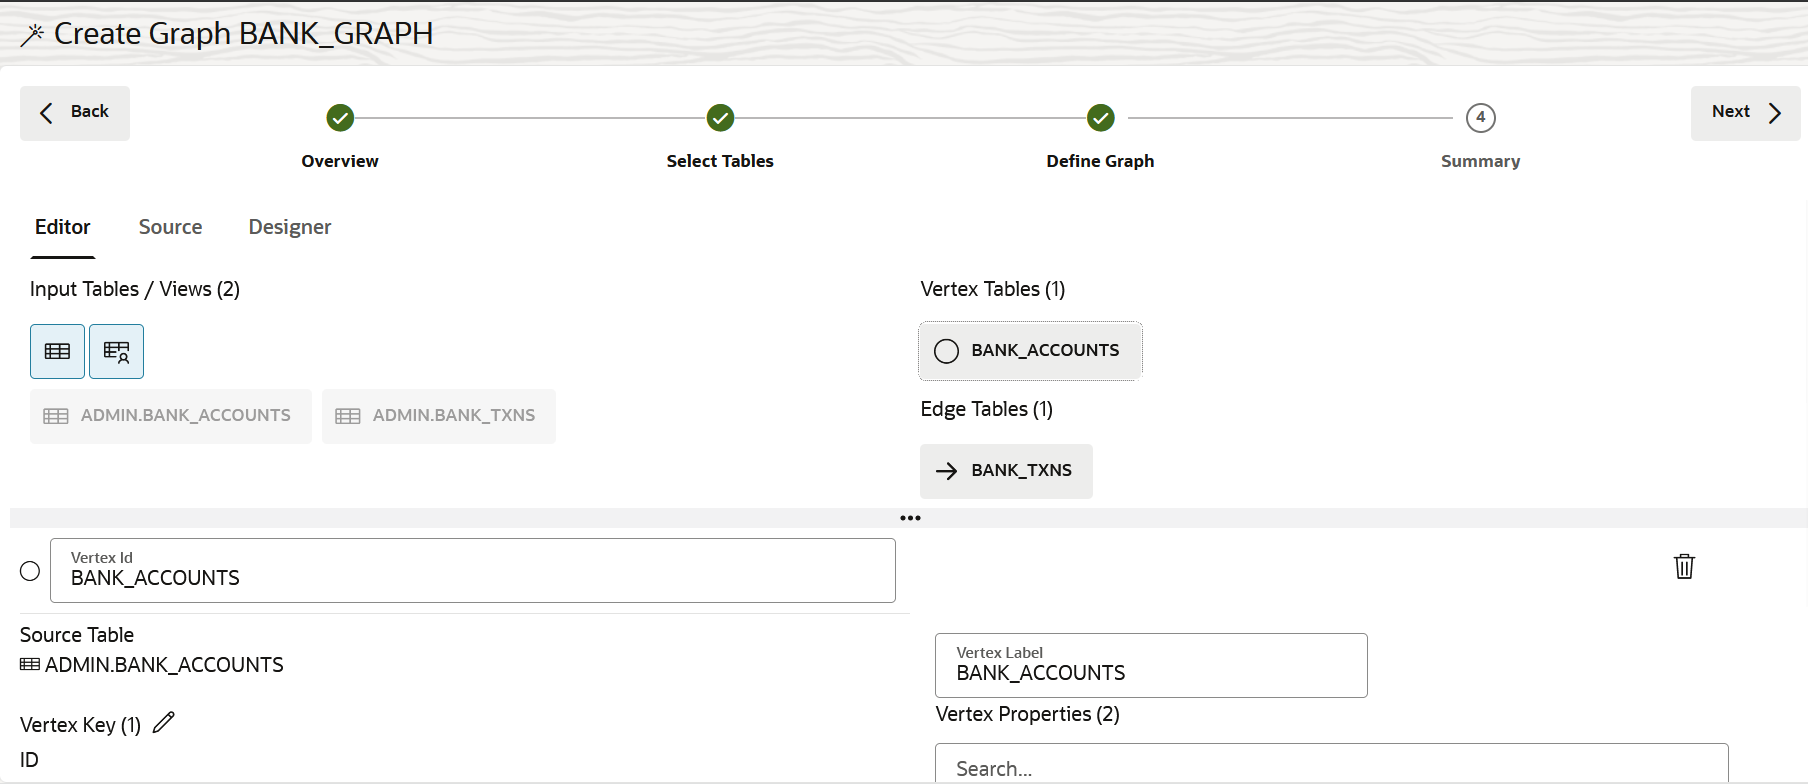
    • If you chose to build the graph using foreign key relationships, then the graph definition is displayed automatically. For example:Description of pg_workflow_define_graph.png follows
      Description of the illustration pg_workflow_define_graph.png

      In the preceding figure, the Vertices and Edges sections in the left pane display the graph's vertices and edges, respectively. The property graph is visually represented in the right pane.

      You can modify the graph definition if required. See Build a Graph Manually on how to update the graph definition in the Designer tab.

      Note:

      Verify if the vertex and edge table keys are defined for the graph. These keys are generated automatically by the property graph wizard. In case the wizard is unable to generate the vertex and edge table keys, then you must manually specify these keys. Otherwise, the wizard will not proceed to the next step of graph creation. See Specify Vertex and Edge Table Keys for more information on how to add or edit the vertex and edge table keys.
  9. Click Next to view the graph summary.
    Graph Studio evaluates the graph definition and displays a summary of the graph if the validation is successful.

    Otherwise it may report errors, warnings, or both:

    Description of errors_warnings.png follows
    Description of the illustration errors_warnings.png
    The errors and warnings may vary depending on the graph type. Also, note the following:
    • Errors: Errors appear at the beginning in the Errors and Warnings slider. You need to resolve the errors in order to create a graph.
    • Warnings: Warnings are reported following the errors. Graph Studio allows you to create a graph despite the warnings, but the graph cannot be loaded into memory. See Warnings During Property Graph Creation for more information on the warnings details when creating a property graph.

    You can choose one of the following actions provided on the error or warning message:

    • Remove Column: Removes the column from the vertex or edge table and the graph definition is updated and re-validated.
    • Remove Table: Removes the vertex or edge table and the graph definition is updated and re-validated.
    • Ignore: Dismisses the error or warning message. Ignoring a warning allows you to continue to the next step of creating a graph. However, ignoring an error does not allow you to proceed with the graph creation. If all the reported errors and warnings are ignored, the Errors and Warnings slider is automatically closed.
    • Remove All: Removes all the tables and columns that cause errors or warnings and the graph definition is updated and re-validated.
    • Ignore All: Closes the Errors and Warnings slider.
  10. Click Create Graph.

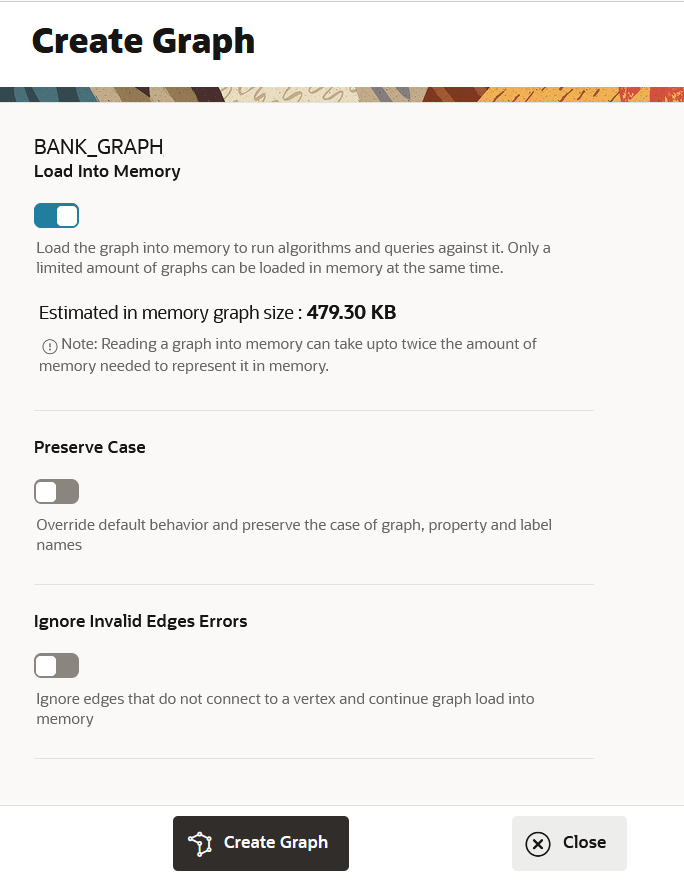
    This opens the Create Graph slider as shown:

    Description of create_graph.png follows
    Description of the illustration create_graph.png
  11. Optionally, switch on or off the Load Into Memory toggle.
    By default, the Load Into Memory toggle is disabled. If you had ignored any warnings reported on the graph definition, then the toggle remains disabled as the graph cannot be loaded into memory.

    The Estimated in memory graph size is also computed and displayed in the slider. Also, note the following with respect to the status of the compute environment:

    • Detached:
      • If the estimated graph size is less than the graph server (PGX) memory that is configured in the compute environment settings, then this new estimated value will be automatically saved as the default memory preference for the graph server (PGX). In this case, the slider will additionally display the following message:

        This value will be saved as memory preference when compute environment is started.

      • If the estimated graph size is greater than the maximum memory allowed to be allocated to the graph server (PGX) in the compute environment settings, then the following warning will be displayed in the slider:

        A graph of this size will likely result in OutOfMemory errors during loading or analysis. Consider loading a subgraph instead.

    • Attached: If the estimated graph size is greater than the graph server (PGX) memory available for allocation in the compute environment settings, then the following warning will be displayed in the slider:

      A graph of this size will likely result in OutOfMemory errors during loading or analysis. Consider loading a subgraph instead.

  12. Optionally, switch on or off the Preserve Case toggle.
    By default, this toggle is switched off. Enable the Preserve Case toggle if you wish to preserve the case for graph, property, and label names. In such a case, ensure to enclose the preserved names in quotes when referencing them later in SQL graph queries in Notebooks.
  13. Click Create Graph to create the property graph.