Graph Studio: Interactive, Self-Service User Interface
Graph Studio is the primary user interface (UI) for creating, querying, analyzing, and visualizing property graphs and RDF graphs.
It includes a modeler for creating and editing property graphs. The modeler includes Graph Assistant, which helps you create and edit property graphs using natural language prompts. Graph Studio also includes notebooks and developer APIs and a </> Query interface where you can execute SQL graph queries, PGQL (Property Graph Query Language) queries, and RDF graph queries using SPARQL. It also provides over 80 built-in graph algorithms and dozens of visualizations, including native graph visualization.
The following figure shows the Graph Studio landing page.
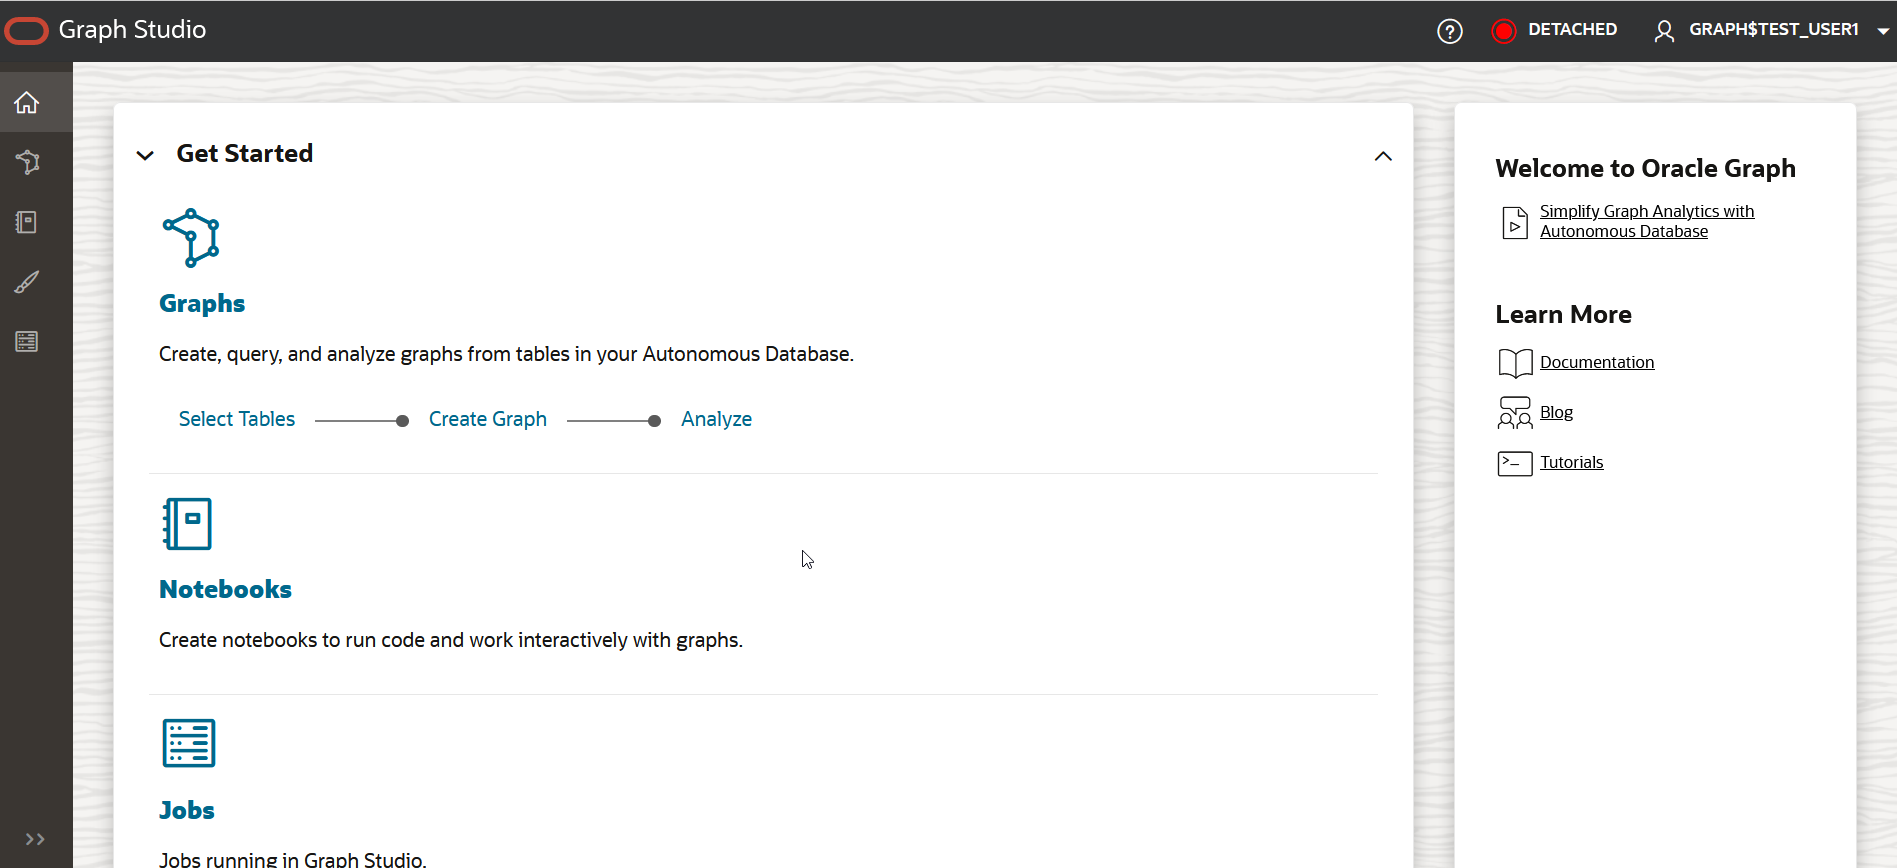
Description of the illustration ui_graph_studio.png
- A header at the top of the page. See Header for more information.
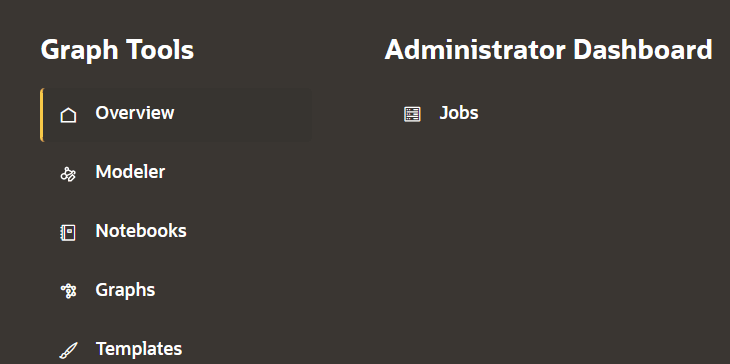
- A main navigation panel that opens from the top of the page when you click the hamburger icon:
- A page body that displays the content for the selected menu item.
Header
The header comprises the following items:
 : Click to view the main navigation menu.
 : Click the help icon to link to the documentation to get started with the
Graph Studio user interface.
: Click the help icon to link to the documentation to get started with the
Graph Studio user interface.
 : Displays the status of the compute environment. See Inspect the Compute Environment for more information.
 : Click the user profile to view the drop-down menu with the following
options:
: Click the user profile to view the drop-down menu with the following
options:
- Database: Displays the name of the database connected to Graph Studio.
- Compute Environment: Allows you to Manually Manage the Compute Environment.
- Preferences: Allows you to configure your application Preferences.
- About: Allows you to view the version of Graph Studio and the versions of other components integrated with it.
Preferences
You can adjust the Graph Studio application settings in Preferences.
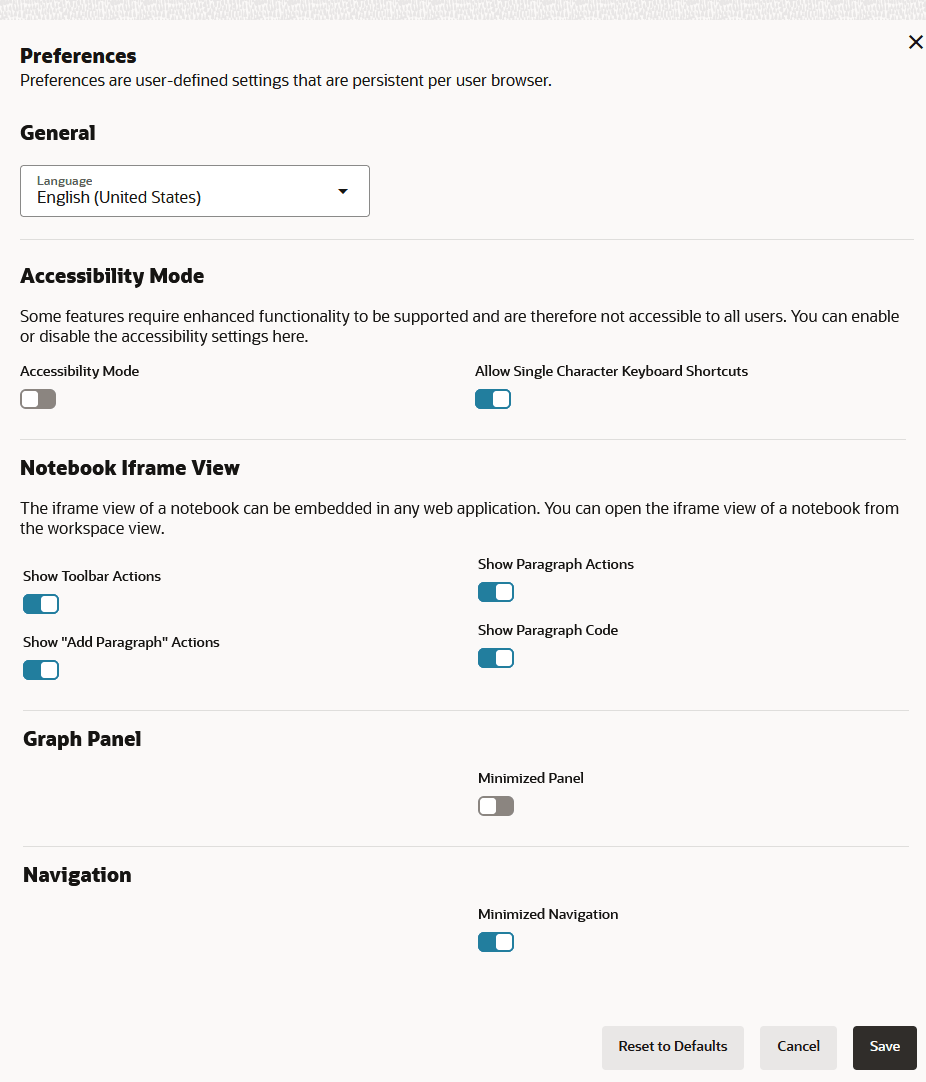
As seen in the preceding figure, you can configure the following application settings:
- General: To change the displayed language in Graph Studio using the Language drop-down.
- Accessibility Mode: To switch on or off accessibility mode. See Use Accessibility Mode
- Notebook Iframe View: To open a notebook in iframe view by enabling or disabling the actions shown in the preceding figure.
- Graph Panel: By default Minimized Panel is switched off.
- Navigation: By default Minimized Navigation is switched on.
Overview
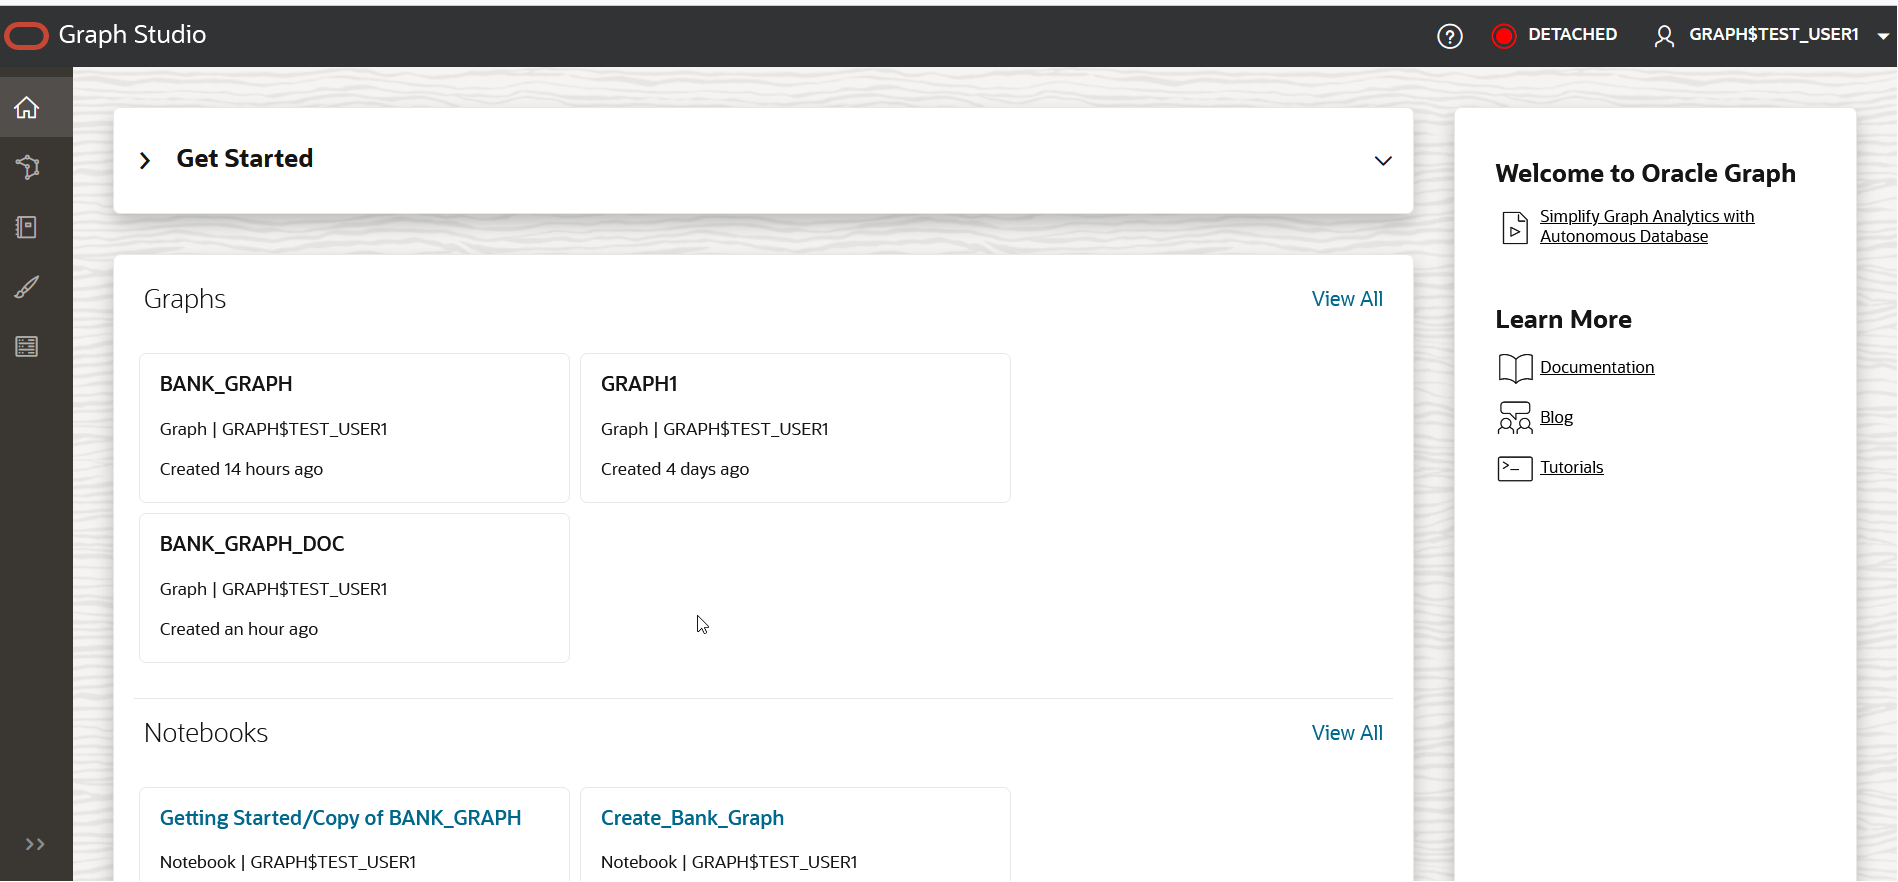
The Overview menu link directs you to the main or landing page. It consists of two sections:
The right section is a welcome panel which shows the following:
- A link to a video which describes how Graph Studio makes it easy to create and work with graphs in Autonomous AI Database.
- A Learn More section with links to documentation, blogs, and tutorials.
The left section shows either of the following:
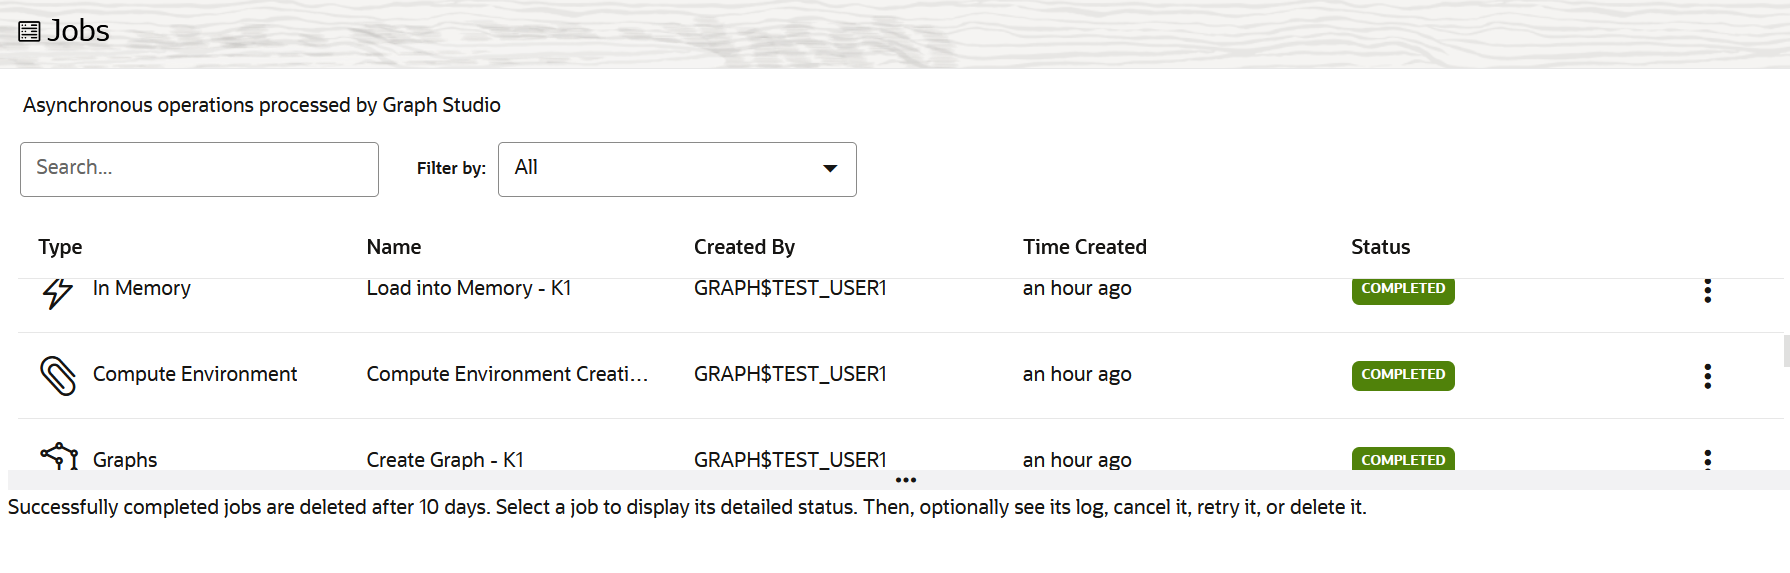
- A collapsible panel with links to Graphs, Notebooks, and Jobs pages for a first-time user.
- Cards listing existing graphs, notebooks, and jobs for a returning user with existing content as shown in the following screen .
Modeler
The Modeler user interface lets you create new property graphs and edit existing ones.
The following shows the Modeler landing page:
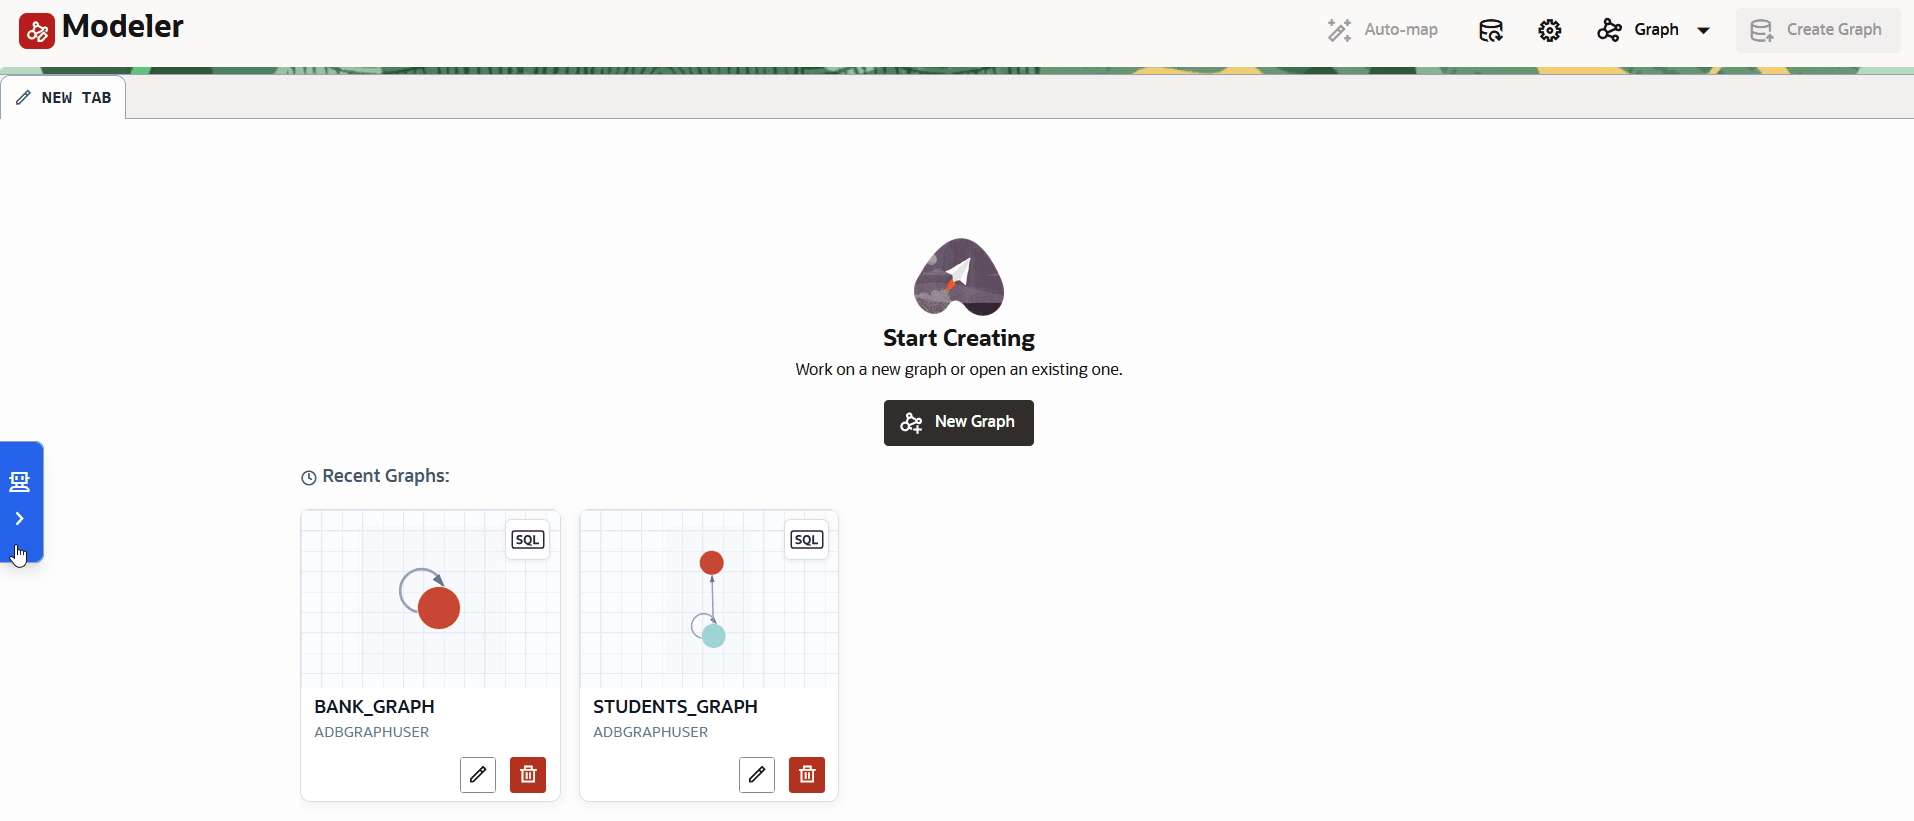
You can perform any of the following actions:
- Click New Graph to get started creating a new property graph.
- Click the Edit icon on an existing graph to modify it.
- Expand the Graph Assistant panel by clicking the arrow on the left side of the page, and then create a property graph using natural language.
The following shows the user interface for the graph modeling page:
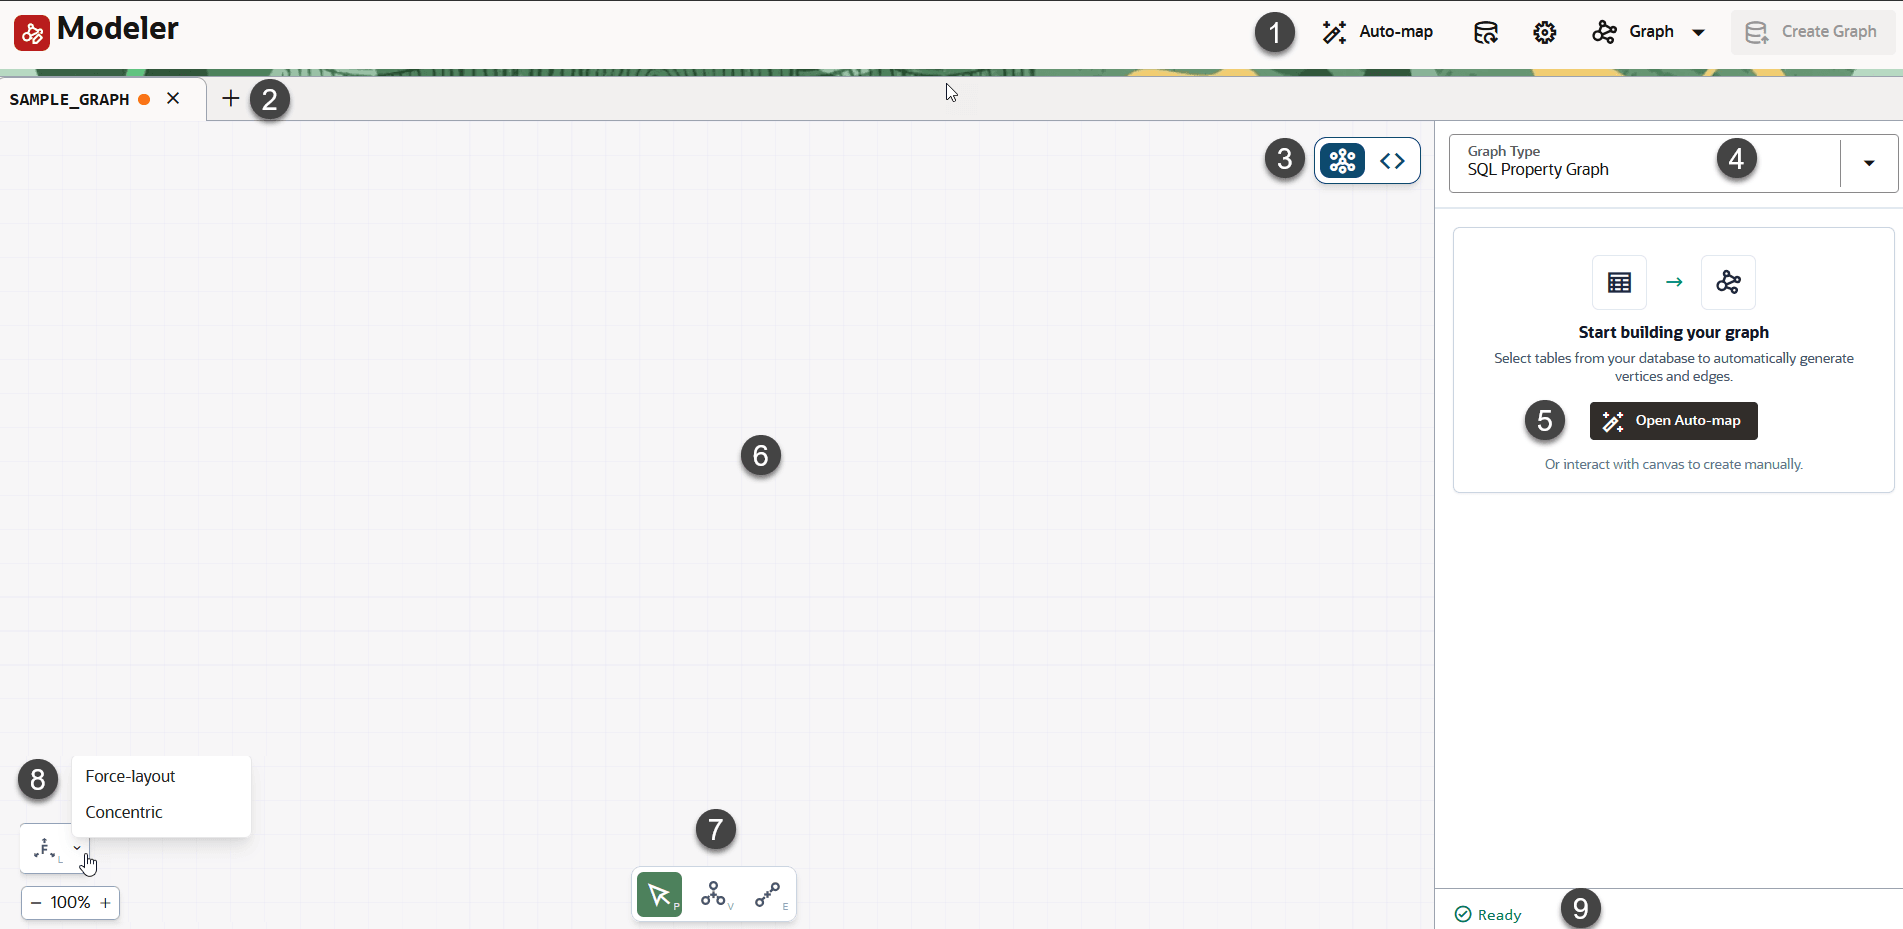
- Modeler Toolbar: Supported actions are:
- Auto-map: Invoke this feature to automatically generate a SQL or PGQL property graph from selected database tables by detecting foreign key relationships.
- Sync Database: Click to refresh the graph model with changes to the underlying database schema. You can configure automatic synchronization by enabling Auto Sync and specifying the synchronization interval as described in Configure Modeler Settings.
- Settings: Click to configure the settings for the Visual Editor, Graph Assistant, and database synchronization.
- Graph Actions: Select one of the
following:
- New graph: Select to get started modeling a new property graph.
- Create a copy: Select to create a copy of an existing property graph.
- Create Graph: Click to create a new property graph in the database.
- Graph Tabs: Displays the currently open property graph model. Click the + icon to create additional graph tabs. If Auto-name New Graphs is enabled in Settings, a default graph name is generated automatically and displayed as the tab name. Otherwise, you can specify the graph name before creating the graph.
- Canvas / Code View toggle: Switch between the visual editor and code editor.
- Graph Type: Select the graph type for creation:
- SQL Property Graph: The option to create a SQL property graph is available only if you are using an Oracle Autonomous AI database instance with Oracle AI Database 26ai.
- PGQL Property Graph: The option to create a PGQL property graph is available on all supported database versions.
- Open Auto-map: Click to invoke this feature to automatically generate a SQL or PGQL property graph from selected database tables by detecting foreign key relationships.
- Graph Modeling Canvas: The interactive workspace where you visually model the property graph by creating, connecting, and arranging vertices and edges.
- Visual Editor tools: Tools for manually building the graph, including adding vertices and edges to the canvas.
- Layout Controls: Automatically arranges the property graph on the canvas. Click F to apply a force-directed layout. Use the directional arrows to orient the concentric layout on the canvas.
- Status Bar: The status bar can display warnings, indicate when the graph is ready for creation, and can also show database syncing messages.
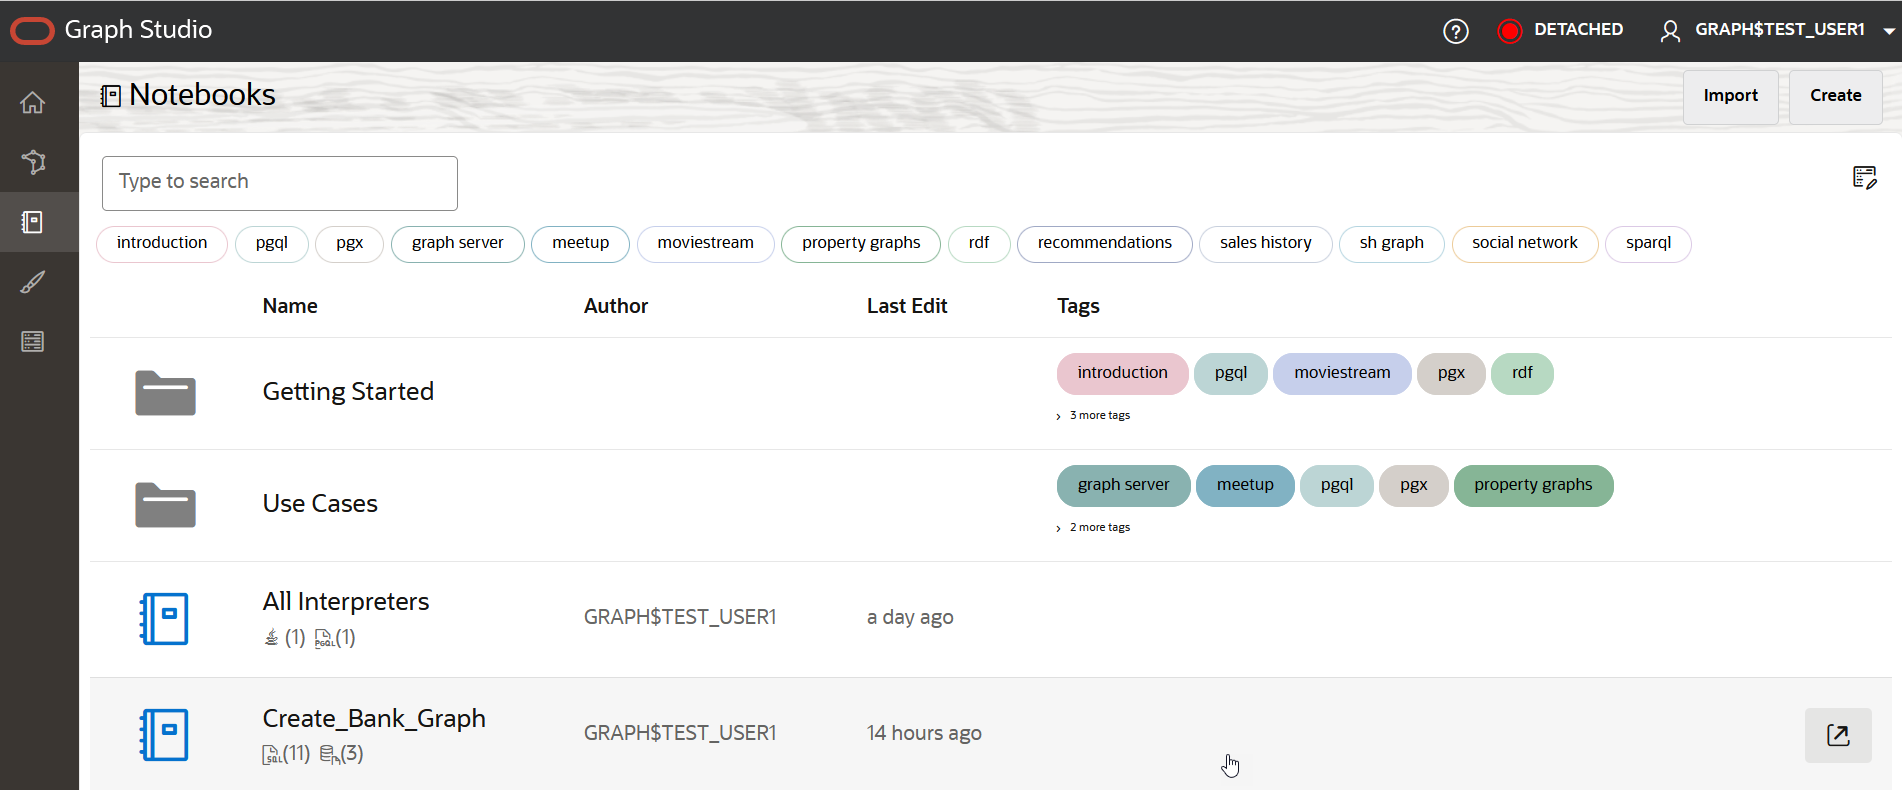
Notebooks
The Notebooks menu link takes you to the Notebooks page that lists the existing notebooks.
Graphs
- Property Graph
- RDF Graph
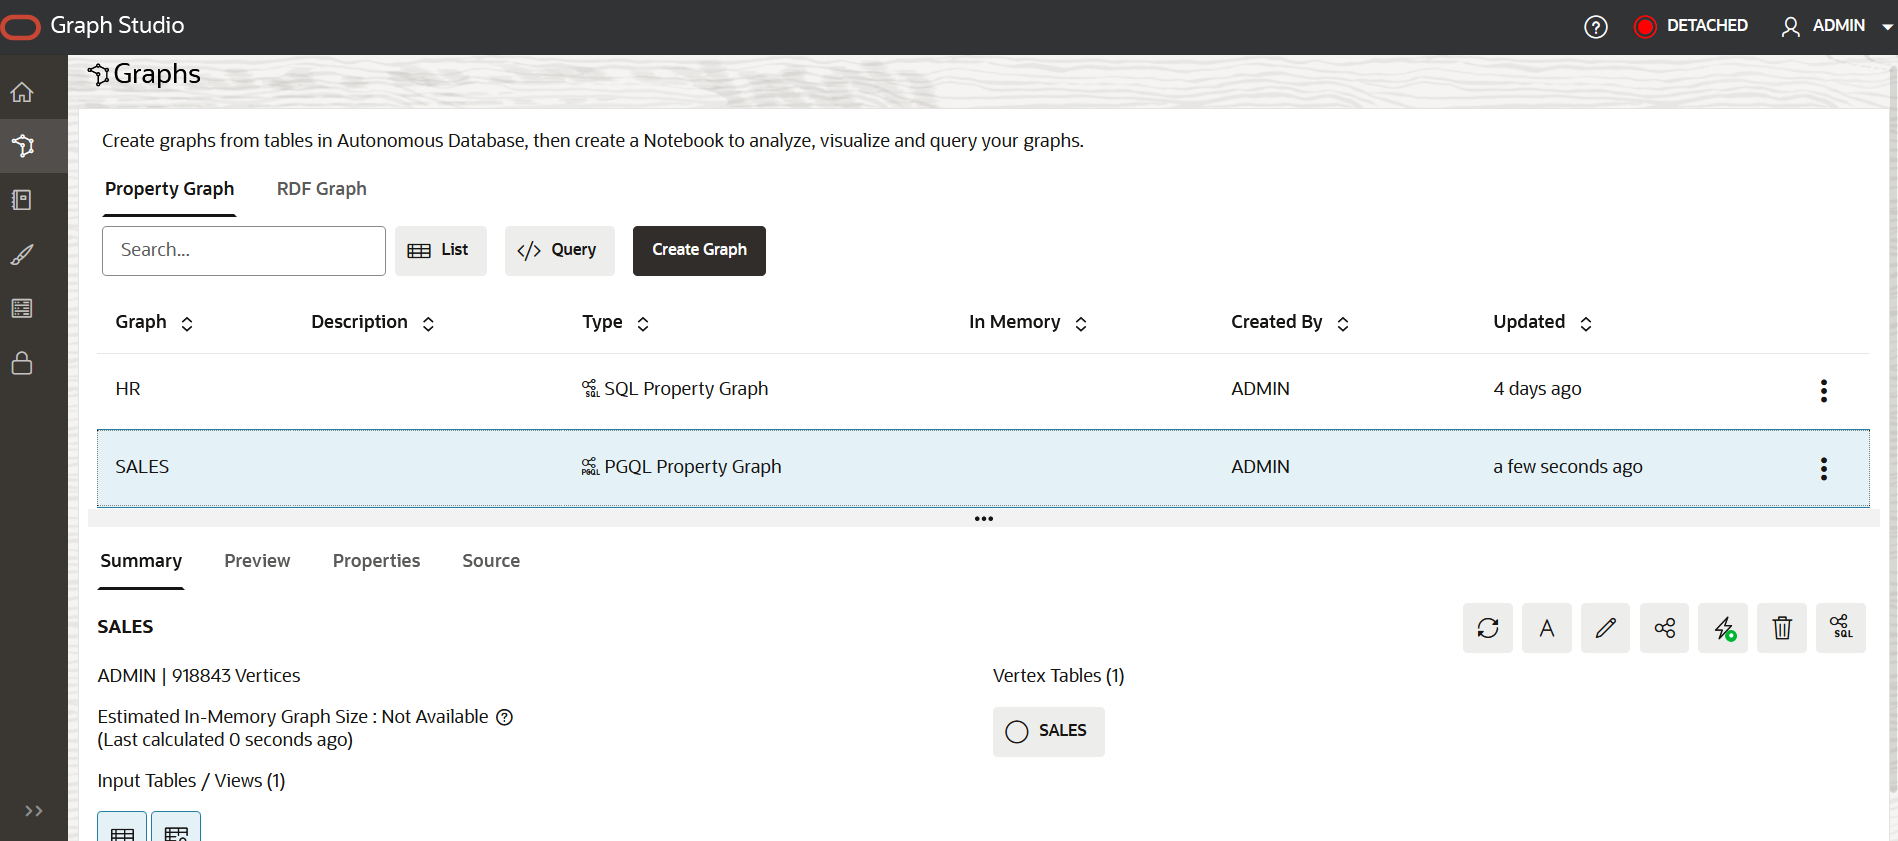
Description of the illustration graphs_page.png
Depending on the graph, you can perform any of the following actions on this page:
- Property Graph
- Create a new SQL or PGQL property graph.
- Query an existing SQL or PGQL property graph. See Query Playground for more information.
- You can also use any of the following supported options in the
graph details section:
- Explore the Summary of the graph and optionally load the graph into memory, share the graph with other users, rename or delete the graph.
- Preview the graph.
- View the graph Properties.
- View the graph Source.
- RDF Graph
- Create a new RDF graph.
- Query an existing RDF graph using SPARQL.
- Explore the RDF graph properties (RDF statements) in the graph details section.
Query Playground
Clicking </> Query on the Graphs page will direct you to the Query Playground page. It serves as a notepad for entering and executing simple SQL or PGQL queries on a SQL or PGQL property graph, or SPARQL queries for an RDF graph. It is not meant for testing complex queries or for use in a production environment.
Queries submitted in the playground are executed directly against the graph stored in the Autonomous AI Database as shown:
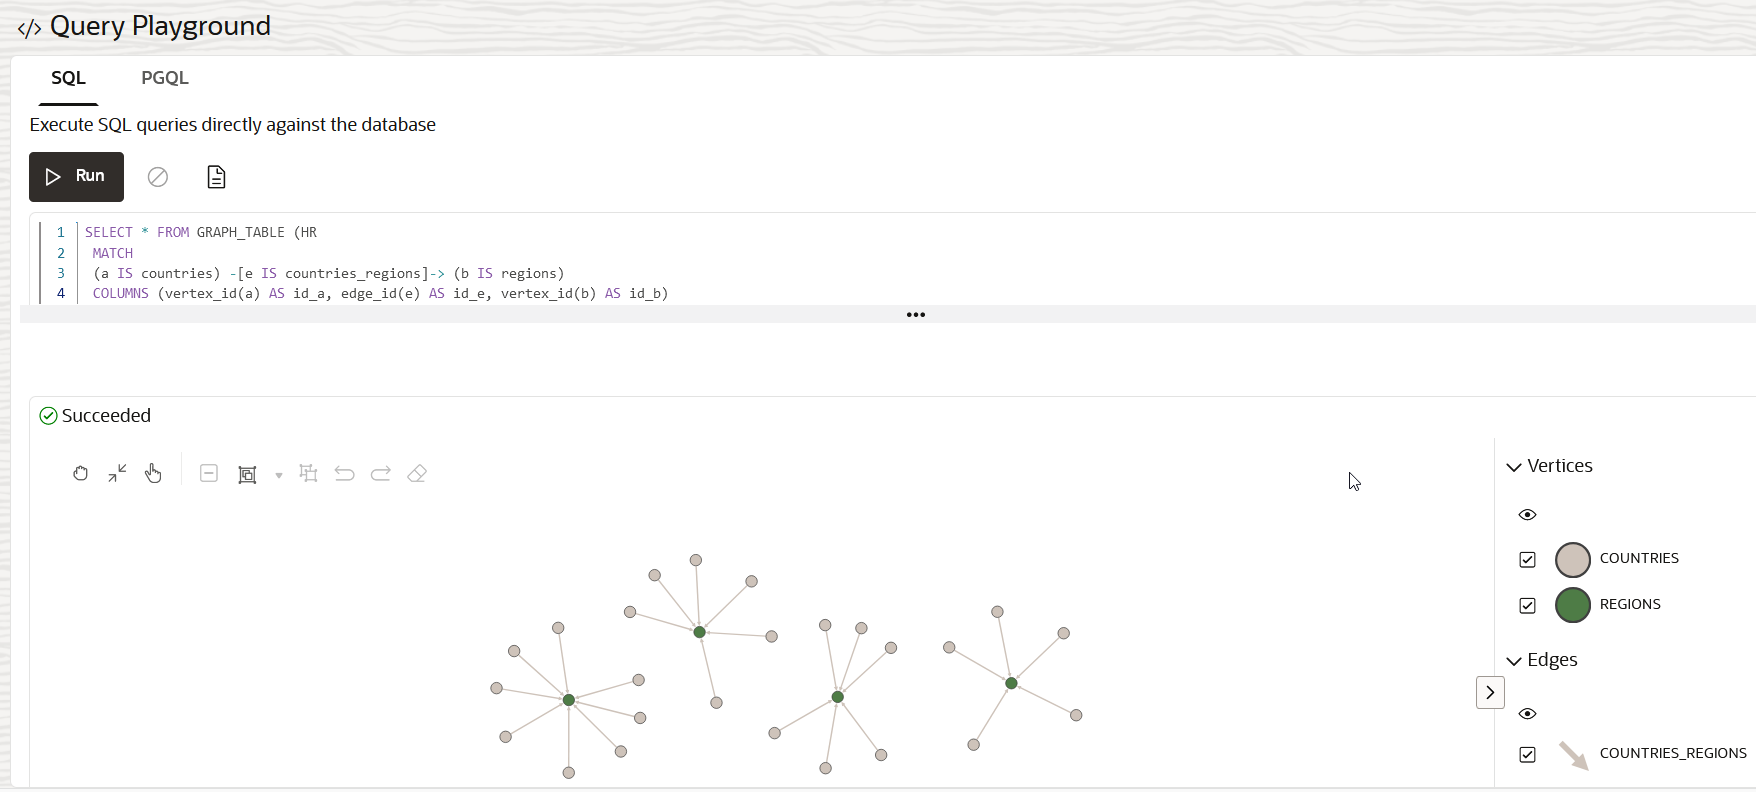
This means you do not require Graph Studio to be attached to the internal compute environment or initially have the graph loaded into memory in case of property graphs.
The Query Playground page can comprise one or both of the following tabs depending on the database version used in your Autonomous AI Database instance:
- SQL: This default tab is displayed only for Oracle AI Database 26ai. You can run SQL graph queries on SQL property graphs in this tab.
- PGQL: You can run PGQL queries on PGQL property graphs in this tab. This is the only tab for Oracle Database 19c.
In case of RDF graphs, the Query Playground interface allows you to select the RDF graph against which the SPARQL query is to be executed as shown:
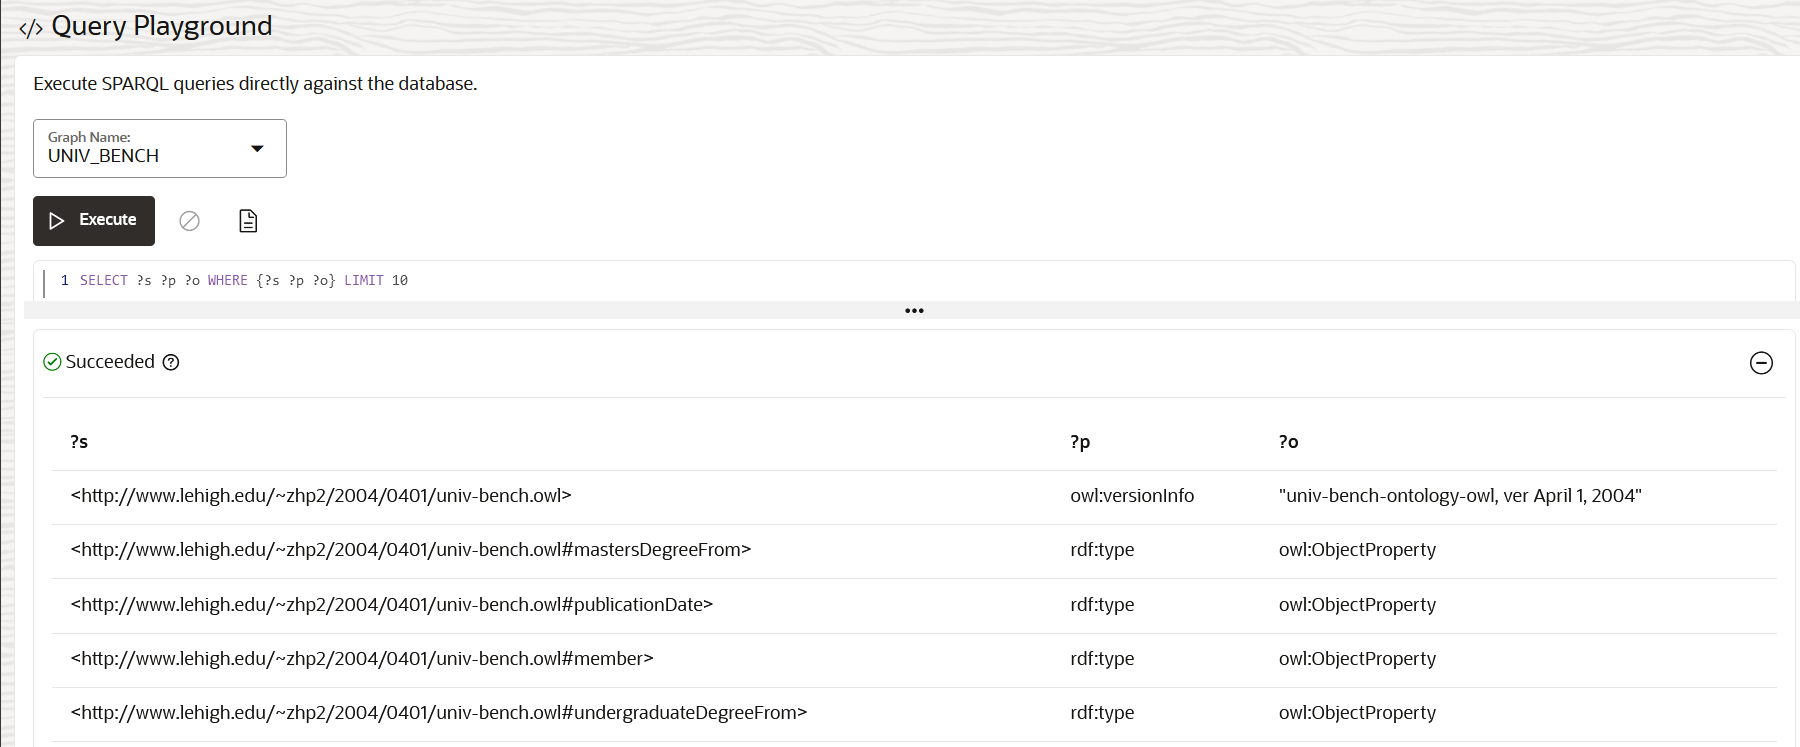
Description of the illustration query_playground_rdf.png
Templates
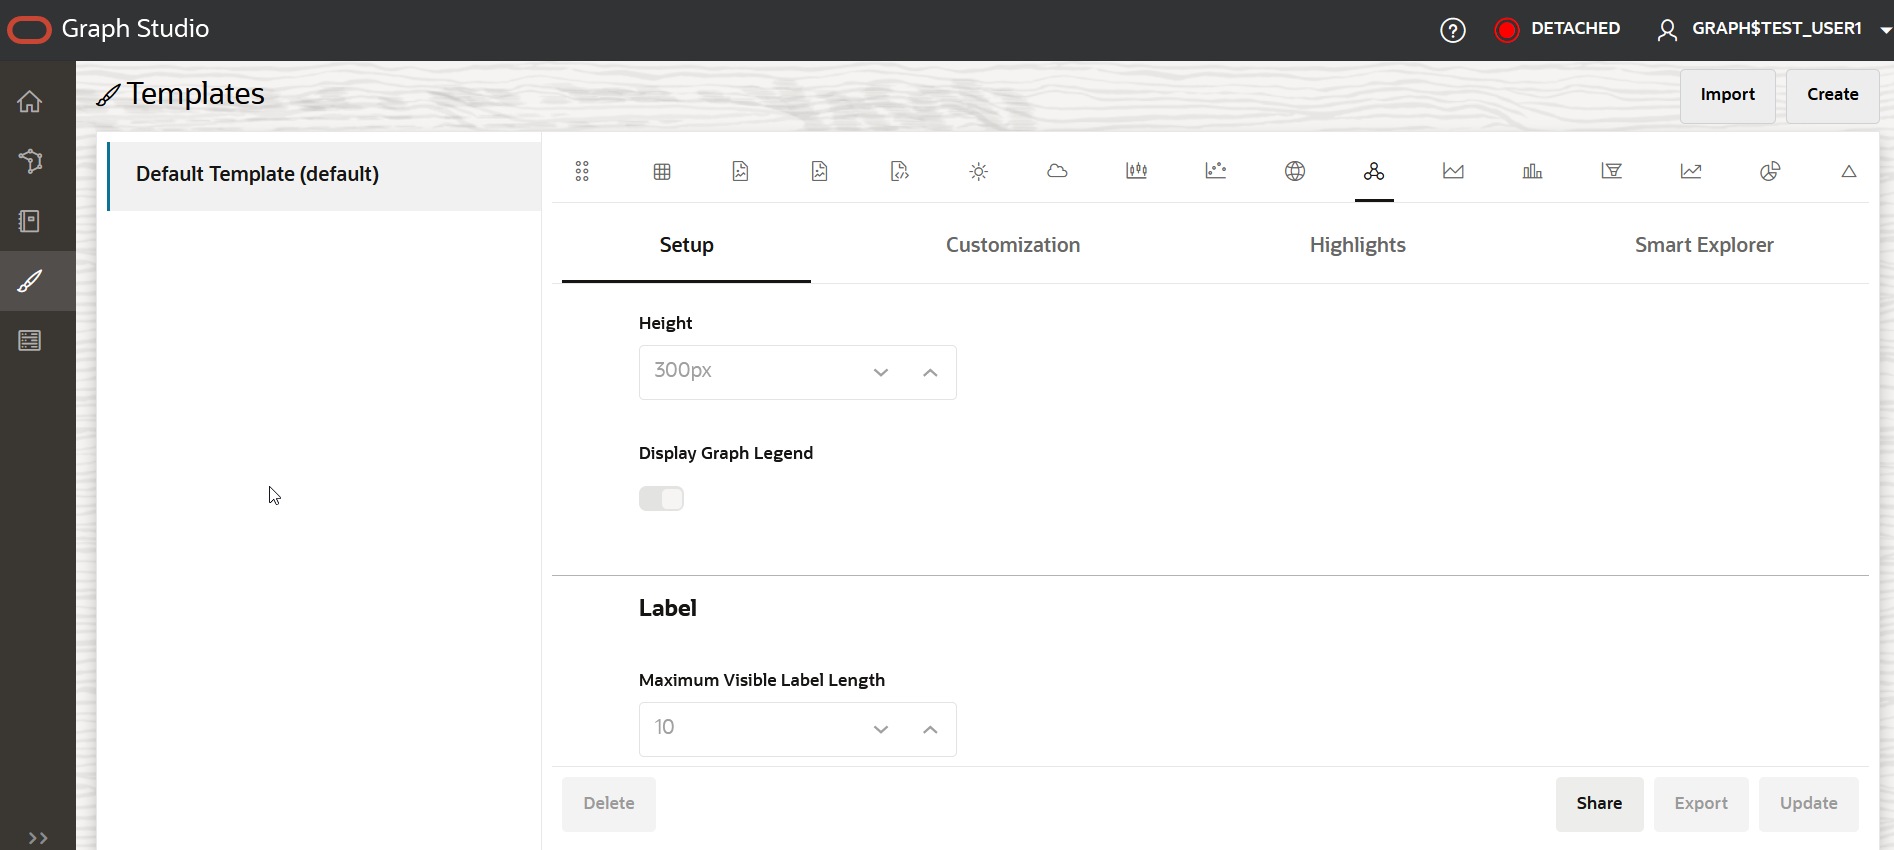
The Templates menu link directs you to the Templates page. This page consists of a left pane that lists all the existing templates. They are custom built templates with predefined graph visualization and notebook settings. Clicking on an existing template displays the custom data settings on the right pane. These template formats are applied to a notebook.
- Create: To build a new template
- Update: To update a template
- Delete: To delete a template
- Share: To share a template
- Import: To import a template
- Export: To export a template