Evolution
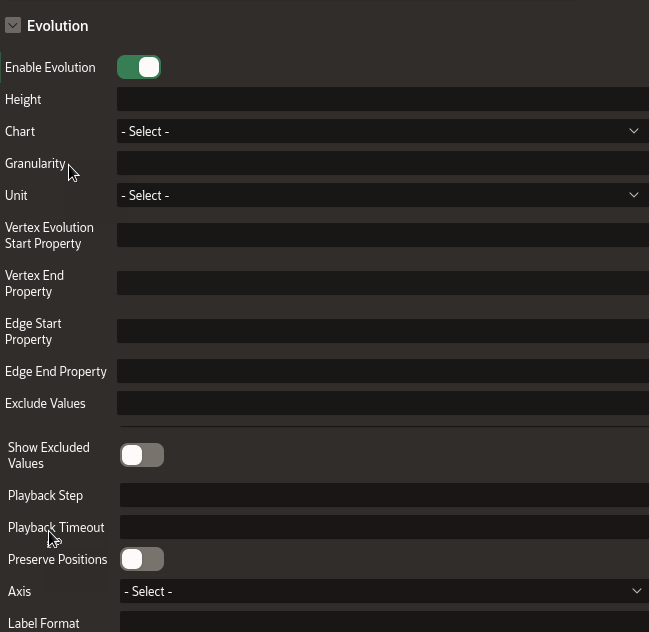
The Evolution panel appears as shown:
The following table describes the attributes in the Evolution panel:
| Attribute | Description |
|---|---|
| Enable Evolution | Switch on this toggle to enable network evolution in the graph visualization. |
| Height | Specify the height of the chart. |
| Chart | Select the chart type - Bar or Line. |
| Granularity | Specify the aggregation granularity for the input unit. |
| Unit | Select the unit of time for the increment. |
| Vertex Evolution Start Property | Select the name of the property to use for the vertex
filtering.
The time frame for the graph will be after the Vertex Evolution Start Property. |
| Vertex End Property | Select the name of the property to use for the vertex
filtering.
The time frame for the graph will be before the Vertex End Property. |
| Edge Start Property | Select the name of the property to use for the edge
filtering.
The time frame for the graph will be after the Edge Start Property. |
| Edge End Property | Select the name of the property to use for the edge
filtering.
The time frame for the graph will be before the Edge End Property. |
| Exclude Values | Specify one or more values to be excluded. |
| Show Excluded Values | Enable this toggle if you wish to display the excluded values. |
| Playback Step | Specify a value to determine how often does the playback advance in ms. |
| Playback Timeout | Specify a value to determine how many steps are taken per time out during playback. |
| Preserve Positions | If switched on, network evolution will keep the original vertex positions of the graph during playback. |
| Axis | Select one of the supported values - vertices, edges, or both. |
| Label Format | Specify a string that represents the format in which the date must be displayed. Note that the format must include either YYYY, MM, or DD. Otherwise, the format will be ignored. |
