Enable Tracing to Monitor Endpoint Calls
When your application contains one or more business objects, enable tracing of an object's endpoint requests to diagnose performance bottlenecks.
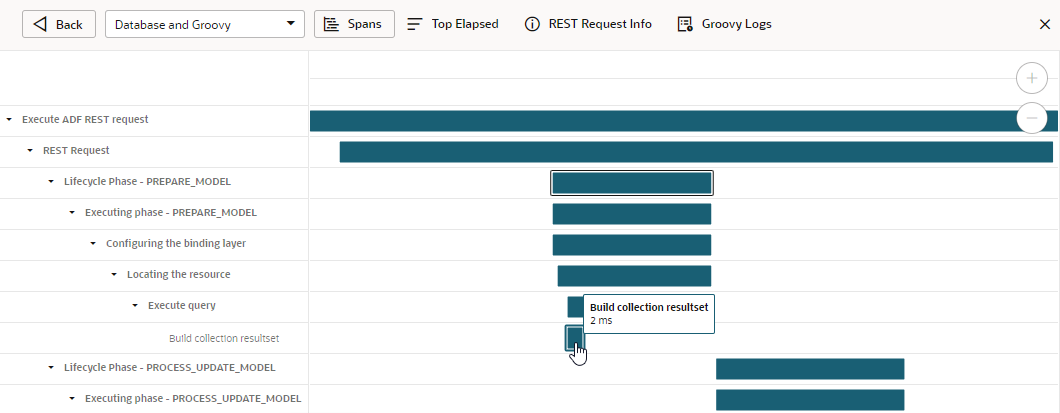
Tracing tracks all REST requests made when the current user executes CRUD operations or invoke functions on business objects. It provides a visual representation of the operations taking place and the time it took to invoke each REST call—information you can use to locate bottlenecks in your application. You also enable tracing separately for a particular version of your application (development, stage, or live), so you can isolate issues in that version and fine-tune your app for better performance.
To enable tracing for an application:
View Trace Details
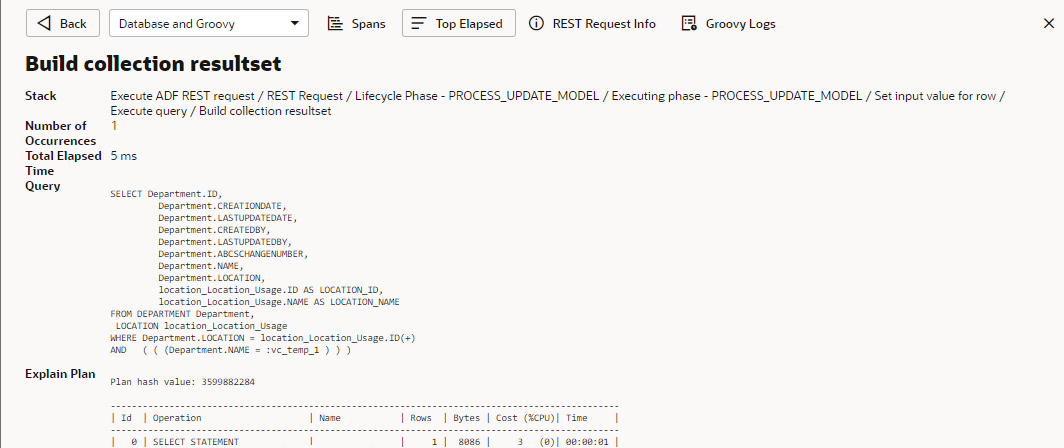
You can view a particular REST request's trace for details such as span data and elapsed time. Each trace consists of one or more spans and you can drill down an individual trace to view its root span, which is the beginning of a transaction. You can also view Groovy logs if you included the print or println function in custom Groovy code.
To view details of an individual trace:
Manage Tracing to Control Disk Usage
When tracing is enabled for an app, all its trace files are stored on Visual Builder server. To avoid disk-usage issues on the server's file system, Oracle sets a maximum disk space limit for all trace files. Once this limit is reached, the oldest trace files are removed to make way for new trace files.
- Deselect Enable Tracing to pause tracing. Use this option to control the accumulation of trace files when you're not actively tracking your app's REST calls.
- Click the Export icon (
 ) to export the trace files for an individual REST call. Use this option to save the files to your local file system and import it later when required. This way, you won't lose the data even if trace files hit the server's disk-usage limit.
 - Click the Delete icon (
 ) to delete trace files for individual REST calls. Use this option to remove trace files you don't need and clear up space.
 - Click Clear to remove all trace files for the app's current version. Use this option to delete tracing data for a particular version of an app. For example, when you're more interested in data for the staged and live versions of an app, you can clear trace files for the development version to remove previous data that might be taking up disk space on the server.
Export and Import a Trace File
You can export a particular REST call's trace files to your local file system to avoid losing data if the server reaches its disk-usage limit for trace files. Then, when you are ready to analyze the data, you can import the file back in to Visual Builder. Importing a trace file is a browser function that doesn't affect disk usage on the server.


