Track Instances in a Project

You can filter and track the status of integration instances through business identifiers. You can also view the activity stream and message payload of an instance you are tracking and replay integration instances configured as replayable.
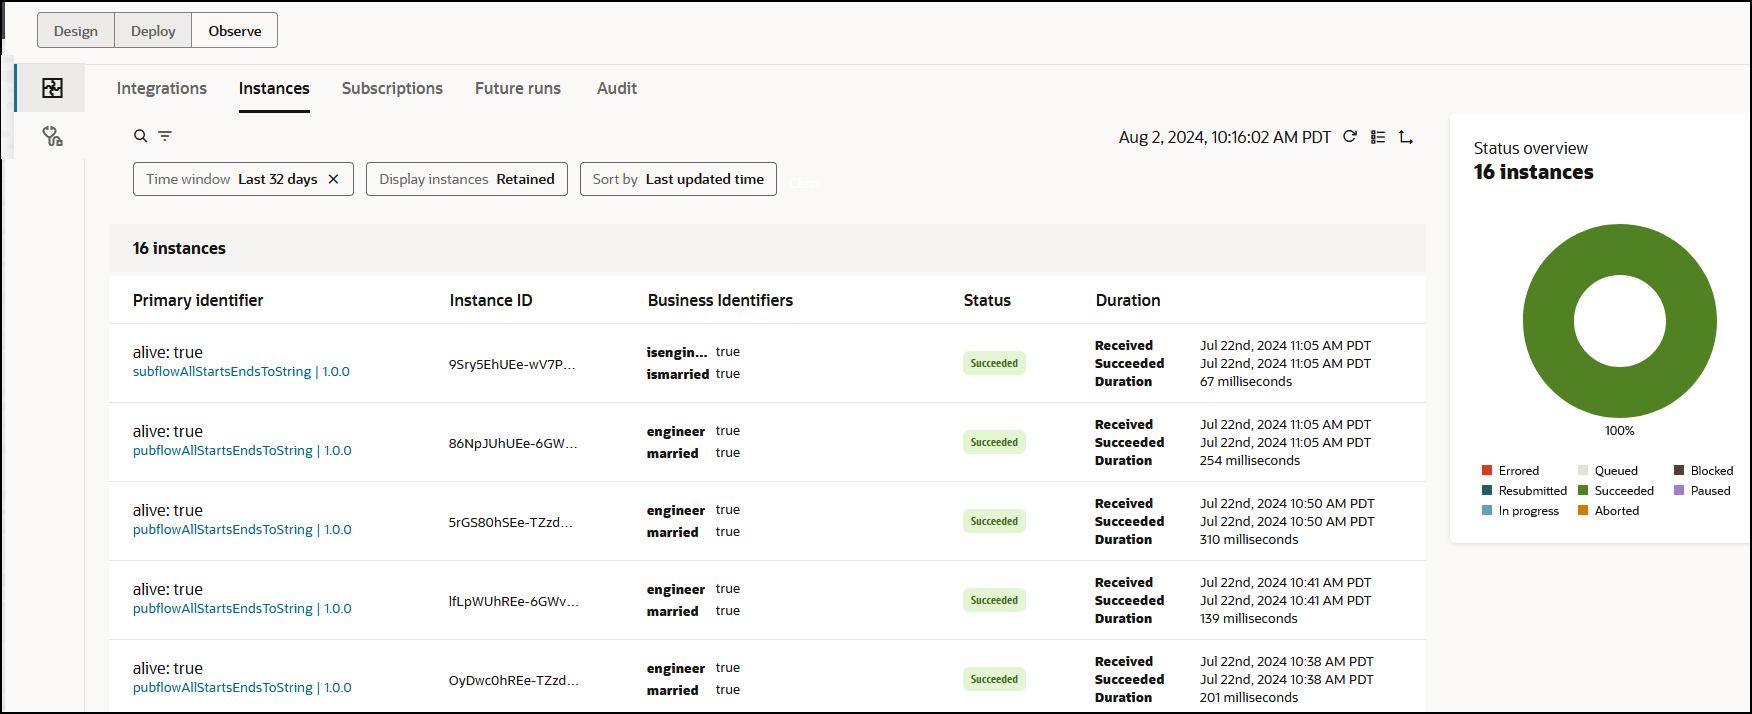
  1. In the navigation pane, click Projects.
  2. Click the project name or click Edit Edit icon.
  3. Click Observe.
  4. Click Instances.
    The status of each integration instance is displayed in a graph. Each potential integration status is identified by a specific color.
  5. View a specific status of your integration instances (for this example, Succeeded) in either of the following ways:
    1. View the graph to identify if there are successfully completed instances and click that part.
    2. Select Succeeded from the Status field in the Filter Filter icon icon.

      The page for a specific project shows the Design, Deploy, and Observe tabs. Below are Integrations, Instances, Subscriptions, Future runs, and Audit tabs. Below are search and filter icons. Below is a field that shows the latest filter settings. At the far right is the time stamp and refresh button. Below all these buttons and icons is a table with columns for Primary Identifier, instance ID, Business Identifiers, Status, and Duration. The table is populated with instance details. At the far right is a graph that shows the state of instances: Successful, Aborted, Queued, Blocked, Errored, In progress, Paused, and Resubmitted.

  6. Hover over the row of an integration instance and click View Details View details icon to access the activity stream.
  7. Click Download Download icon to download the logs. The Oracle Cloud identifier (OCID) value of your service instance is also included in the logs.
  8. Hover over the row of an integration instance and click Actions Actions icon, and then Run again to replay REST Adapter-triggered and AS2 Adapter-triggered integration instances configured as replayable. This feature is available both inside and outside of projects. See Capabilities and Restrictions and Understand the Differences Between Replaying and Recovering Instances.
  9. Hover over the row of an integration instance and click Actions Actions icon, and then View Child Instances to display child instances invoked by parent instances.
  10. To the right of the time stamp, click Chart View Chart view icon.
    1. View time lines for instances grouped by integration. The scale is shown in minutes by default.
      The following icons are displayed:
      • Bar icon: Indicates an instance has completed.
      • Diamond icon: Indicates an instance is incomplete (for example, has not started or is still running).
    2. Hover over either icon to display details such as instance ID and time stamp.
    3. Click Seconds to show the scale in seconds.
    4. Click Expand to show where there is overlap between completed instances and incomplete instances.
    5. Click Collapse.
  11. Click Back Back icon to return to the Observe tab.