Monitor the Message Processing Status of Integrations in Projects

You can view the message processing status of your running integrations in a project, including how many messages have been received and processed, how many successful messages and errors have occurred, and how many messages have been canceled. You can also view aggregated instance metrics for the selected integration.

  1. In the navigation pane, click Projects.
  2. Click the project name or click Edit Edit icon.
  3. Click Observe.
  4. Click Integrations.

    The Design, Deploy, and Observe tabs appear. Below are the Integrations (selected), Instances, Subscriptions, Future runs, and Audit tabs. The filter for this page is displayed below. A table with columns for Name, Received, Processed, Succeeded, Errored, Aborted, and Last scheduled by.

  5. Click Filter Filter icon, then select the time window, integration status (active, configured, activating, failed, or all), and integration style (application, schedule, or event). You can also specify a custom time range to filter the search for integrations under Date range with the From and To buttons.
  6. Click numbers in the Received, Processed, Succeeded, Errored, and Aborted columns to access the list of instances in those states on the Instances tab of the project. If you click the Received number, instances are displayed based on their creation date. All other clickable numbers are sorted by their last updated date.
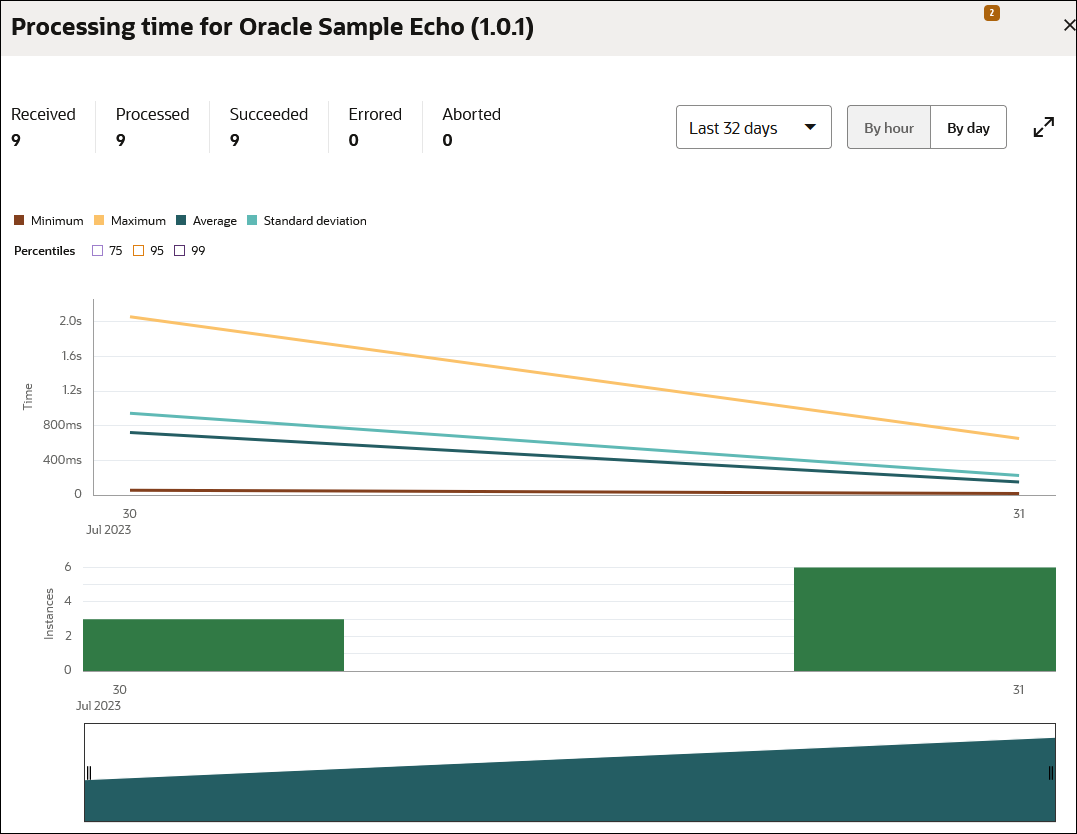
  7. Hover over a row for an integration and click View statistics View statistics to show aggregated instance metrics for the selected integration. For information about using the Statistics page, see Step 6 in Monitor the Message Processing Status of Integrations.


    The Statistics page shows the number of Received, Processed, Succeeded, Errored, and Aborted instances. Last 32 days is selected. There are also buttons for Hour and Day. Below are clickable colors for Minimum, Maximum, Average, and Standard deviation. Below this are buttons for 75 Percentile, 95 Percentile, and 99 Percentile. A graph shows the times and days for instances. Below this is another graph that shows instance counts and days. Below this is another graph for days.