Adding an Aggregation Statement (Release 9.2.7)
Use the aggregation statement in your logic extensions to aggregate data that is read from EnterpriseOne tables. In addition to reading data from EnterpriseOne tables, you can perform functions such as sums, averages, counts, and minimum or maximum values. These aggregated results can then be used in subsequent operations within the logic extension or passed as output to the next step in an orchestration.
To add an aggregation statement:
- On the design panel, hover over the location where you want to add an aggregation statement and then click the + icon.
- Select Aggregation from the Action menu. The system displays an Aggregation
statement along with the branch label in the design panel and an Aggregation panel
on the right.
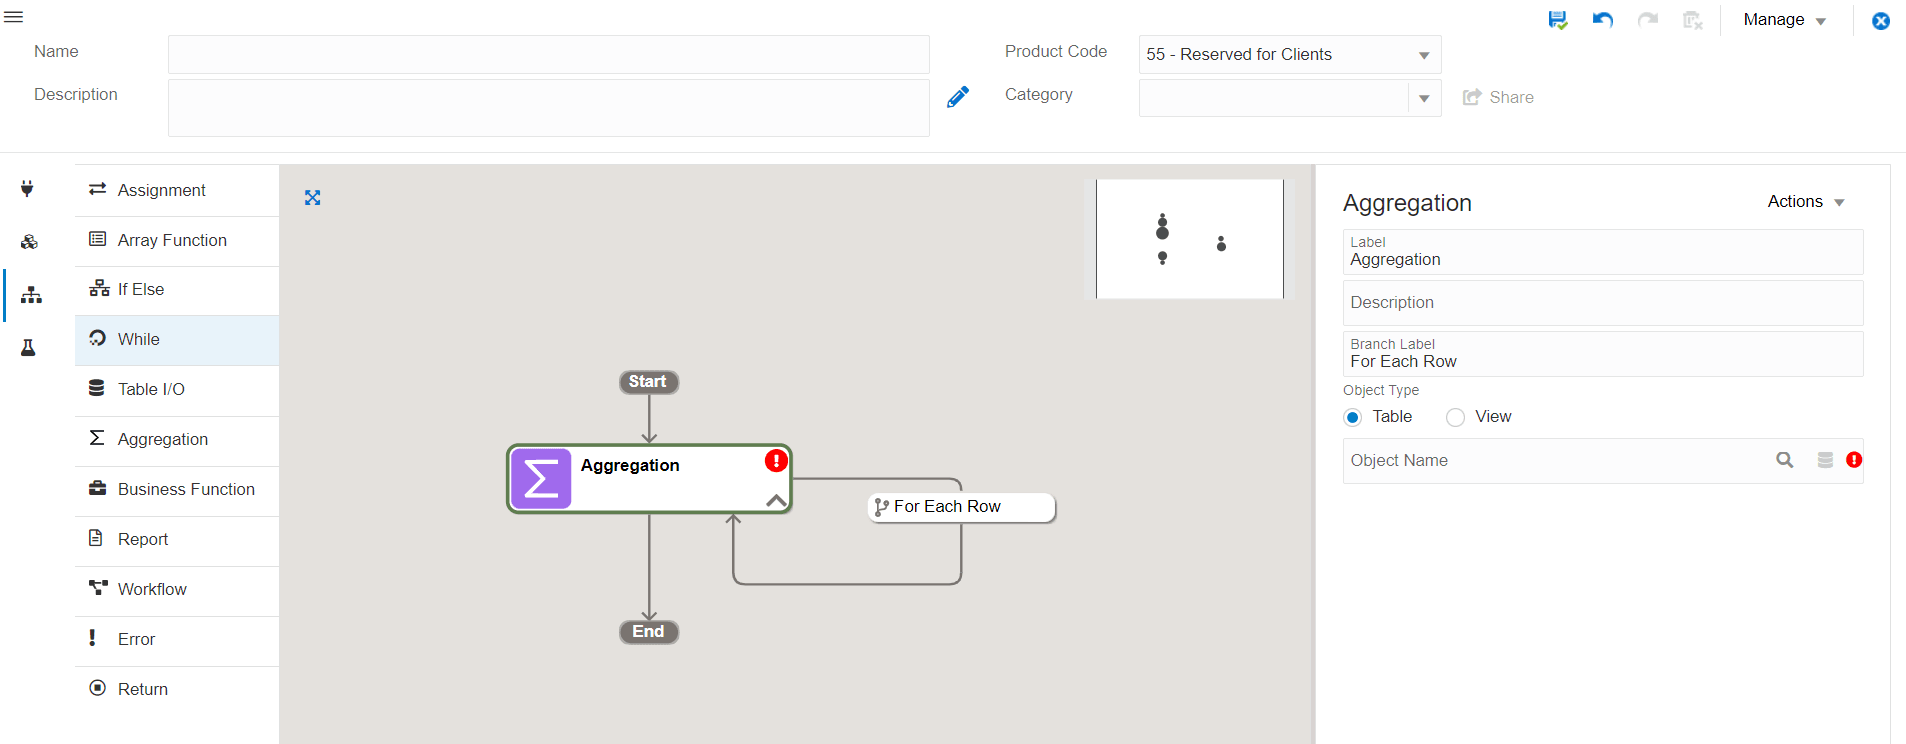
- In the Aggregation panel, change the label and description.
- In the Branch Label field the
For Each Rowvalue is displayed by default. This is an editable field. If you change the value in this field, the value in the branch label in the design panel will also change automatically. - Select the Object Type as:
- Table: If you select this option, you can enter the table name in the Object Name field or search for and select the table name.
- View: If you select this option, you can enter the business view in the Object Name field or search for and select the business view. The system also enables you to search for the business view using the application name. When you select View, the Get View from Form icon is enabled. Click this icon and enter the application name in the Application field to search and select the required form and business view.
- Click the Launch Column Mapping Builder icon next to Column Mapping.
The system displays the Assignment Builder window containing these two panels:
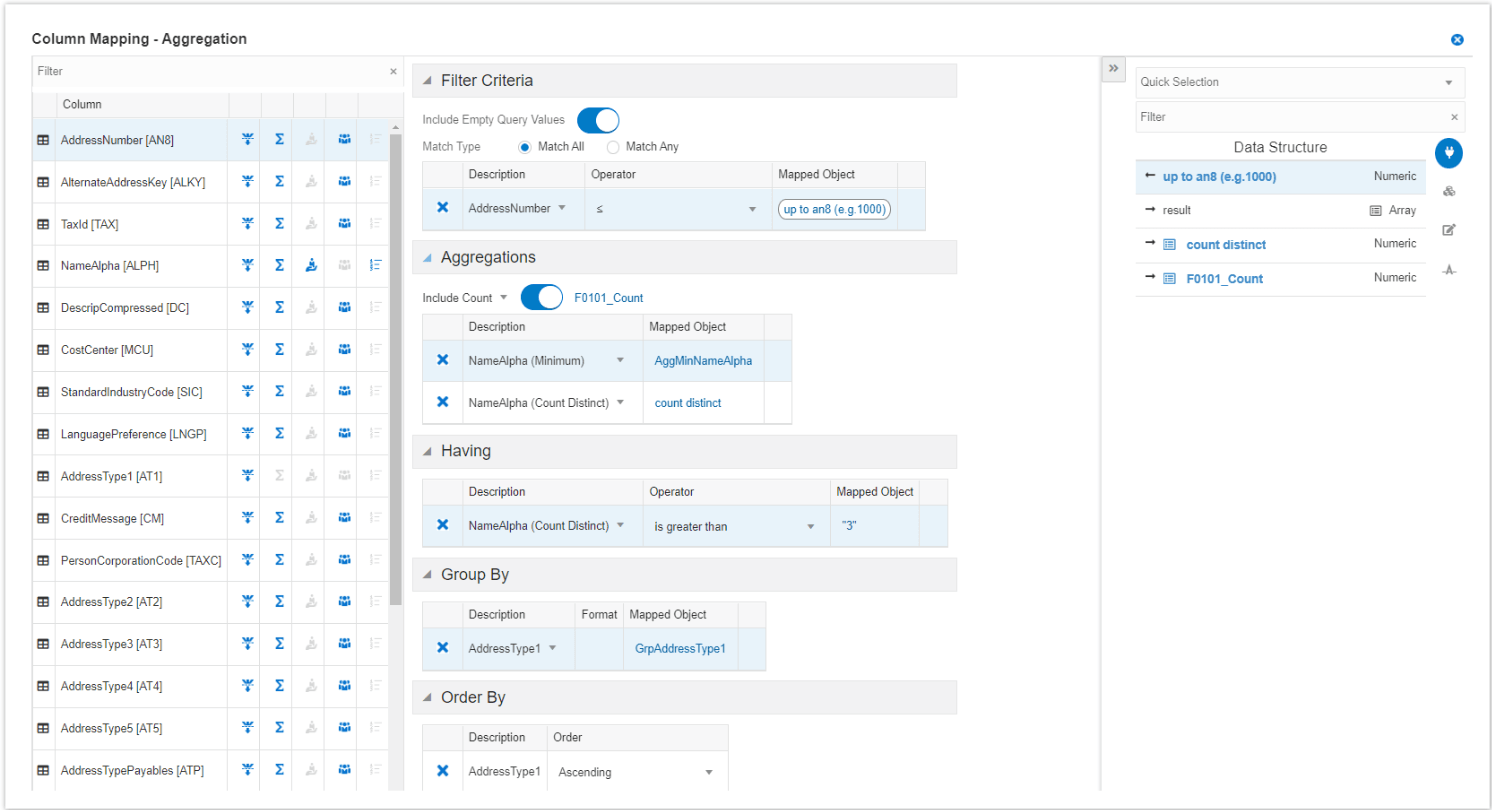
- Column Mapping - Aggregation Panel (left panel): Displays a grid with the
Filter field where you can filter the columns. The following icons are
displayed for each column in the grid: Filter, Aggregation, Having, Group
By, and Order By. You can also see the corresponding sections next to the
grid. These sections are empty by default. The system populates these
sections based on your selection for a column in the grid.
You can click the drop-down menu in the Description field in all the sections (except in the Order By section) and select Add to Data Structure, Add to Variables, or Add to Array option. Click the X icon in the rows to remove a clause.
- Filter Icon:
The Filter icon is enabled by default for all the columns. You can click the Filter icon to add a column to the left operand (Description field) in the Filter Criteria section. You can filter and add the same column multiple times and define multiple criteria.
Filter Criteria Section
The Filter Criteria section contains a table with Description (read-only), Operator, and Mapped Object fields.
- The Include Empty Query Values option is enabled by default. Disable this option if required.
- Select the Match All (selected by default) or Match Any option.
- Select Operator from the drop-down menu. This is a required
field.Note: This table lists the data types and its supported operators in the Filter Criteria section.
Data Type Supported Operators/Math Comparisons String
is equal to, is not equal to, starts with,
                                                  ends width, contains, is between, is in list, is
                                                  less than, is less than or equal to, is greater
                                                  than, and is greater than or equal to
If the Include Empty Query Values option is enabled, the system supports these two operators along with the above operators:
is blank and is not blank.UTime
=, !=, <, <=, >, >=, is in
                                                  list
(between operator is not supported for UTime)All other data types
=, !=, <, <=, >, >=, is between,
                                                  is in list
For
in betweenoperator, the system the displays the Minimum Value and Maximum Value fields for mapping.For
is in listoperator, the system enables you to add multiple mappings.For
is blankandis not blankoperators, the system will not display any field for mapping. -
Click the Edit icon in the Mapped Object field. The system displays the Object Selector panel on the right. Use this panel to map the values.
Starting with Tools Release 9.2.9.3, the system enables comparing two columns for the filter condition of the aggregation statement. For example, Request Date > Promised Delivery. When you select the Operator value as =, ≠, >,≥,<, ≤, the system displays a Columns tab.
Note: This is applicable to both Table and View object types.Similar types of columns are available for mapping in the Columns tab. For example, you can map two columns with the same data type, such as date, number, text, or Utime. Click the column to select it. The selected column is displayed in the Mapped Object field.
In the Columns tab:
-
If the first operand (Description field) is a number type column, the system displays a list of columns that are filtered to match the data type and decimals of the first operand.
Note: The system excludes the columns with the different display decimals. -
If the first operand (Description field) is a non-number type column, the system displays a list of columns that are filtered to match the data type of the first operand.
Note: The second operand (in the Mapped Object field) is reset to the default value by the system whenever you change the operator to a value other than =, ≠, >, ≥, <, or ≤. -
- Aggregation Icon
The Aggregation icon is enabled by default for all the columns. This icon is disabled the Group By icon is selected.
The system displays the following options when you click the Aggregation icon:- Non-number type column: Sum, Average, Sum Distinct, Average Distinct, Minimum, Maximum, and Count Distinct.
- Number type column: Minimum, Maximum, and Count Distinct.
Note: You can select the aggregation options such as Sum, Average, Sum Distinct, and so on only once for a particular column. For example, if you have already selected Sum for a column, the system will not display the Sum option again when you click the Aggregation icon for that column. You can select from the remaining options. - Aggregations Section
The options selected for the columns using the Aggregation icon are displayed in this section. For example, if you select the Minimum option for the LineNumber column, the system displays
LineNumber(Minimum)in the Description field in the Aggregations section. This section contains Description and Mapped Object fields.- The Include Count option is disabled by default. You can choose to enable this option and then click Edit to create mapping it to a number type data structure or a variable using the object selector panel (right panel). The system displays a validation error if you have enabled this option without mapping. You can click the drop-down menu next to the Include Count field and select Add to Data Structure, Add to Variables, or Add to Array option.
- Click the Edit icon in the Mapped Object field for each row and map the objects by selecting the values from the right panel.
- Having Icon
The Having icon is disabled by default for all the columns. It is enabled for a column that has an aggregation value. The context menu options displayed when you click the Having icon depends on the values you have selected for your aggregation clause. For example, if you have selected Minimum and Maximum as your aggregation clauses, the system displays the Minmum and Maximum options when you click the Having icon.
Having SectionThis section is similar to the Filter Criteria section, and it contains Description (read-only), Operator, and Mapped Object fields. You can click the Edit icon in the Mapped Object field and map the values using the right panel.
- Group By Icon
The Group By icon is enabled by default for all the columns, and it is disabled if a column is already included in the Aggregation section or Group By section.
Group By SectionThe Group By section contains a table with Description (read-only), Format (required field for date type column), and Mapped Object fields. The available formats for date type format are: yyyy-MM-dd, Year, Year-month, and Calendar Quarter. Use the right panel and select the mappings for the Mapped Object field.
- Order By Icon
The Order By icon is disabled by default for all the columns. This icon is enabled if:Order By Section
-
an aggregation combination is included in the Aggregation dection but not in the Order By section.
-
or a single column is already included in the Group By section and not in the Order By section.
The Order By section contains the Description (read-only), and Order (required) fields. From the Order drop-down menu, select the Ascending or Descending option.
-
- Filter Icon:
- Object Selector Panel (right panel): Filter and select the mappings using this panel. You can click the Close or Open icons to hide or view this panel.
- Column Mapping - Aggregation Panel (left panel): Displays a grid with the
Filter field where you can filter the columns. The following icons are
displayed for each column in the grid: Filter, Aggregation, Having, Group
By, and Order By. You can also see the corresponding sections next to the
grid. These sections are empty by default. The system populates these
sections based on your selection for a column in the grid.
- Click Close. All the mappings are displayed in the Aggregation panel.
- Click Save.