Using the Document Contents pane
Document Contents is a task pane in the Smart View Panel that provides a view of—and allows you to perform actions on—the content existing in the current Office document.
The Document Contents pane displays Office objects in a tree format, allowing you to easily see and interact with the content in a workbook, presentation, or document, regardless of the provider or type of content and including content from extensions. Content is displayed based on the provider connection, or the document layout on sheets, slides, or pages.
Use the drop-down selection list to choose from content in your workbook. The drop-down list in Figure 16-1 shows a workbook with connections to on-premises Essbase and Planning using a shared connection. A third connection is shown to on-premises Oracle Business Intelligence Enterprise Edition using a private connection.
The drop-down list for the workbook in Figure 16-1 displays the content for the shared connection sheets, and options for viewing the content on the private Oracle BI EE connection sheet.
Figure 16-1 Document Contents Pane Showing the Drop-down List
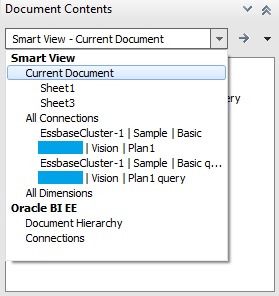
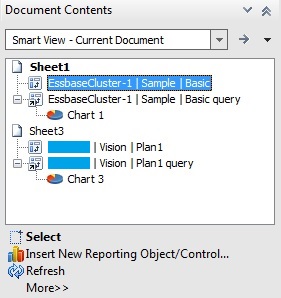
Assuming Sheet1 is open, select Current Document in the Document Contents list. The content list changes to show that Sheet1 contains Essbase ad hoc grid, ad hoc query and chart, while Sheet3 contains Planning grid, ad hoc query and chart.
Figure 16-2 Document Contents Pane Showing the Content of Sheet1 and Sheet3

To switch the view to Oracle BI EE, select Document Hierarchy under Oracle BI EE and the content view changes. Figure 16-3 shows an example of Oracle BI EE content in the Document Contents pane.
Figure 16-3 Document Contents Pane Displaying Oracle BI EE Content
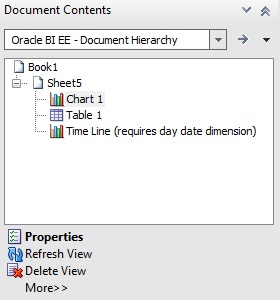
Depending on the provider, you can perform a subset of tasks on selected objects from the Document Contents pane.
-
For most providers, you can Select, Refresh or Delete content on a sheet, slide, or document.
-
For most providers, you can insert reporting objects, and perform other tasks.
-
For Oracle BI EE providers, you can perform additional tasks on individual views; for example, you can Mask a view, or review the properties of a view.
For example, in Figure 16-6, Sheet1 shows the Oracle Essbase ad hoc grid, ad hoc query and chart. You can also see the same artifacts on Sheet3 for Planning, but we're focusing on Sheet1. With the Sheet node selected for Sheet1, the Refresh and Sheet Information options appear at the bottom of the Document Contents pane.
Figure 16-4 An Essbase Ad Hod Grid with the Sheet Node Selected in Document Contents
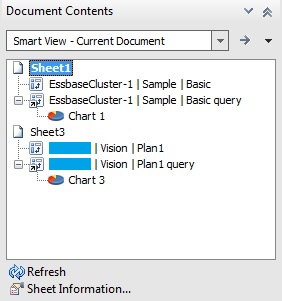
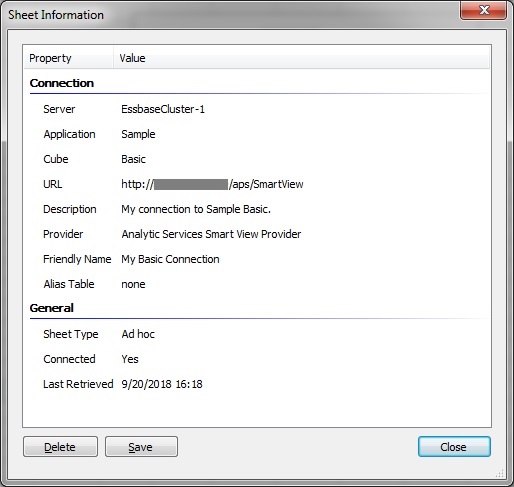
Click Sheet Information to view the Sheet Information dialog box (Figure 16-5), where you can also choose to Save or Delete metadata for the sheet or workbook.
Figure 16-5 Sheet Information Dialog Box for an Essbase Ad Hoc Grid
Select the object node in Document Contents, and the context changes showing the Select, Insert New Report Object/Control, Refresh, Modify Connection, and Delete options at the bottom of the pane (Figure 16-6).
Figure 16-6 An Essbase Ad Hoc Grid Selected in Document Contents
In general, content is grouped by Oracle Smart View for Office providers (Essbase, Oracle Hyperion Financial Management, Oracle Hyperion Planning, and Oracle Hyperion Reporting and Analysis). Content from Oracle BI EE is grouped separately. In workbooks containing multiple objects from different data sources, you can switch the view using the Document Contents drop-down menu shown in Figure 16-7.
Figure 16-7 Available Options in Document Contents Drop-Down Menu

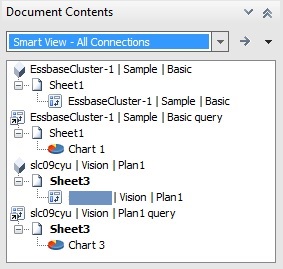
Select the All Connections option and the Document Contents view changes to show objects sorted by provider (Figure 16-8).
Figure 16-8 Smart View Provider Content Listed by Provider in Document Contents
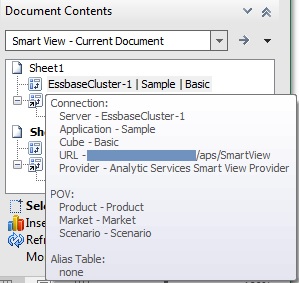
For Smart View provider content, such as Planning or Essbase objects, you can click in the tree area of Document Contents and then hover over an object icon to view connection properties, such as Server, Application, Cube, URL, Provider, POV and Alias Table, as shown in Figure 16-9. Properties vary depending on the provider.
Figure 16-9 Connection Properties of an Essbase Ad Hoc Query
For Oracle BI EE content, select an Oracle BI EE object, and then use the Properties link at the bottom of Document Contents to launch the View Properties dialog, where you can view connection and other properties (see Figure 16-3).
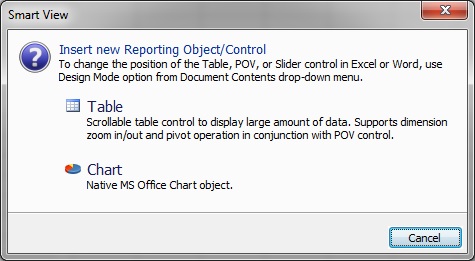
For some providers, such as Essbase and Planning ad hoc, you can insert reporting objects such as a table native Office chart based on an ad hoc query or grid object. Select the grid or query object in Document Contents, and then select Inserting Reporting Object/Control. You are prompted to choose from Table or Chart:
Note:
When inserting 3-D charts for large datasets (for example, more than 3,000 cells) from the Document Contents pane, Microsoft Office consumes large amounts of memory and may fail.
To avoid this issue, Smart View renders the chart as 2-D.
For Smart Slices and Oracle Hyperion Financial Reporting, you can insert reporting objects such as function grids and slider controls. Refer to the following for more information on inserting these types of reporting objects from Document Contents: