Statistics Tab
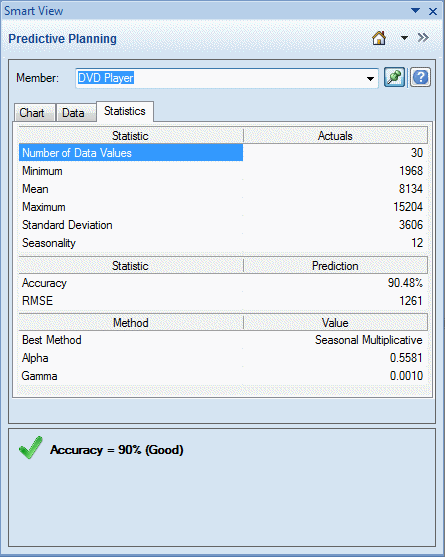
The Statistics tab shows several statistics about historical data used to generate the prediction: number of values, minimum value, mean value, maximum value, standard deviation, and the period of seasonality if present (Figure 2-3).
-
Number of data values—The number of historical data values in the date range
-
Minimum—The smallest value in the date range
-
Mean—The average of a set of values, found by adding the values and dividing their sum by the number of values
-
Maximum—The largest value in the data range
-
Standard deviation—The square root of the variance for a distribution, where variance measures the degree of difference of values from the mean
-
Seasonality—Whether the data has a detectable pattern (cycle) and, if so, the time period of that cycle
Figure 2-3 Predictive Planning Panel, Statistics Tab

The table also displays the following:
-
An accuracy value
-
The current error measure used to select the best time-series forecasting method (the default is root mean squared error, RMSE); see Time-series Forecasting Error Measures for a list.
-
The name of the best time-series forecasting method (Classic Time-series Forecasting, ARIMA Time-series Forecasting Methods)
-
The parameters for that method (Classic Nonseasonal Forecasting Method Parameters, Classic Seasonal Forecasting Method Parameters)
For more information about prediction accuracy, see Summary Area.