View Quality Information Using Interactive Quality Charts
Oracle Quality process control charts now provide enhanced interactive capabilities. You can use the following capabilities when viewing information in process control charts:
- Dynamic scaling of axes to view points between tight ranges
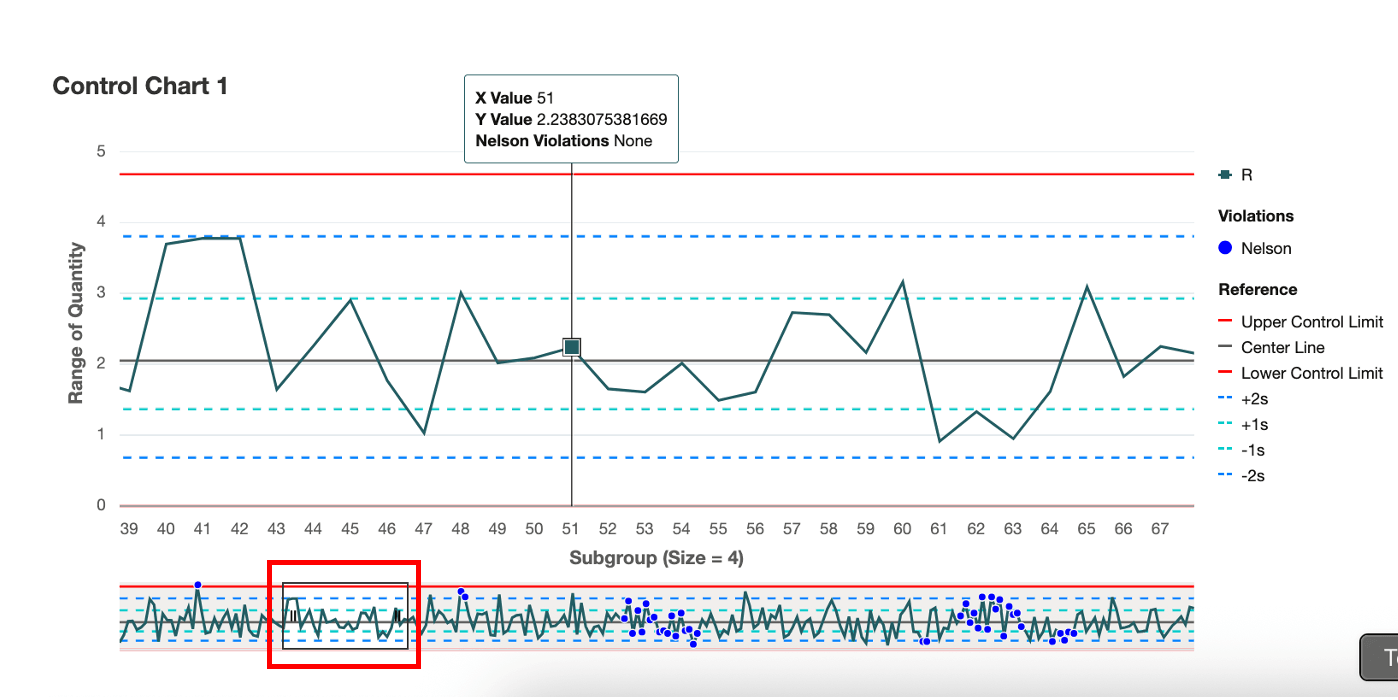
- Windowing of points to view and scroll chart windows through a specific range of data points
- Horizontal scrolling to view plots with bigger data sets
- Zoom in and zoom out capabilities
- Display of correlated data for Control charts
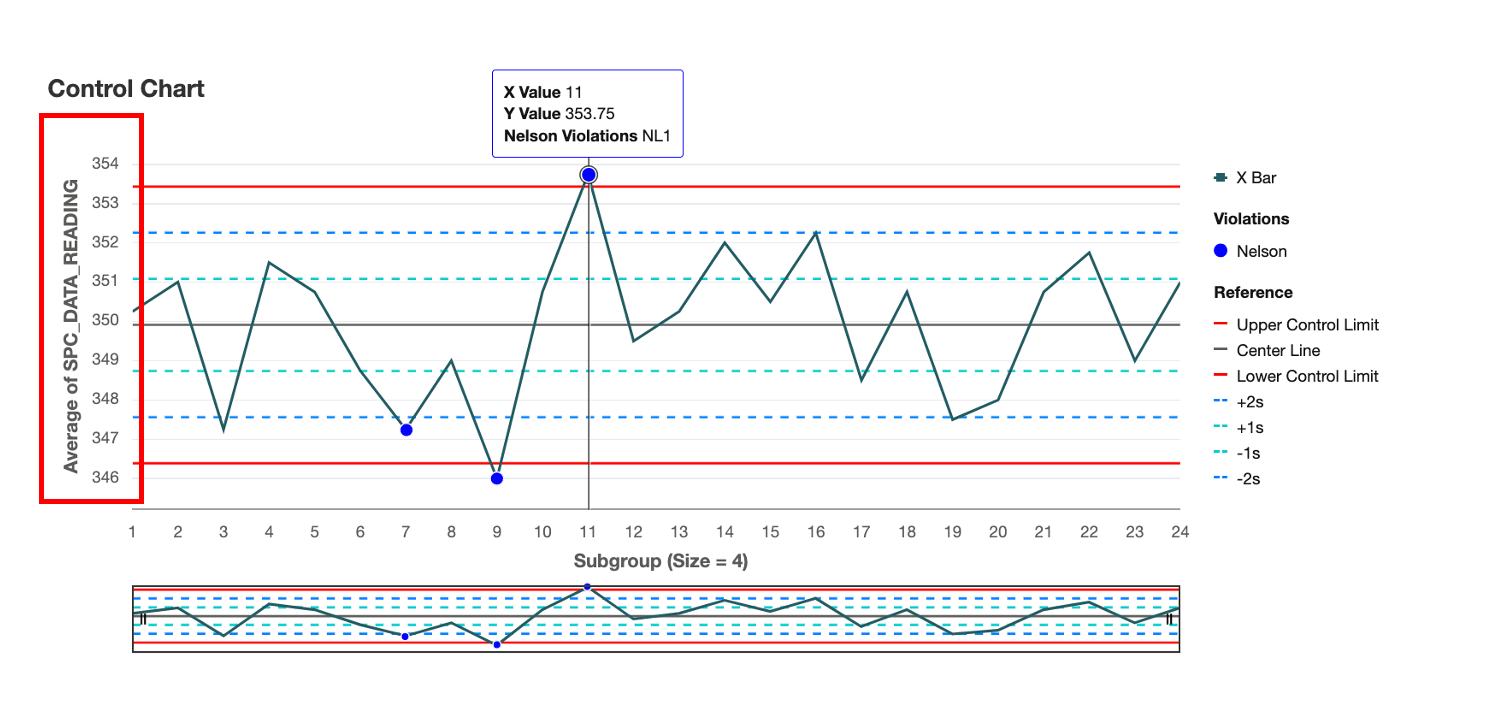
- Display of Sigma lines on Control charts
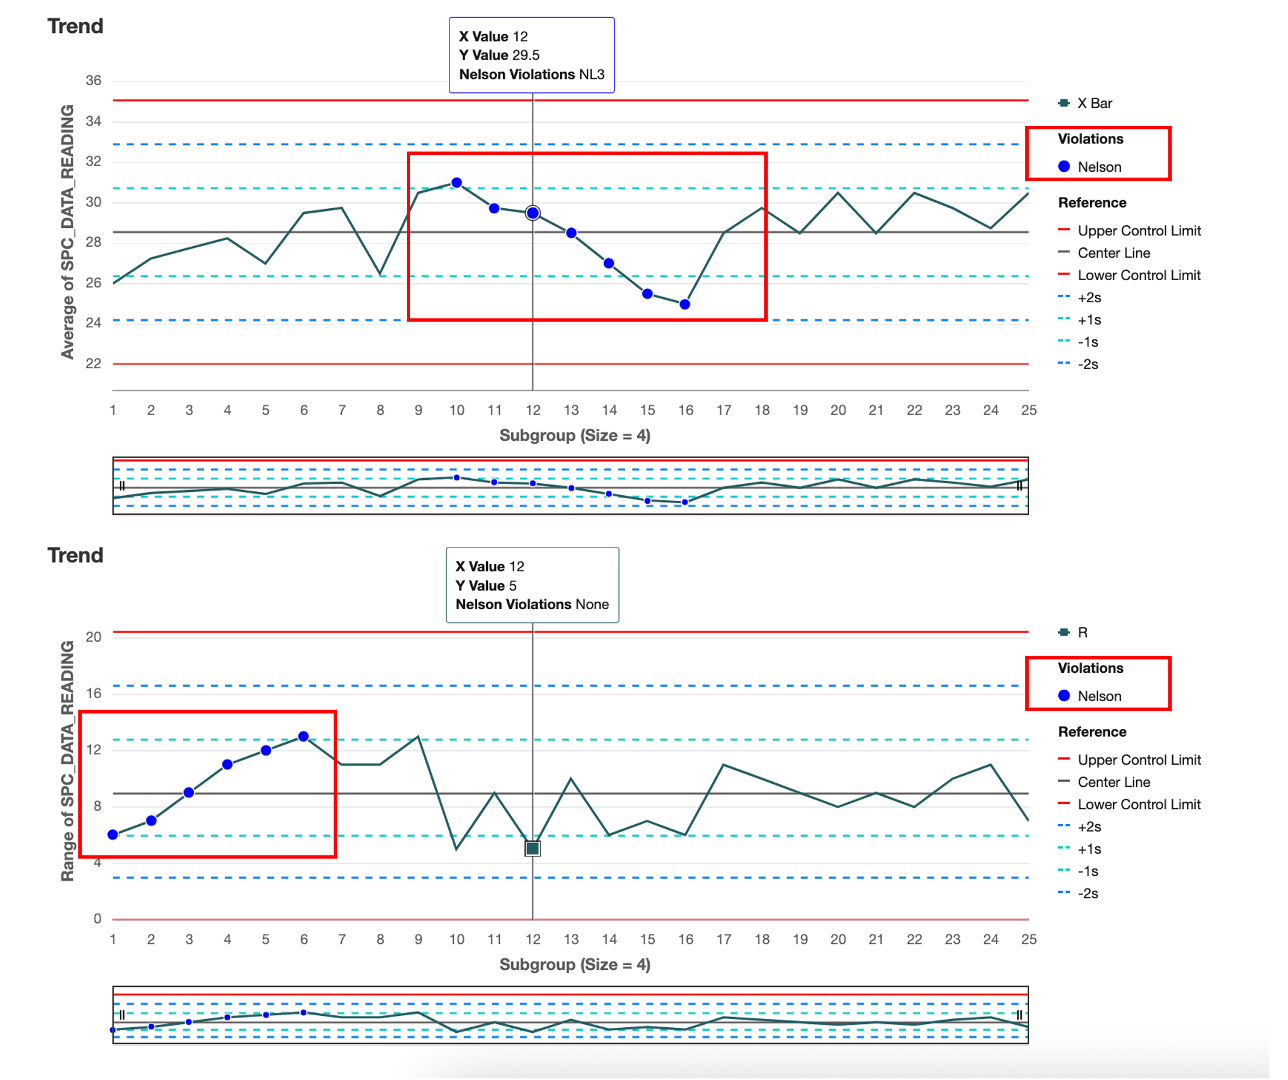
- Highlight data points with control rule violations based on Nelson rules
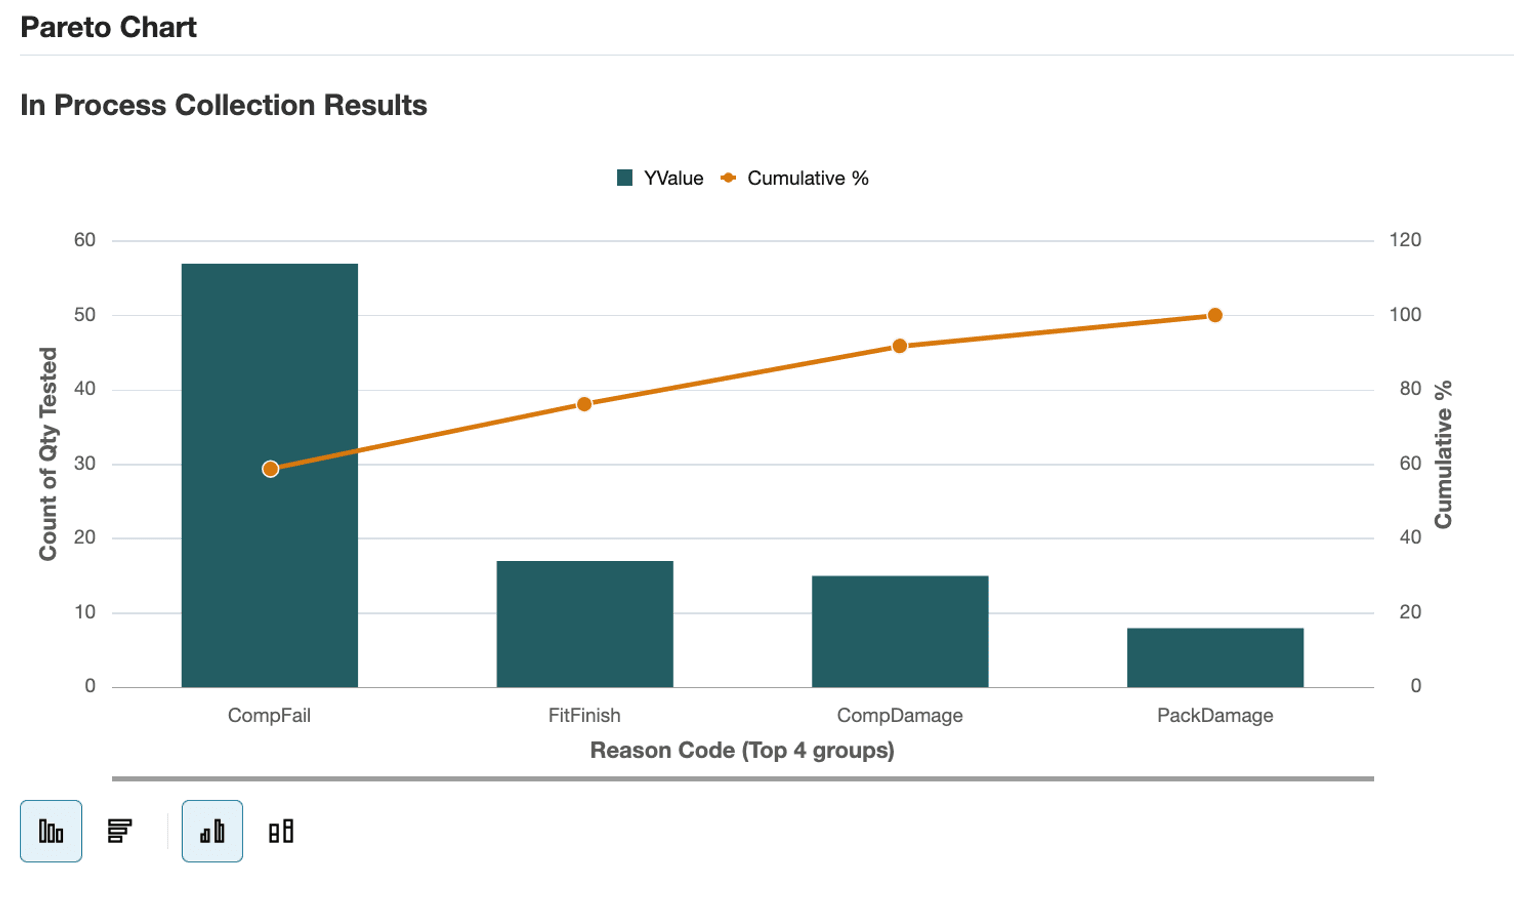
You can also view the display of cumulative functions on Pareto charts that are enhanced with zoom in and zoom out and horizontal scrolling.
Prior to Release 12.2.15, Oracle Quality charts were available with no interactive capabilities.
Dynamic Scaling of Axes
Horizontal Scaling
Control Charts with Nelson Rule Violations
Pareto Chart with Cumulative Function
Steps to Enable
You don't need to do anything to enable this feature.
Key Resources
- Oracle E-Business Suite News and Information: oracle.com/ebs
- Oracle E-Business Suite Product Documentation: https://docs.oracle.com/cd/E26401_01/index.htm
- Oracle University: https://www.oracle.com/education
- Oracle Support: https://www.oracle.com/support