Comparing Two Experiments with Synchronization Tracing
In this section you compare the two experiments. The test.1.er experiment was recorded with a calibrated threshold for recording events, and the test.2.er experiment was recorded with zero threshold to include all synchronization events that occurred in the mttest program execution.
-
Click the Compare Experiments button
 on the tool bar or choose File > Compare Experiments.
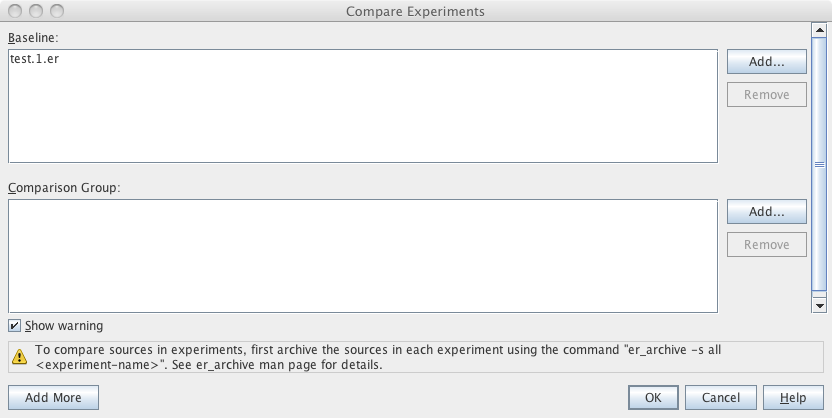
 The Compare Experiments dialog box opens.

The test.1.er experiment that you already have open is listed in the Baseline group. You must create a list of experiments to compare to the baseline experiment in the Comparison Group panel.
In this tutorial, each group contains only one experiment.
-
Click the Add button next to the Comparison Group, and open the test.2.er experiment in the Select Experiment dialog.
-
Click OK in the Compare Experiments dialog to load the second experiment.
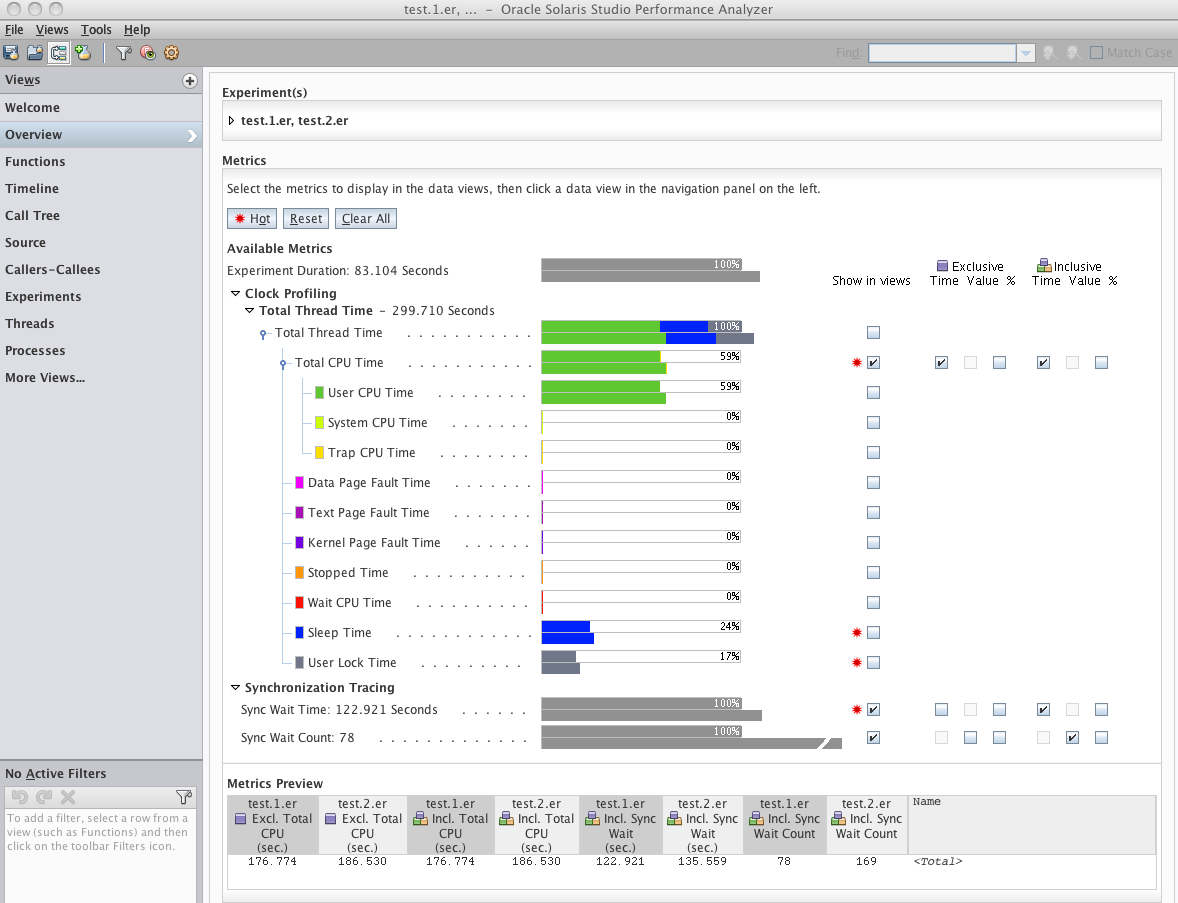
The Overview page reopens with the data of both experiments included.

The Clock Profiling metrics display two colored bars for each metric, one bar for each experiment. The data from the test.1.er Baseline experiment is on top.
If you move the mouse cursor over the data bars, popup text shows the data from the Baseline and Comparison groups and difference between them in numbers and percentage.
Note that the Total CPU Time recorded is a little larger in the second experiment, but there are more than twice as many Sync Wait Counts, and about 10% more Sync Wait Time.
-
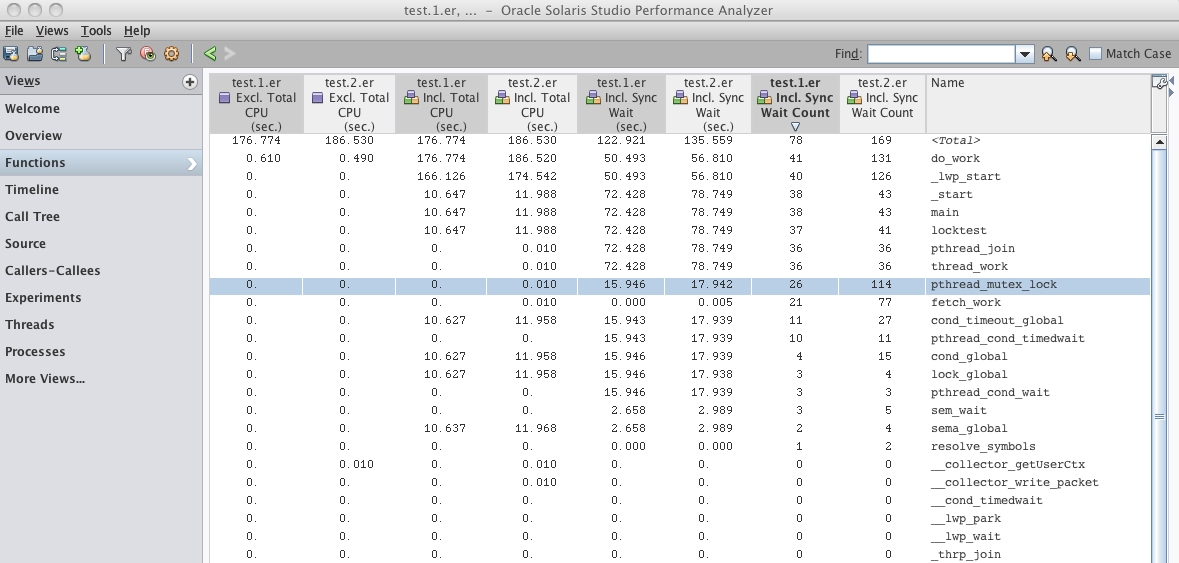
Switch to the Functions view, and click the column header labeled "test.1.er Incl. Sync Wait Count" to sort the functions by the number of events in the first experiment.

The function pthread_mutex_lock() shows the second largest discrepancy between test1.er and test.2.er in the number of events. The largest discrepancy is in do_work(), which includes the discrepancies from all the functions it calls, directly or indirectly, including pthread_mutex_lock().
Tip - You can compare the discrepancies even more easily if you change the comparison format. Click the Settings button in the tool bar, select the Formats tab, and choose Deltas for the Comparison Style. After you apply the change, the metrics for test.2.er display as the + or - difference from the metrics in test.1.er. In the preceding screenshot, the selected pthread_mutex_lock() function would show +88 in the test.2.er Incl Sync Wait Count column -
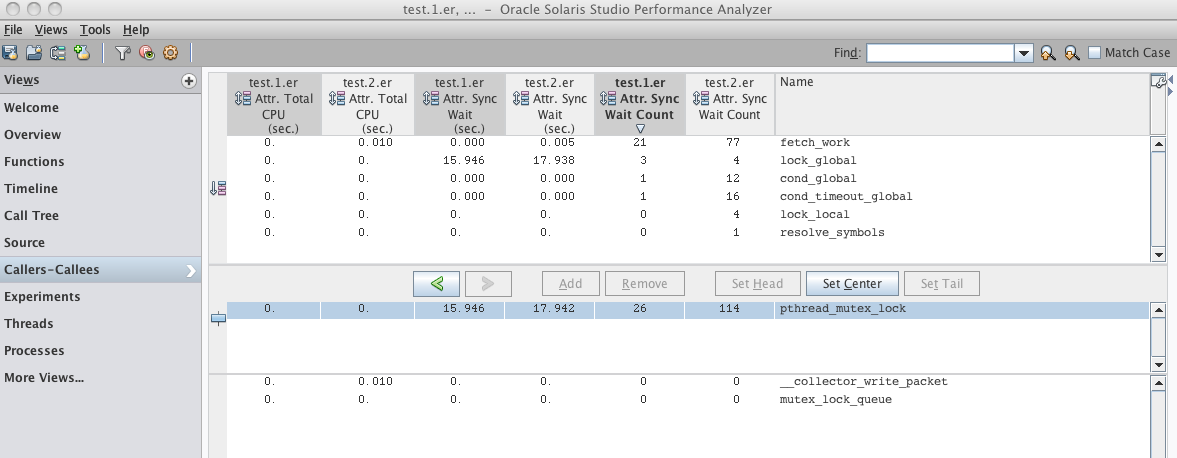
Select Callers-Callees view.

Look at two of the callers, lock_global() and lock_local().
The lock_global() function shows 3 events for Attributed Sync Wait Count in test.1.er, but 4 events in test.2.er. The reason is that the first thread to acquire the lock in the test.1.er was not stalled, so the event was not recorded. In the test.2.er experiment the threshold was set to record all events, so even the first thread's lock acquisition was recorded.
Similarly, in the first experiment there were no recorded events for lock_local() because there was no contention for the lock. There were 4 events in the second experiment, even though in aggregate they had negligible delays.