Release 11g (11.1.1)
Part Number E13881-02
Contents
Previous
Next
| Oracle Fusion Middleware Report Designer's Guide for Oracle Business Intelligence Publisher Release 11g (11.1.1) Part Number E13881-02 | Contents | Previous | Next |
A report consists of the following components:
Data Model
Layout
Properties
Translations
The first step in creating a new report is to select the source of the data for the report. A Data Model defines data that is used by a report. A Data Model may contain multiple data sets and it defines how data fields are structured in relation to each other. It may also contain parameters with lists of values, bursting definitions and other structures or properties that determine how data is provided to a report. Creating a data model is documented in the Oracle Fusion Middleware Data Modeling Guide for Oracle Business Intelligence Publisher.
The next step is to design a layout for the report data. The layout defines how the data is presented in the report. A layout consists of a template file and a set of properties for rendering the template file. BI Publisher supports templates created from a variety of sources including Microsoft Word, Adobe Acrobat, Microsoft Excel, Adobe Flash, and BI Publisher's own layout editor. A report can include multiple layouts.
Next, configure properties for the report. The report properties enable you to control many aspects of the report generation, formatting, and display.
Optionally, add translations for the report. BI Publisher's translation support enables you to include translations for individual layouts or for all translatable strings in the layout, data model, and the report metadata.
This chapter will describe the process of creating a report by selecting a data model, adding a layout, and configuring properties using the report editor. For more information about report components see the following:
| Topic | Where to get more information |
|---|---|
| Creating a data model | Creating Data Models, Oracle Fusion Middleware Data Modeling Guide for Oracle Business Intelligence Publisher |
| How to choose a template type | About the Template Types |
| Creating specific template types | Creating BI Publisher Layout Templates Creating RTF Templates Using the Template Builder for Word Creating RTF Templates Creating Excel Templates Creating PDF Templates Creating Templates Using the Excel Analyzer, Oracle Fusion Middleware User's Guide for Oracle Business Intelligence Publisher Creating Flash Templates Creating eText Templates |
| Translating reports | Translating Reports and Catalog Objects |
Creating a new report consists of the following steps. Each of these steps is discussed in detail in this section.
| Task | Section |
|---|---|
| Launch the Report Editor. | Launching the Report Editor |
| Select the data model. | Selecting the Data Model |
| Use the Layout Editor to create the layout or upload a template file. | Adding Layouts to the Report Definition |
| Configure the properties for the layout. | Configuring Layouts |
| Configure parameters for the report. | Configuring Parameter Settings for the Report |
| Configure report properties. | Configuring Report Properties |
| Add translations for your layouts. Complete this step if your report requires support for multiple languages. | Translation Support Overview and Concepts |
Launch the Report Editor in one of the following ways:
From the global header, click New and then click Report.
From the Home page, under the Create region, click Report.
After clicking one of the Create New Report selections you are prompted to select an existing data model.
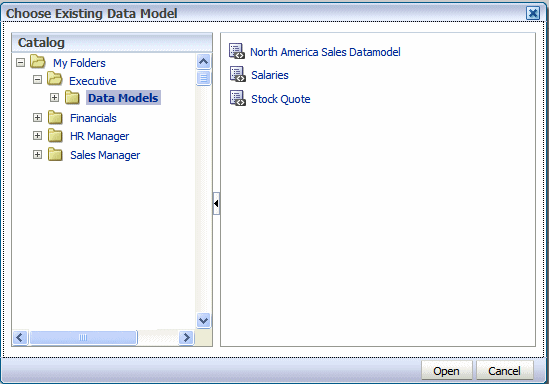
Navigate through the catalog and select the data model for your report.
Click Open to add the data model to your report.
If you have not already created the data model, click Cancel to close the Choose dialog. From the report editor, click the Create New Data Model button (see figure in next section) to launch the Data Model Editor. See Creating a Data Model, Oracle Fusion Middleware Data Modeling Guide for Oracle Business Intelligence Publisher for more information on creating data models.
After selecting a data model the Create Report page displays:
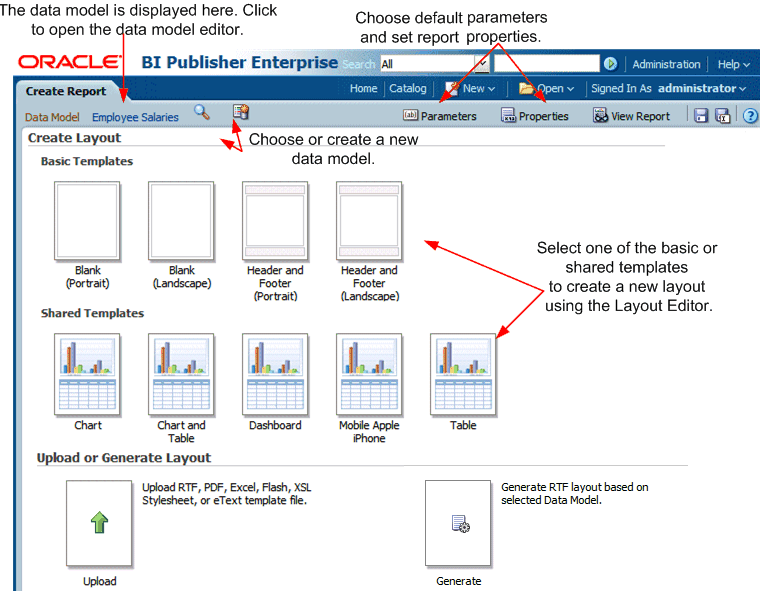
From this point you can:
add, upload, or generate a layout
configure the data model parameter defaults for this report
configure the report properties
This procedure addresses these options in the order listed.
There are three options for adding a layout to your report:
Create Layout - select one of the basic or shared templates to launch the Layout Editor.
Upload Layout - upload a template file layout that you have designed in one of the supported file types.
Generate Layout - automatically generate a simple RTF layout.
Under the Create Layout region, click one of the basic or shared templates to launch the Layout Editor.
Design the template. See Creating BI Publisher Layout Templates for information on using the Layout Editor.
When finished, click Save. In the Save Template dialog enter a name for this layout and select a locale. Click Save.
Click Return to return to the Report Editor.
Configure the settings for the layout. See Configuring Layouts.
Note that uploading a template file assumes that you have followed the instructions in this guide for creating a template file (RTF, PDF, Excel, Flash, or eText).
Under the Upload or Generate Layout region, click the Upload icon.
In the Upload dialog, perform the following:
Enter a Layout Name.
Click Browse to locate the Template File in your local file system.
Select the Template Type from the list.
Select the Template Locale from the list.
Click Upload.
If you are connected to BI Publisher through the Template Builder or Excel Analyzer, you can upload the layout file directly from either tool. See Creating RTF Templates Using the Oracle BI Publisher Template Builder for Word or Using the Analyzer for Excel, Oracle Fusion Middleware User's Guide for Oracle Business Intelligence Publisher for more information.
Under the Upload or Generate Layout region, click the Generate icon.
In the Autogenerate Layout dialog, perform the following:
Enter a Template Name for the layout.
Click Generate.
The autogenerate feature creates a simple table-based RTF layout that includes all the fields in your data model.
Important: The autogenerate layout feature can only be used with data sets for which metadata is available. Therefore this feature cannot be used with data sets generated from stored XML files, HTTP feeds, Web services, or migrated data templates.
After creating or uploading the layouts for your report, you can configure settings for the layout from the List View. The List View is shown in the following figure:

A style template contains style definitions that are applied to the paragraphs, headings, tables, and headers and footers of a report. A style template is optional and can only be applied to an RTF template file. For more information on creating a style template, see Creating and Implementing Style Templates.
If you wish to apply a style template to this layout, click Choose to browse for and select the style template. To then apply the style template to an individual layout in the list, select the Apply Style Template box for that layout in the list of properties.
Use the toolbar buttons to perform the following:
| Toolbar Button | Description |
|---|---|
| Create | Launches the add layout page to upload or create a new layout. |
| Edit | Launches the Layout Editor for the selected layout. This button is enabled for BI Publisher layouts (.xpt) only. |
| Properties | Launches the Properties page to enable the upload of localized templates and XLIFF files to associate with this layout. This button is enabled for RTF (.rtf) and BI Publisher layouts (.xpt) only. For more information on localizing templates, see Translation Support Overview and Concepts. |
| Delete | Deletes the selected layout. |
The List View enables you to configure the following settings for your layout:
| Setting | Description |
|---|---|
| Name | Place your cursor in the text box to enter a new name for the layout. |
| Template File | Displays the name of the file that was saved to the report definition. Click the template file name to download it. |
| Type | Displays the template file type. |
| Output Formats | Select the output types to be enabled for this layout. By default, all valid output types for a layout are enabled. The layout type determines the output types available. See Valid Output Types for Layout Types for the complete list. |
| Default Format | Select the default output format for this layout when viewed or scheduled. |
| Default Layout | Select the layout that this report will use by default when viewed online or scheduled. Only one box in this column can be checked. |
| Apply Style Template | Select this box to apply the style template to this layout. Note that a style template can only be applied to RTF template files. For more information, see Applying a Style Template to a Layout. |
| Active | By default a layout is active. Clear this box when you want to keep the layout as part of the report definition, but no longer make it available. When a layout is inactive it will not display in the report viewer or the scheduler. |
| View Online | By default, a layout is available for report consumers who open the report in the Report Viewer. If this layout is for scheduled reports only, clear this box. |
| Locale | Displays the locale selected when the layout was uploaded. This field is not updateable. |
| Layout Type | Valid Output Types |
|---|---|
| PDF, PDFZ, CSV, Data | |
| RTF | HTML, PDF, PDFZ, RTF, Excel, Excel2000, PowerPoint, PowerPoint2007, MHTML, CSV, FO, Data |
| XPT | Interactive, HTML, PDF, PDFZ, RTF, Excel, Excel2000, PowerPoint, PowerPoint2007, MHTML, CSV, FO, Data |
| XLS | Excel, Excel2000, CSV, Data |
| Flash | Flash, PDF, MHTML, CSV, Data |
| XSL Stylesheet (FO) | Same outputs as RTF |
| XSL Stylesheet (HTML XML/Text) | HTML, XML, Text, Data |
| eText | Text, CSV, Data |
To edit a BI Publisher layout (.xpt file type) select the report from the list and click Edit.
To edit any other template type, click the File name link to download the layout to a local computer for editing.
Parameters are defined in the data model, but the report editor enables you to configure the parameter settings specifically for each report that uses the data model.
To configure the parameters for this report:
On the Report Editor page, click Parameters. The Parameters dialog is shown in the following figure:
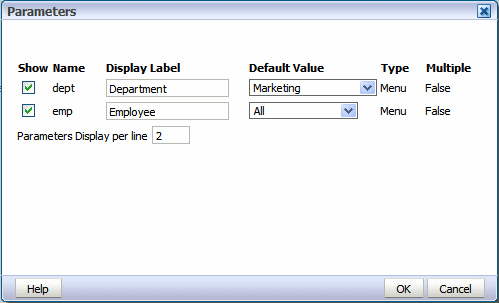
Customize the parameter settings for this report as follows:
| Property | Description |
|---|---|
| Show | This property controls whether the parameter is displayed to the user. Disable the Show property If you do not want the user to see or change the parameter values that are passed to the data model. |
| Display Label | This property enables you to reset the display labels shown for each parameter. The default values are defined in the data model. |
| Default Value | This property enables you to configure the default value for the parameter specifically for this report. The initial default values are defined in the data model. |
| Parameters Display per Line | This property controls how many parameters are displayed on one line in the report viewer. |
Launch the Report Properties dialog by clicking Properties in the page header.
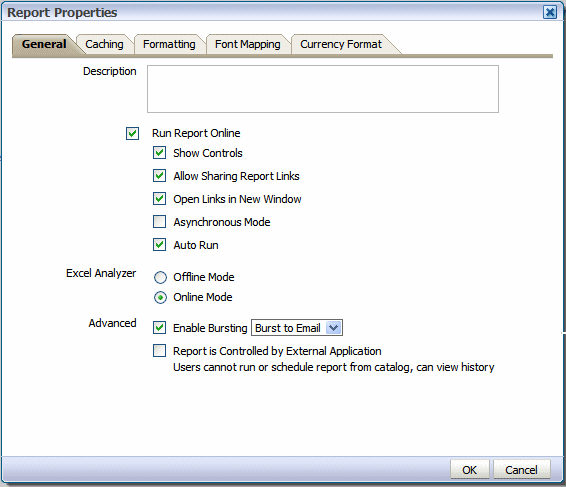
The Report Properties dialog has the following option sets:
General - set general properties for your report.
Caching - specify caching options for this report.
Formatting - set the runtime configuration properties for the report. See Setting Report Processing and Output Document Properties for information on setting these properties.
Font Mapping - create font mappings for this report.
Currency Format- define currency formats for this report.
Set the properties on the General tab as follows:
(Optional) Enter a description to display with the report in the catalog. This text is translatable.
Disable this property if you do not want users to view this report in the online Report Viewer. When disabled, users will be able to Schedule the report only. For most reports you will keep this enabled. Disable it for long-running, batch, or other reports for which online viewing is not appropriate. When this property is enabled, you can also set the following properties:
| Property | Description |
|---|---|
| Show controls | Default: Enabled This property controls the display of the control region of the report. The Control region consists of the Template list, Output list, and Parameter lists. Disable this property if you do not want users to view and update these options. |
| Allow Sharing Report Links | Default: Enabled The Actions menu of the Report Viewer includes the option Share Report Link, which enables users to display the URL for the current report. Disable this property if you do not want users to see and copy the report link. |
| Open Links in New Window | Default: Enabled This property controls how links contained within a report are opened. By default links will open in a new browser window. Disable this property to open links in the same browser window. |
| Asynchronous Mode | Default: Not enabled. Reports run in asynchronous mode use a unique thread to execute the report when run in the report viewer. This allows BI Publisher to cleanly terminate the thread if a user cancels the report execution. Note that there are performance implications when enabling this property. |
| Auto Run | Default: Enabled When this property is enabled the report will automatically run when the user selects the Open link for the report. When Auto Run is disabled, selecting the Open link for the report displays the online viewer but does not run the report. The user must select an output type from the View Report menu to run the report. |
Default: Online Mode
This property controls the method by which report data is downloaded to Excel and also impacts the ability to interact with the BI Publisher server from Microsoft Excel. Using Offline Mode has the following effects:
Your report data downloads faster and large data sets are handled more efficiently
You do not have to enable macros
You can enable your own custom macros
You cannot log in or connect to the BI Publisher server from your Microsoft Excel session. Therefore you cannot upload a template directly from Excel, nor can you update the report parameters or apply a new template.
The online mode cannot process data sets that are larger than 5 megabytes. You would therefore enable this property for reports that generate very large data sets that you wish to manipulate in Excel. Note that the Offline Mode also requires the data to be in <ROWSET><ROW>...</ROWS>...</ROWSET> format.
The following table details the differences between the online and offline modes:
| Consideration | Offline Mode | Online Mode |
|---|---|---|
| Performance | Data is downloaded faster to Excel and large data sets are handled more efficiently | Download is slower and very large data sets can impact the functioning of the Add-in. Online mode cannot process files larger than 5 megabytes. |
| Macros | You do not have to enable macros to use the Excel Analyzer in this mode. You can also create your own custom macros to use with the Excel Analyzer. | You must enable macros to use the Excel Analyzer in this mode. Custom macros are not supported in this mode. |
| Connection with BI Publisher | No connection after data is downloaded. You cannot upload templates directly from Excel, change parameters, or apply new templates to the data. | You can connect to the BI Publisher server from your Excel session. You can directly upload templates to the report, update the report parameters, and apply new templates from within your Excel session. |
| Data set Structure | Data must be in <ROWSET> <ROW> ...</ROWS>.. </ROWSET> format | It is recommended that data is in <ROWSET> <ROW>... </ROWS>.. </ROWSET> format. |
For more information about the Analyzer for Excel, see Using the BI Publisher Analyzer for Excel, Oracle Fusion Middleware User's Guide for Oracle Business Intelligence Publisher.
Enable Bursting
If this report requires bursting, select this box and then select the appropriate bursting definition from the list. When a user schedules the report, he can choose to use the bursting definition to format and deliver the report.
The bursting definition is a component of the data model. For more information, see Adding Bursting Definitions, Oracle Fusion Middleware Data Modeling Guide for Oracle Business Intelligence Publisher.
Report is Controlled by External Application. Users cannot run or schedule report from catalog, can view history
If BI Publisher is integrated with another application that controls the running of this report and you do not want users to run and view this report directly from the catalog, enable this option. Reports run by BI Publisher will be stored in the BI Publisher history tables and users can view completed reports from the Report Job History page.
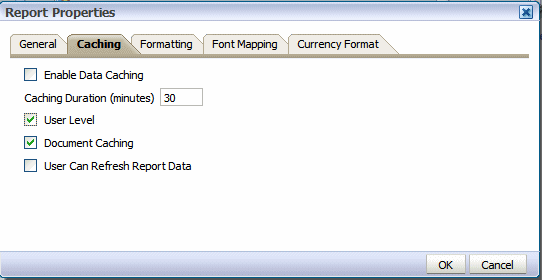
Set the properties on the Caching tab as follows:
| Variable | Description |
|---|---|
| Enable Data Caching | Default: Not enabled When this property is enabled, the data generated by the online submission of this report will be stored in cache. Subsequent requests to run this report with the same parameter selections will display the report using the data stored in the cache. This setting enhances performance by using stored data to generate a report rather than regenerating the data from the source. The data will remain in the cache according to the time limit specified in the Cache Duration property. You can control whether the cache for the report is shared by users by setting the User Level property. When data caching is enabled, you have the options of setting the following properties: |
| Caching Duration (Minutes) | Default: 30 minutes Enter the time limit for a report data set or document to remain in cache. Once the time limit has expired, the next request for the same report will generate a fresh data set. |
| User Level | Default: Enabled This property stores a separate cache for each user. The report data shown to each user comes only from the private cache. When enabled, this property ensures that each user can only see data that they are authorized to view. However, user-level cache has less efficient performance. If the report data is not user sensitive, you can disable this property to enhance performance. |
| Document Caching | Default: Enabled Enable this property to cache the report document. With document cache enabled, when a user views the report online, the document (data plus layout) will be placed in cache. When any other user (unless User Level is enabled) uses the online viewer to view the exact same report (same layout, same output type, same parameter selections) the document will be retrieved from cache. The document will remain in cache according to the caching duration specified. Note that scheduled reports do not use document cache. |
| User Can Refresh Report Data | Default: Not Enabled When this property is enabled, the user can choose to refresh the data on demand. When the user clicks Refresh in the report viewer, BI Publisher will generate a fresh data set for the report. |
The Formatting properties tab enables you to set runtime properties at the report level. These same properties can also be set at the system level, from the Administration page. The Formatting properties tab displays both the system-level setting and the report-level setting for each property. If different values are set at each level, the report level will take precedence.
For a full description of each property, see Setting Report Processing and Output Document Properties.
BI Publisher's font mapping feature enables you to map base fonts in RTF or PDF templates to target fonts to be used in the published document. Font mappings can be set at the report level or the system level. When you view the report properties Font Mapping tab, any system level settings will be displayed. To change the settings for this report, edit the font mappings here.
For detailed information on font mapping, see Defining Font Mappings.
To create a Font Mapping:
Under RTF Templates or PDF Templates, select Add Font Mapping.
Enter the following on the Add Font Mapping page:
Base Font - enter the font family that will be mapped to a new font. Example: Arial
Select the Style: Normal or Italic (Not applicable to PDF Template font mappings)
Select the Weight: Normal or Bold (Not applicable to PDF Template font mappings)
Select the Target Font Type: Type 1 or TrueType
Enter the Target Font
If you selected TrueType, you can enter a specific numbered font in the collection. Enter the TrueType Collection (TTC) Number of the desired font.
For a list of the predefined fonts see BI Publisher's Predefined Fonts.
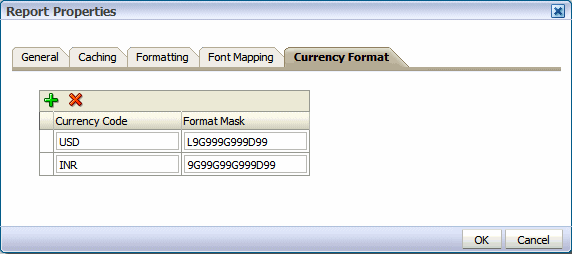
The Currency Formats tab enables you to map a number format mask to a specific currency so that your reports can display multiple currencies with their own corresponding formatting. Currency formatting is only supported for RTF and XSL-FO templates.
Currency formats can be set at the report level or the system level. When you view the report properties Currency Formats tab, any system level settings will be displayed. To change the settings for this report, edit the currency formats here.
To apply these currency formats in your RTF template, you must use theformat-currency function. See Currency Formatting for detailed procedures.
To add a currency format:
Click the Add icon.
Enter the ISO currency code, for example: USD, JPY, EUR, GBP, INR.
Enter the format mask to apply for this currency.
The Format Mask must be in the Oracle number format. The Oracle number format uses the components "9", "0", "D", and "G" to compose the format, for example: 9G999D00
where
9 represents a displayed number only if present in data
G represents the group separator
D represents the decimal separator
0 represents an explicitly displayed number regardless of incoming data
See Using the Oracle Format Mask for more information about these format mask components.
The following figure shows sample currency formats:
![]()
Copyright © 2010, 2011, Oracle and/or its affiliates. All rights reserved.