Using the WebLogic
Diagnostic Framework
Console Extension
Overview of the WLDF Console Extension
The WLDF Console Extension provides a set of visual tools you can use to directly manipulate objects to display diagnostic information about WebLogic Server instances. The following sections provide a high level overview:
You install the WLDF Console Extension into a domain, and you can display diagnostic data about any of the server instances in that domain and about applications running on those servers.
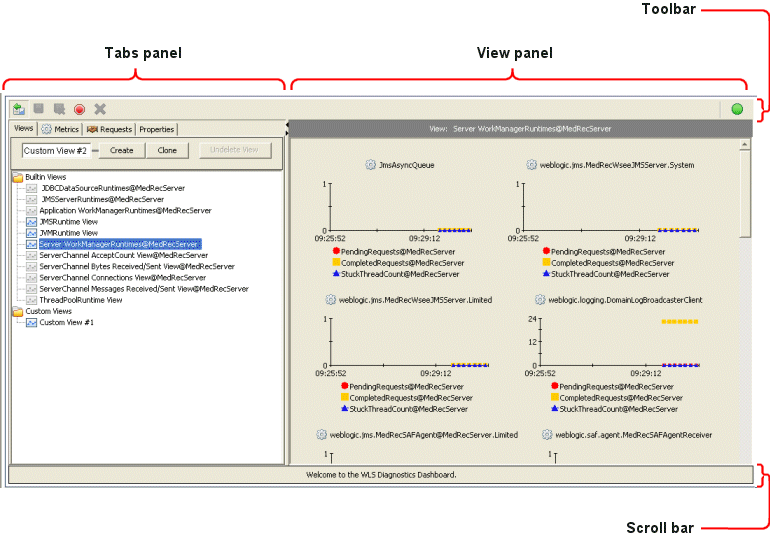
Two Main Panels
The WLDF Console Extension has two panels, the Tabs panel and the View panel, plus a toolbar and a status bar, as shown in Figure 3-1.
Figure 3-1 WLDF Console Extension Panels
View Panel Overview
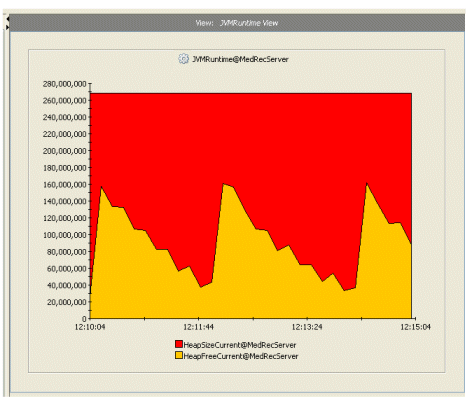
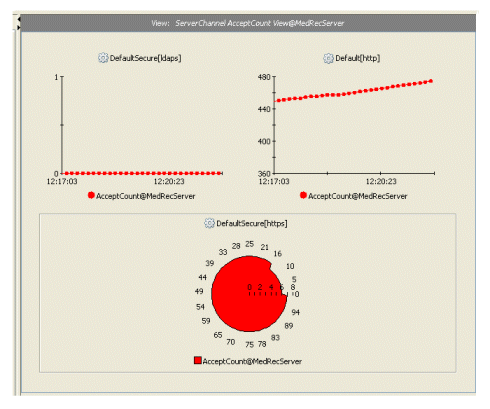
A view is a collection of one or more charts, which display captured monitoring and diagnostic data, as shown in Figure 3-2 and Figure 3-3. Views are displayed in the View panel, on the right side of the WLDF Console Extension page. The View panel displays a single viewat a time.
Figure 3-2 A View Containing One Chart
Figure 3-3 A View Containing Three Charts
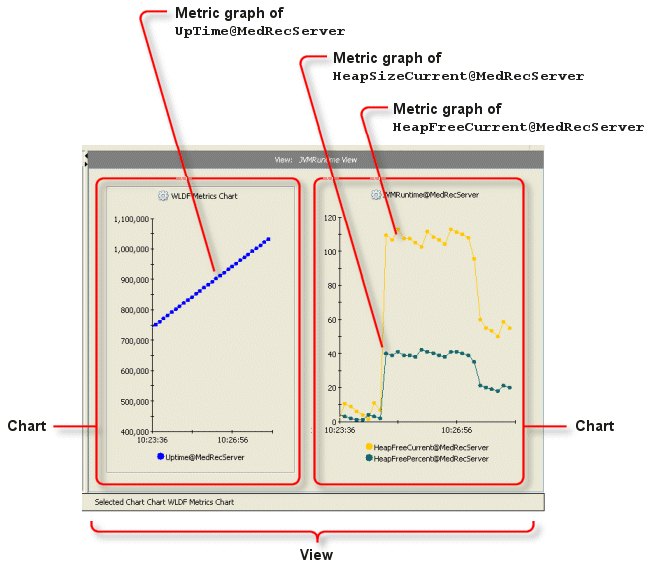
Each chart contains a legend, labels, and controls for identifying and displaying the data. A chart can display data from one or more data sources from one or more servers in the domain. The data sources include one or more metrics (that is, the value of an MBean instance attribute) or one or more instrumented methods. Each data source is displayed as a distinct graph, which shows the values of data points over a time span. The relationship between views, charts, and graphs is shown in Figure 3-4. In the figure, the view contains two charts, "WLDF Metrics Chart" and "JVMRuntime@MedRecServer," based on metrics data from the MedRecServer server. "WLDF Metrics Chart" contains one metrics graph, "UpTime@MedRecServer." The "JVMRuntime@MedRecServer" chart contains two metrics graphs, HeapSizeCurrent@MedRecServer" and "HeapFreeCurrent@MedRecServer."
Notes:
A chart can include graphs based on data from one or more servers in the domain.
Note:
You cannot mix metrics graphs and method performance graphs in the same chart.
Figure 3-4 Relationships of Graphs to Charts and of Charts to Views
Tabs Panel Overview
The Tabs panel, on the left side of the page, contains tabs with controls for creating and modifying the views and charts that are displayed in the View panel, on the right.
The Tabs panel contains four tabs:
Views contains a list of built-in views and custom views. It also contains controls for creating, modifying, and deleting views. See Working with Views.
Metrics contains a tree of all known runtime MBean types, instances, and attributes for the selected server. You can drag attributes onto a view to create one or more graphs that show the state of those attributes over time. See Working with All Charts and Graphs.
Requests contains a tree of events generated by instrumented code in the selected server. You can drag methods onto a view to create a graph that shows the execution performance (that is, the elapsed performance time) of those methods over time. See Working with All Charts and Graphs.
Use the controls in the Properties > Global Properties tab to set polling and display properties that apply to all active views. See Setting Global Properties.
Toolbar and Scrollbar Overview
The toolbar and scrollbar are available at all times, regardless of which tab is displayed in the Tabs panel.
The toolbar is displayed directly above the Tabs and View panels. The buttons and icon in the toolbar are described in Table 3-1.
Table 3-1 Buttons and Icon in the Toolbar
Button or Icon
Description
Action
Focus context
Click to change focus between the Tabs panel to the View panel.
Save all modified views
Click to save all custom views. If no views have been modified since they were last saved, this button is disabled and is colored gray.
Discard all unsaved view changes.
Click to discard all changes you made to all views since you last saved them.
Stop all active views
Click to stop all active views.
Delete
Click to delete selected graph or chart. (This button is unavailable if a built-in view is selected.
Status of data polling
Displays the status of the data poller:
Green indicates that data is being retrieved from the server with no problem.
Yellow indicates that there are some problems retrieving data from the server.
Red indicates that no data is being retrieved from the server.
The status bar at the bottom of the page displays information about the selected item.
Displaying Tooltips for Controls, Views, Graphs, and Charts
You can display short messages, called tooltips, about several types of objects in the WLDF Console Extension by positioning the mouse pointer over the objects. To display a tooltip for an item, move the mouse pointer to point to the object, and pause. Do not click the mouse. After a momentary delay, a short message about the item is displayed.
In all areas of the WLDF Console Extension, you can display tooltips for standard controls such as buttons, text fields, sliders, and so forth, which tell you what each control does. But you can also display details about other objects displayed in the WLDF Console Extension and about the sources from which the diagnostic data is gathered, as described in the following sections:
In the Metrics tab or Requests tab, select the server for which you want to display diagnostic data. See Working with All Charts and Graphs.
Drag items from the Metrics or Requests tabin the left panel to the active view in the right panel. Drop an item into a blank area in the view to create a new chart and graph, or drop it into an existing chart to add a new graph to the other graph(s) in the chart. See Working with All Charts and Graphs.
Optionally, select the Properties tab, and use the tools on that tab to change the appearance of graph(s) and chart(s). See Working with All Charts and Graphs.
The WLDF Console Extension is a graphical user interface with visual tools for setting attributes and manipulating objects. Alternative interaction techniques are available for accomplishing many activities:
Drag and drop and other direct manipulation with the mouse. For example, you can drag an MBean instance attribute from the Tabs panel to the View panel to create a new chart. Another direct manipulation technique is to Shift-drag across a graph in a chart to zoom in on the data.
Right-click, then select from a context menu. You can right-click attributes in the Metrics tab, methods in the Requests tab, and charts in the View panel to display context menus, from which you can select a command to act on the selected object. For example, you can right-click an MBean instance attribute in the Tabs panel, then choose Create New Chart to incorporate it into a new chart.
Keyboard interaction. You can use the Tab key, the arrow keys, and the Enter key to select different tools and objects on the page and then perform actions on them. For full documentation, see Keyboard Reference.