


|
|
The following sections provide an overview to the BEA TSAM product:
BEA TSAM (Tuxedo System and Application Monitor) provides comprehensive monitoring and reporting for BEA Tuxedo system and applications. It includes two components: BEA TSAM Agent and BEA TSAM Manager.
The BEA TSAM agent enables collection of various applications performance metrics (including XA and non-XA transactions, services, system servers). The BEA TSAM Manager provides graphical user interface that correlates and aggregates performance metrics collected from one or more Tuxedo domains. It displays this information in real time.
Because the BEA Tuxedo framework and applications are widely deployed, comprehensive monitoring and reporting capability becomes increasingly critical. For example, you may want to know:
BEA TSAM can provide this information and allows you to easily identify bottlenecks and expedite problem resolution. BEA TSAM can also help with performance tuning and capacity planning.
BEA TSAM also allows you to define event alerts. The BEA TSAM Console reports an event when an alert is triggered notifying you to take proper action.
BEA TSAM software consists of the following components:
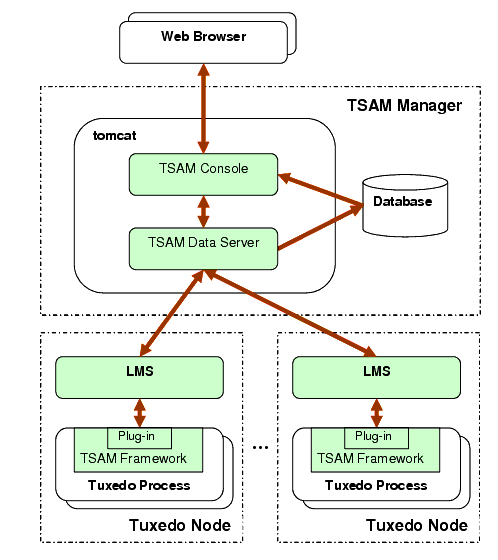
The BEA TSAM agent enables collection of various performance metrics for Tuxedo system and applications. It resides on each monitored Tuxedo node. BEA TSAM Agent includes the following sub-components:
The BEA TSAM Manager provides a graphical user interface that correlates and aggregates performance metrics collected from one or more Tuxedo domains and display them in real time. It is the BEA TSAM data and management center and can run on a non-Tuxedo node. The BEA TSAM Manager includes the following sub-components:
BEA BEA TSAM provides the following features:
When a Tuxedo call is initiated, the back-end service operation is transparent to the call initiator. A Tuxedo call can trigger a set of service invocations. It may involve many local or remote services, and perhaps a cross multiple domains. The back-end service invocations constitute a call path.
When call path monitoring is enabled, BEA TSAM provides a tree view to present a Tuxedo call path. The call path tree shows the relationship and detailed information of each service invocation. The information includes source, destination, status, execution time, waiting time, call type, detailed transport information, etc.
If many Tuxedo calls follow the same call path, this is identified as a call pattern. BEA TSAM provides the capability to analyze the existing call paths and summarize the call patterns.
BEA TSAM provides a visual representation of real-time status (the total number of successful and failed executions) for selected services in a particular Tuxedo domain. BEA TSAM also provides statistical data for selected service. The statistical data includes the successful, failed and total service invocation number, average execution time, and average wait time.
There are many system servers used in the Tuxedo infrastructure (for example, GWTDOMAIN and BRIDGE are two of the most important system servers). BEA TSAM is able to monitor GWTDOMAIN and BRIDGE real-time throughput (the number of messages that pass through the server).
BEA TSAM also provides the statistical data for selected GWTDOMAIN or BRIDGE. The statistics data include number of messages, total message size, number of requests waiting for reply.
BEA TSAM allows customers to search for and display transaction information. This information includes: initiator, start time, execution time, and detailed information of each transaction participant.
BEA TSAM allows customers to define event alerts. These alerts are of different types, criteria, and severity. BEA TSAM Console reports an event when an alert is triggered. You can define what action is needed to be performed (for example, sending a Tuxedo Event).
BEA TSAM Agent provides an open plug-in framework. It can be used to customize performance metrics collection and send to management tools other than BEA TSAM Manager.
BEA TSAM provides flexible and dynamic control over monitoring policies. The BEA TSAM Console makes it easy to specify which Tuxedo component you want monitored and what kind of data you want to collect.
BEA TSAM Console is a Web-based graphical data presentation and management tool. You can use a Web browser to view all monitoring charts and statistical reports. It provides administrators with the functionality to configure and manage BEA TSAM (including user management, policy management, and data management).
After becoming familiar with the BEA TSAM Product Overview, refer to the following topics for installing, deploying, and using BEA TSAM.
For an explanation of how to install the product, refer to the BEA TSAM Installation Guide.
For an explanation of how to deploy the product, refer to the BEA TSAM Manager Deployment Guide.
For an explanation of how to use BEA TSAM, refer to the BEA TSAM Administration Guide.


|