8 Working with Dashboards
This chapter describes Oracle SOA Suite for healthcare integration dashboards, which display endpoint-level status and volume metrics on instance data. This includes endpoint status, message counts, sequencing information, and error messages.
This chapter includes the following topics:
8.1 Introduction to Dashboards
Oracle SOA Suite for healthcare integration dashboards display information about the current health of the endpoints in a healthcare integration application. You can create and configure multiple dashboards as needed to monitor the status and volume metrics for the endpoints you have defined.
The Dashboards tab reflects changes that occur in the runtime repository, such as purging runtime instance data, new messages processed, and new error messages. You can display data for various time periods, and you can manually refresh the data in real time or set the dashboard to automatically refresh at set intervals. The available time periods are configurable in the UI settings on the Administration tab.
When you first open a dashboard, based on the View Mode options, Compact and Normal, a summary of all the endpoints included in the dashboard appears. For each endpoint, you can view more detailed information about not only the status and message volume but also about the endpoint's configuration. Figure 8-1 shows endpoint summaries in the Normal mode on the Dashboard page.
Figure 8-1 Endpoint Summaries on the Dashboard
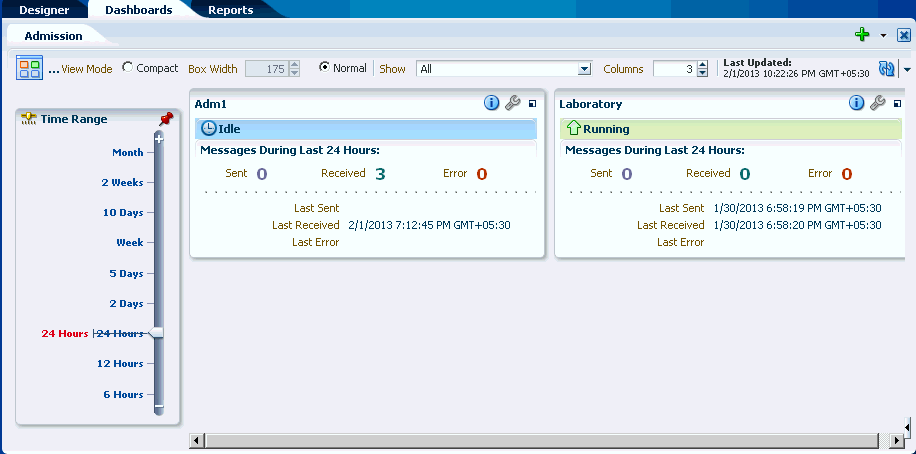
Description of "Figure 8-1 Endpoint Summaries on the Dashboard"
You can click the Compact option to view the Dashboard in the compact mode where only a small box filled with a color corresponding to the status and name of each endpoint. You can also adjust the width of the compact boxes to fit as many as you can. The Time Range can also be iconified to save space and it automatically reappears when you do a mouseover over the Time Range slider icon. The Show Customizer toggle button always appears on the dashboard regardless of whether the Customizer is open or not.
Figure 8-2 shows the Dashboard page in the compact mode.
8.2 Working with System Dashboard
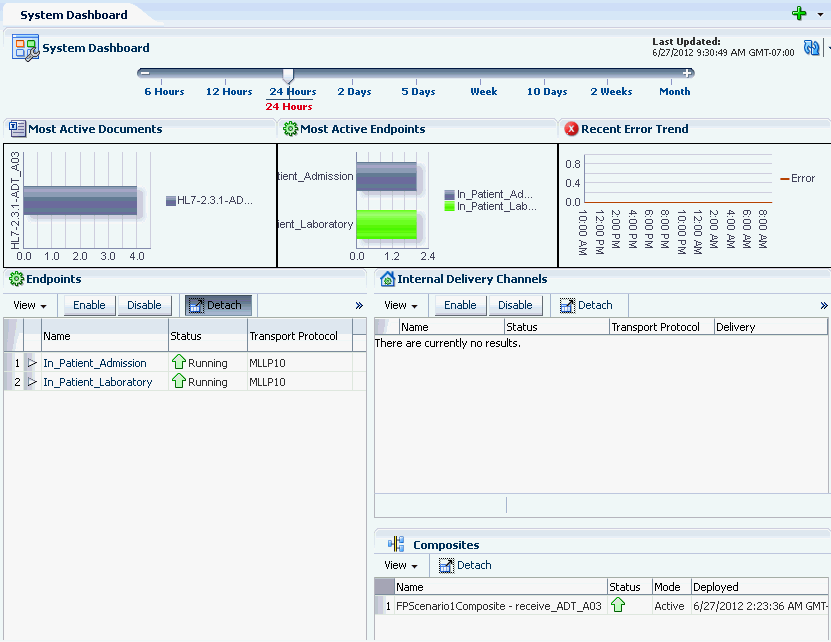
The Oracle Healthcare console provides a feature called the System Dashboard that displays a global view of status of the healthcare setup. This includes a overall view of the endpoints and internal delivery channels for the purpose of monitoring. The System Dashboard enables you to view a list of enabled as well as disabled endpoints and the ports to which these endpoints listen, if applicable. In addition, the dashboard displays the message counts. The System Dashboard also allows you to group or sort endpoints by transport protocol, outbound and inbound, or both.
Using the System Dashboard, you can view the deployed healthcare composites, which is important because internal delivery channels and composites represent the internal side of the system overview. You can also enable or disable endpoints and channels by using the System dashboard. Sections on message statistics and overall recent error list completes the System Dashboard.
You can view the System Dashboard by first clicking the plus icon in the upper right corner of the Dashboard tab, and then clicking System Dashboard.
Figure 8-3 displays a sample System Dashboard.
8.2.1 Viewing System Data by Using Different Sections of the System Dashboard
Using the sections of the System Dashboard, you can view different types of system data pertaining to the a Oracle Healthcare instance.
Table 8-1 lists the different sections of the System Dashboard.
Table 8-1 Sections of the System Dashboard
| Section Name | Description |
|---|---|
|
Slider Description of the illustration sysdb_slider.gif |
The time slider at top of the System Dashboard page allows you to select time intervals for which data is collected for the graphs and tables of the dashboard. Slide the point from to select the required time interval. |
|
Refresh  Description of the illustration sysdb_refresh.gif |
The Refresh component at the top right corner of the dashboard allows you user to either manually refresh the page or set the interval for auto-refresh. To enable auto-refresh, click the down arrow adjacent to the Refresh icon, select the Auto-Refresh check box, and specify the interval for auto-refresh (in seconds.) |
|
Most Active Documents 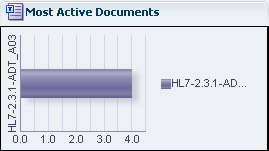 Description of the illustration sysdb_mostactive.gif |
This graph displays the most active document definitions (maximum of three document definitions at a time) and how many messages are associated with each document definition. |
|
Most Active Endpoints 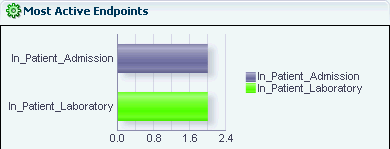 Description of the illustration sysdb_mostactiveep.gif |
This graph displays the most active endpoints (maximum of three endpoints at a time) and how many messages are associated with each endpoint. |
|
Recent Error Trend 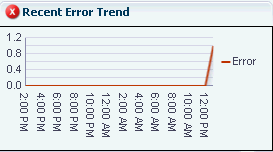 Description of the illustration sysdb_recenterr.gif |
This graph displays the number of errors in the specific Oracle Healthcare setup mapped against the time at which the errors occurred. |
|
Endpoints Table  Description of the illustration sysdb_eptable.gif |
The Endpoints table displays a list of all endpoints in the Oracle Healthcare system along with the status, transport protocols, message counts, and queue counts associated with each of the endpoints. You can perform the following actions in this table:
|
|
Internal Delivery Channels Table  Description of the illustration sysdb_intdelchn.gif |
The Internal Delivery Channels table displays a list of all the internal delivery channels in the Oracle Healthcare system along with the status, transport protocols, and delivery associated with each of the channels. Here, the channels are listed with values In this table, you can perform actions similar to the ones that you can perform in the Endpoints table. |
|
Composites Table  Description of the illustration sysdb_composites.gif |
The Composites table displays a list of Oracle Healthcare related composites that have been deployed in the Oracle Weblogic Server along with the status of the composites Click the View button to configure the number of columns to be displayed in the table or to detach the Composites window . |
8.3 Creating and Configuring Dashboards
Using the Dashboards tools, you can create dashboards for any combination of endpoints you have defined. You can configure the layout of the Dashboard page, specify a refresh rate, and change the endpoints for an existing dashboard.
8.3.1 Creating a Dashboard
You can create multiple dashboards in Oracle SOA Suite for healthcare integration for a single endpoint or combinations of multiple endpoints.
Note:
Whenever there are any Endpoints defined, a standard dashboard called All Endpoints is available that includes all the defined endpoints. You cannot modify and save changes to this standard dashboard.-
On the Oracle SOA Suite for healthcare integration user interface, click the Dashboards tab.
The main Dashboards page appears.
-
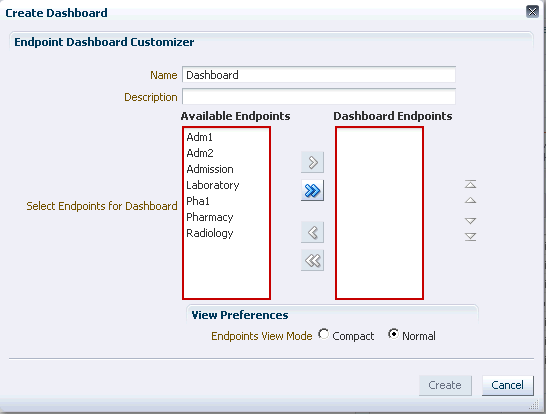
Click the plus icon in the upper right, and select Create Dashboard.
The Create Dashboard dialog appears.
-
Enter a unique name and a description for the dashboard.
-
Under Available Endpoints, select the endpoints you want to include on the dashboard and then click the right arrow icon.
The selected endpoints appear in the Dashboard Endpoints list.
Figure 8-6 Create Dashboard Dialog with Endpoints Selected
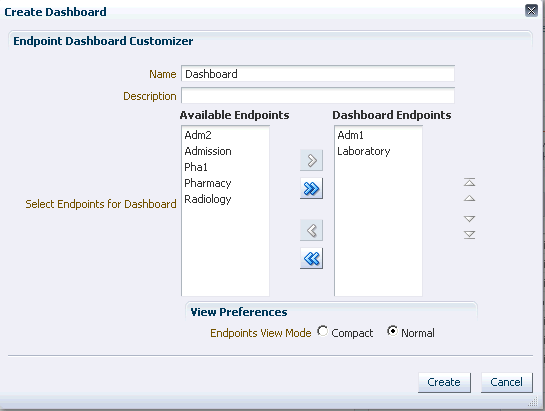
Description of "Figure 8-6 Create Dashboard Dialog with Endpoints Selected"
-
Select the required Endpoint View Mode.
-
Click Create.
The new dashboard appears with summary information displayed for each endpoint about the messages processed in the past 24 hours.
8.3.2 Selecting a Default Dashboard
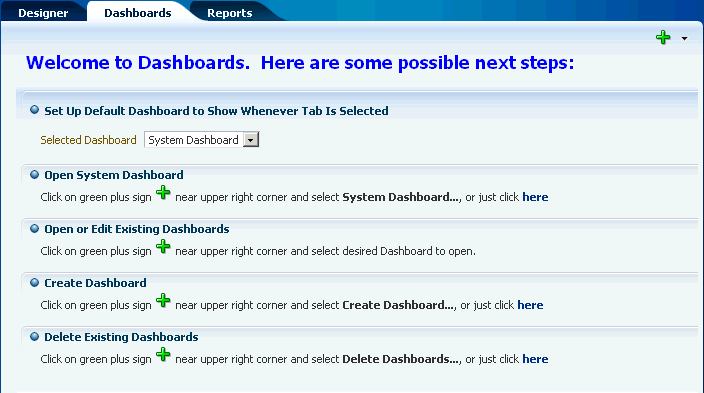
Once you create dashboards you can select one that automatically appears when you click the Dashboards tab. This is the default dashboard. If you do not specify a default dashboard, you can select from the list of existing dashboards when you open the Dashboards page. If you do select a default dashboard, this dashboard appears every time you open the Dashboards page.
-
On the Oracle SOA Suite for healthcare integration user interface, click the Dashboards tab.
-
Click the down arrow next to the Selected Dashboard field, and select the dashboard that you want to make default.
Figure 8-7 Default Dashboard Selected on the Main Dashboards Page
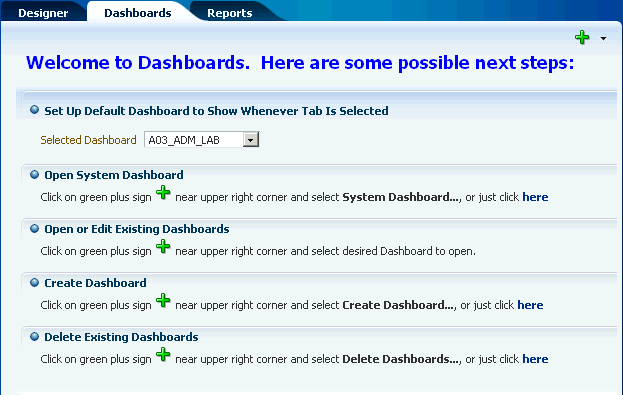
Description of "Figure 8-7 Default Dashboard Selected on the Main Dashboards Page"
-
Click Apply.
The selected dashboard appears. The next time you log in and select the Dashboards tab, this dashboard will automatically appear.
8.3.3 Configuring an Existing Dashboard
Once you create a dashboard, you can change the endpoints for which information is displayed, how the information appears on the dashboard, and the type of information that appears.
To configure an existing dashboard
-
If the dashboard you want to modify is not already displayed, click the plus icon in the upper right of the main Dashboards page and select the dashboard to configure.
-
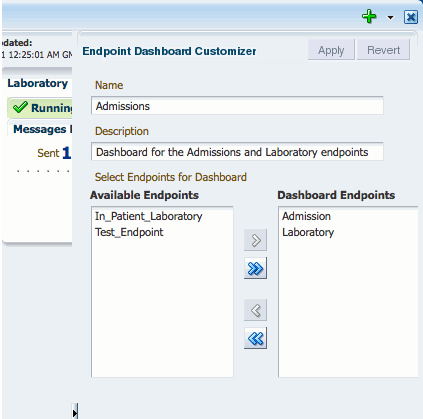
When the dashboard displays, click Show Customizer.
The customizer appears on the right side of the dashboard.
-
Do any of the following:
-
Change the name or description of the dashboard.
-
Add an endpoint by selecting it in the Available Endpoint section and clicking the right-facing arrow.
-
Remove an endpoint by selecting it in the Dashboard Endpoints section and clicking the left-facing arrow.
-
Reorder the endpoints by selecting an endpoint to move and clicking the up and down arrows to the right of the customizer.
-
-
When you are done with your changes, click Apply and then click Hide to close the customizer.
Tip:
If you do not see your changes in the dashboard after you close the customizer, click the Refresh icon. -
To undo the changes you made, click Revert.
-
To limit the types of messages displayed on the dashboard, click the down arrow next to the Show field, and select one of the following options:
-
All: Shows all types of messages.
-
Running: Shows all running endpoints. Idle, disabled, and errored endpoints are not shown.
-
Errors: Shows only error messages.
-
Disabled: Shows only disabled endpoints.
Figure 8-9 Show Field on the Dashboards Page
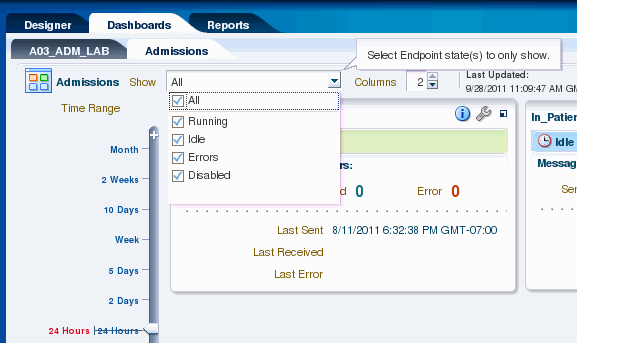
Description of "Figure 8-9 Show Field on the Dashboards Page"
-
-
To change the layout of the endpoints on the dashboard, change the number of columns displayed in the Columns field.
Note:
If you change the number of columns to display for a dashboard, the new value is not persisted when you logout and log back in again.
8.3.4 Refreshing a Dashboard and Setting the Auto-Refresh Rate
You can manually refresh the dashboard at any time, but you can also specify that the dashboard be automatically updated at set intervals.
To refresh a dashboard and set the auto-refresh rate
-
If the dashboard you want to modify is not already displayed, click the plus icon in the upper right of the main Dashboards page and select the dashboard to configure.
-
To refresh the dashboard, click the Refresh icon in the upper right.
-
To enable the auto-refresh option, do the following:
-
Click the down arrow to the right of the Refresh icon.
-
Specify the time interval in seconds to wait between automatically refreshing the dashboard, and then select Auto-Refresh.
-
To disable automatic refreshing, deselect the Auto-Refresh check box.
-
8.3.5 Deleting a Dashboard
You can delete any of the dashboards you create. Use caution when deleting dashboards. This action is irreversible.
-
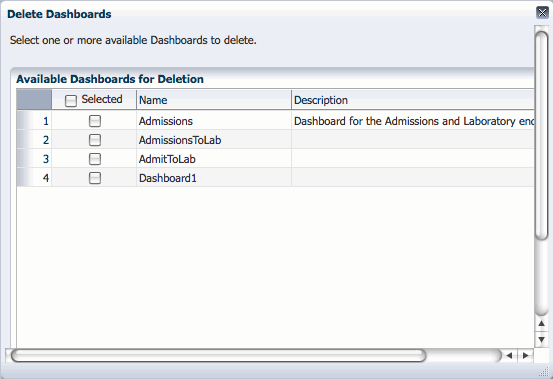
From the main Dashboards page, click the plus icon in the upper right and select Delete Dashboards.
The Delete Dashboard dialog appears.
-
In the dashboards list, select the check box next to the dashboards you want to delete.
-
Click Delete Selected Dashboards.
The selected dashboards are deleted immediately.
8.4 Viewing Information in Dashboards
Dashboards display a variety of information. You start out viewing a summary of all the endpoints in the dashboard. This view gives you a quick picture of the status of each endpoint, the number of messages they are processing, and whether there were any errors. It also shows you when the last messages were sent or received, and when the last error occurred. This information can provide clues about which endpoints might require more detailed monitoring.
You can also view more detailed information for each endpoint, including the rate at which messages are being processed, the average message size, the number of messages sent or received, the number of errors, and any error messages. You can also access the Endpoints page directly from the dashboard so you can modify the configuration of an endpoint if needed.
8.4.1 Viewing Endpoint Summary Information in a Dashboard
A dashboard has multiple views and you can drill down from each view to get a higher level of detail about a specific endpoint, error, or message.
To view endpoint summary information
-
On the main Dashboards page, click the plus icon and then select the dashboard to view. For each endpoint, you can view the following information:
Figure 8-11 Endpoint Summary on a Dashboard
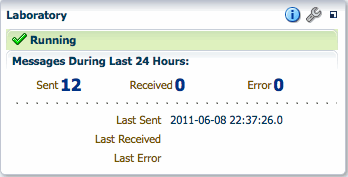
Description of "Figure 8-11 Endpoint Summary on a Dashboard"
-
Status: The current status of the endpoint, such as Running, Idle, Disabled, or Errors.
-
Messages Sent: The number of messages sent by the endpoint in the specified time period.
-
Messages Received: The number of messages received by the endpoint in the specified time period.
-
Errors: The number of messages with errors for the endpoint in the given time period.
-
Last Sent: The date and time the last message was sent from the endpoint.
-
Last Received: The date and time the last message was received from the endpoint.
-
Last Error: The date and time of the last error for the endpoint.
-
-
To change the time period for which the dashboard displays information, slide the pointer up or down on the time scale on the left of the page.
Figure 8-12 Sliding Timescale for Dashboard Information
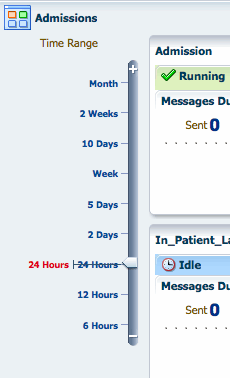
Description of "Figure 8-12 Sliding Timescale for Dashboard Information"
-
To view the properties for a specific endpoint, click or hover over the information icon for that endpoint. (Clicking opens a pop-up window with the information; hovering only shows the information while the cursor is over the information icon.)
The Endpoint Properties dialog appears, where you can view the endpoints protocol, connection, polling, timeout, and sequencing properties.
Figure 8-13 Endpoint Properties Dialog, Accessed from a Dashboard
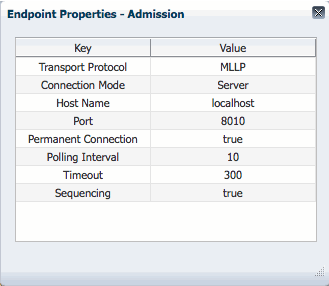
Description of "Figure 8-13 Endpoint Properties Dialog, Accessed from a Dashboard"
If the endpoint defines both inbound and outbound processing, the properties dialog has two tabs, one that displays properties for inbound and one that displays properties for outbound. If the statuses of the inbound and outbound are different, additional information about the status appears on the properties dialog.
Figure 8-14 Endpoint Properties Dialog for a Bidirectional Endpoint
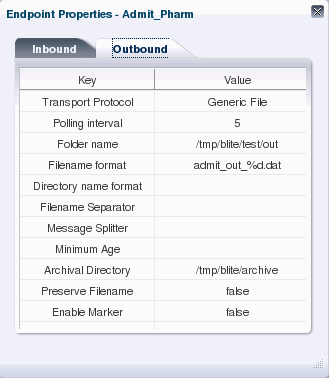
Description of "Figure 8-14 Endpoint Properties Dialog for a Bidirectional Endpoint"
For more information about endpoint properties, see Chapter 4, "Working with Endpoints.".
8.4.2 Viewing Detailed Endpoint Information in a Dashboard
From any endpoint summary view, you can drill down into more information for a specific endpoint, such as the message processing rate, the message volume broken down by message type (sent, received, or error), and the average message size. Additional information is available for errors.
To view detailed endpoint information
-
Display the dashboard you want to view on the Dashboards page.
-
For a specific endpoint, click Show More Endpoint Details (the icon on the far right in the endpoint box).
The Endpoint Details page appears.
Figure 8-15 Endpoint Details Page on a Dashboard
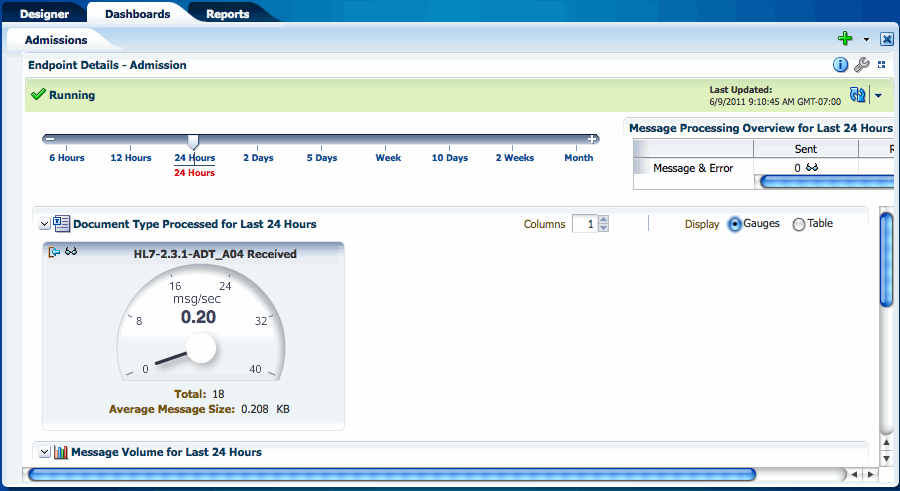
Description of "Figure 8-15 Endpoint Details Page on a Dashboard"
-
To change the time period for the displayed data, move the slider to the left or right on the timescale at the top of the page.
-
You can view the volume metrics for the endpoint as a gauge (shown above) or in tabular format. Select either Gauge or Table next to Display.
Both the gauge and the table show the following information:
-
The document type.
-
The number of messages received per second.
-
The total number of message processed in the specified time period.
-
The average size of each message.
-
-
Scroll down to view a graph showing the volume of sent, received, and error messages.
Figure 8-16 Graphical Representation of Message Volume

Description of "Figure 8-16 Graphical Representation of Message Volume"
-
Scroll below the graph to view information about sequenced message processing.
Figure 8-17 Sequenced Messages Section of the Dashboard
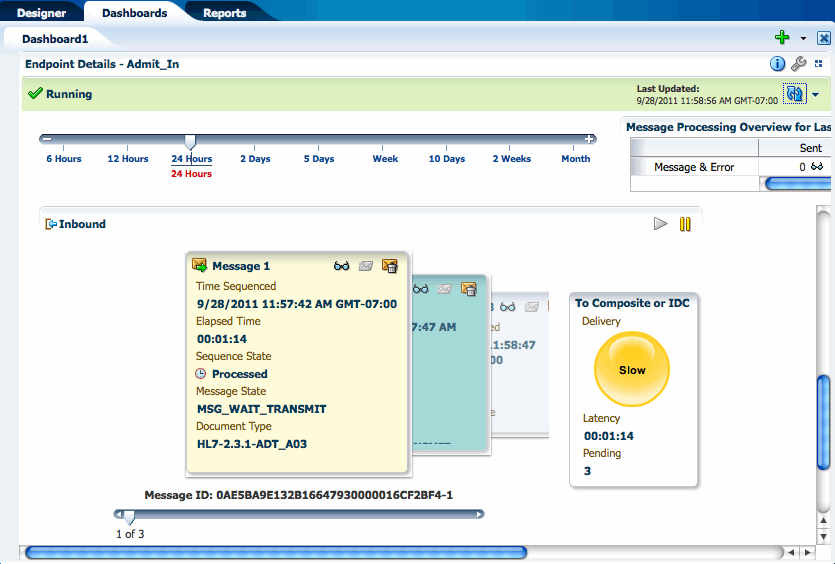
Description of "Figure 8-17 Sequenced Messages Section of the Dashboard"
Tip:
If you do not have the sequencing targets configured, you cannot view information about sequencing on the dashboard. For information on configuring sequencing, see Section 4.4, "Enabling Sequencing for an MLLP Endpoint." -
Scroll to the bottom of the page to view error messages for the displayed endpoint.
-
To view a report of the messages processed, click the eyeglass icon either in the gauge or on the table. You can also view a report by clicking the eyeglass icon in the Message Processing Overview for Last 24 Hours box. Both actions open a new tab showing the report.
Figure 8-18 Endpoint Report Accessed from a Dashboard
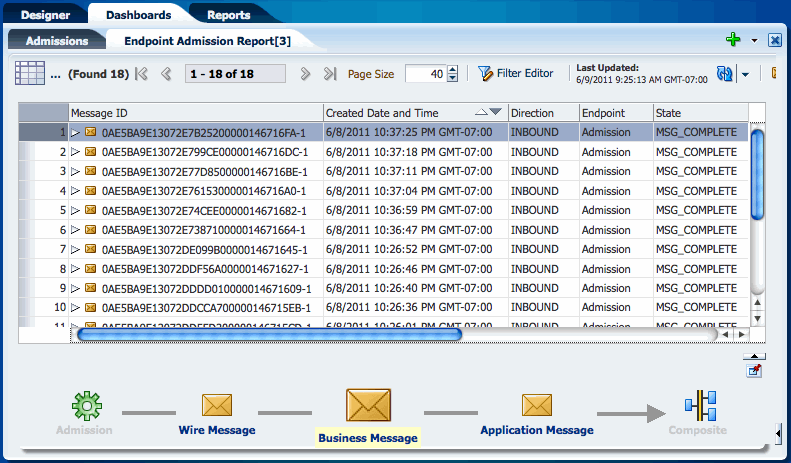
Description of "Figure 8-18 Endpoint Report Accessed from a Dashboard"
For more information about reports and the information displayed, see Chapter 9, "Working with Reports."
8.4.3 Configuring an Endpoint from a Dashboard
The dashboard lets you access the endpoint configuration pages directly so you can view and edit the endpoint properties.
To configure an endpoint from a dashboard
-
Display the dashboard you want to view on the Dashboards page.
-
In the box for the endpoint you want to configure, click Configure This Endpoint (the wrench icon).
The Endpoint page appears.
-
Modify any of the endpoint values, as described in "Working with Endpoints."
Note:
This takes you out of the dashboard pages. To return to the dashboard you were viewing, click the Dashboards tab.
8.5 Working with Sequenced Messages
The Sequenced Messages section of an endpoint dashboard provides information about the health of the sequenced message queue. In this section, you can view information about the messages that are pending in the sequenced message queue. If there is no information in this section, then sequenced messages are processing successfully. If messages are backed up, you can view the necessary information and take steps to unblock the queue.
The information you can view for the queue includes the number of messages in the queue, the time a message was sequenced, the time elapsed since sequencing was initiated for the message, the sequence state, the message processing state, and the document type. There is also an indicator of the overall delivery status for the queue. Possible statuses are:
-
Paused: Indicated by a red traffic light, this means that sequencing has been manually paused or blocked when the message at the front of the queue has encountered a transport error.
-
Slow: Indicated by a yellow traffic light, this means that the elapsed time for the message at the front of the queue has exceeded the
Slow Threshold for Sequencingproperty in the UI Settings. -
Running: Indicated by a green traffic light, this indicates that sequenced messages are being processed normally.
Messages can get backed up in the queue due to sequencing errors, message errors, or message processing delays. The Sequenced Messages section gives you the information you need to correct these problems. You can view information about messages in the queue to determine the cause of the stoppage. Once you find the source, you can reprocess errored messages or discard messages from the queue.
To work with sequenced messages
-
Display the dashboard you want to view on the Dashboards page.
-
For a specific endpoint, click Click to show Maximized Endpoint Details (the icon on the far right in the endpoint box).
The Maximized Endpoint Details page appears.
-
Scroll down to the Sequenced Messages section.
If there are messages waiting in the sequencing queue, you can view them here.
Figure 8-19 Sequenced Messages Section of the Endpoint Dashboard

Description of "Figure 8-19 Sequenced Messages Section of the Endpoint Dashboard"
-
The waiting messages appear as a carousel of note boxes. Click through the boxes or use the slider underneath the messages to view information about each message.
-
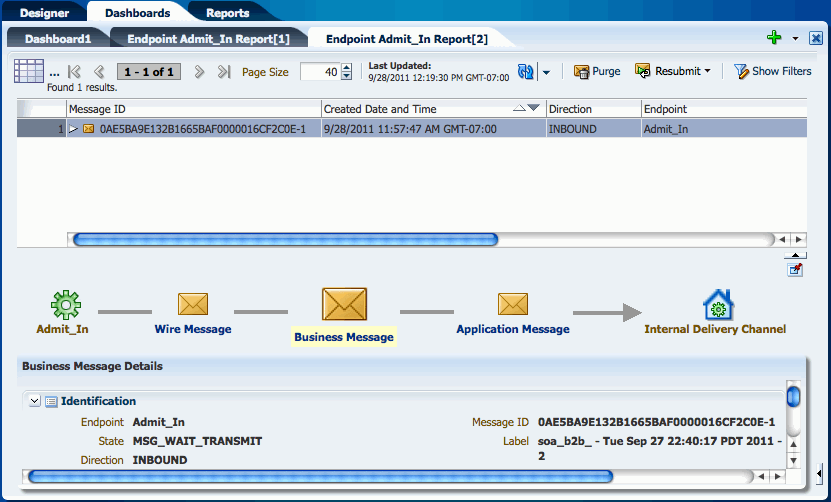
To view a report of any of the messages, click the eyeglass icon in the upper right of that message's box.
The report page appears for the selected message.
Figure 8-20 Message Report Accessed from the Sequenced Messages Section
Description of "Figure 8-20 Message Report Accessed from the Sequenced Messages Section"
-
When sequencing is blocked by a message, you can do any of the following:
-
View the message report, as shown above, and use the Purge or Resubmit functions of the reports page to handle the message.
-
In the Sequenced Message section, reprocess an errored message by clicking the Reprocess an Errored Message icon in the upper right of the message box.
-
In the Sequenced Messages section, discard the blocked message by clicking the Discard Message icon in the upper right of the message box. Discarding a message only removes it from the sequenced message queue, and does not remove it from the instance data shown in the reports.
-
-
To pause sequenced message processing, click the Pause button in the upper right of the Sequenced Messages section.
-
To resume sequenced message processing, click the Resume button in the upper right of the Sequenced Messages section.
8.6 Viewing Endpoint Error Messages
When a message for a specific endpoint generates an error, you can access information about the error from the Dashboards page.
Note:
When a transport error occurs in an endpoint, the status bar for the endpoint changes to red and the status changes to Errors. This does not indicate an error in the business message processing, which is described in the following procedure, though message processing errors can include transport errors as well. Message processing errors are indicated by the number in the Error field of the endpoint summary.To view endpoint error messages
-
On the endpoint summary dashboard page, click Show More Endpoint Details for the endpoint that shows messages with errors.
-
On the endpoint details page, scroll to the bottom of the page to view the list of error messages.
-
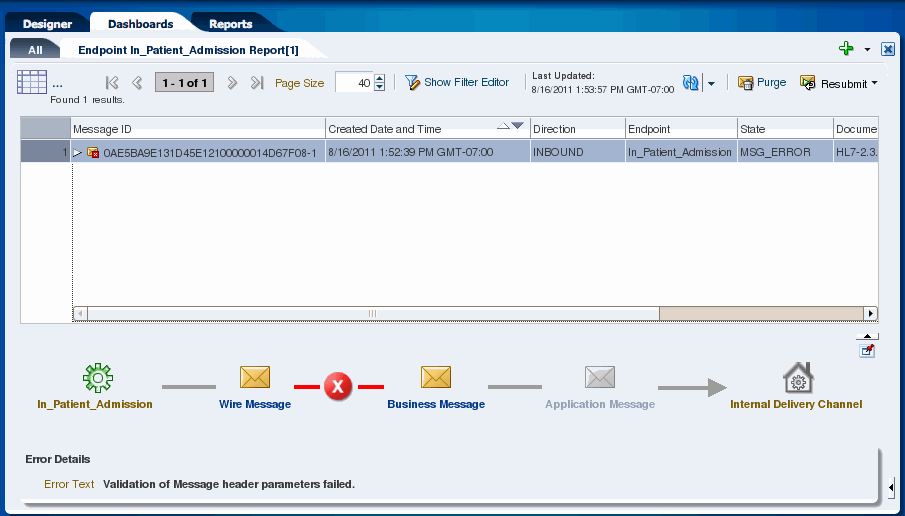
To view a report of the error, click the eyeglass icon to the right of the message ID.
The Reports page appears, as shown below.
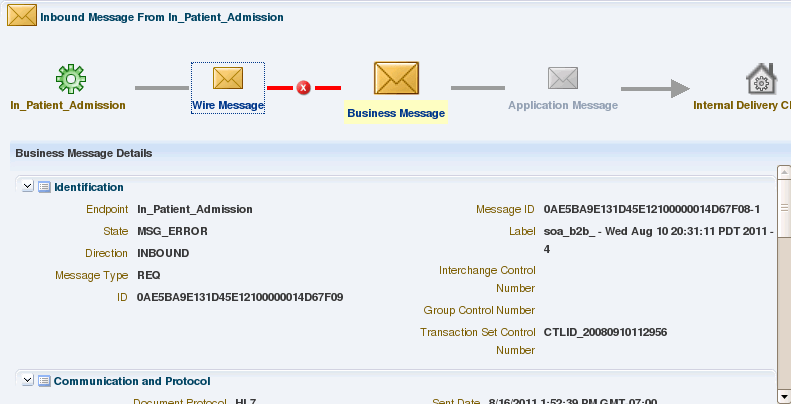
Figure 8-23 Endpoint Error Message Report
Description of "Figure 8-23 Endpoint Error Message Report"
-
To view more details about the error, collapse the upper portion of the window by clicking the up arrow beneath the message list or click Pin Current Message Details Into a New Tab to open the details in a new tab.
The business message details appear.
For more information about reports and the information displayed, see Chapter 9, "Working with Reports."
-
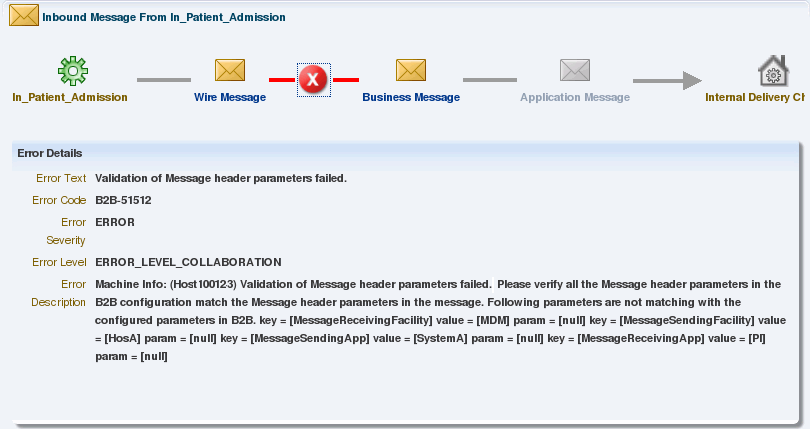
In the flow diagram, click the red X icon that indicates where the error occurred. The Error Details appear below the diagram.
Figure 8-25 Endpoint Transport Error Details
Description of "Figure 8-25 Endpoint Transport Error Details"

