Internet of Things (IoT) Metrics
Use the metrics emitted by the metric namespace oci_iot to view metrics for each IoT domain so you can monitor device connections to diagnose and troubleshoot issues.
You can monitor the health, capacity, and performance of your IoT domains using metrics, alarms, and notifications.
You can view predefined metric charts on the Monitoring tab for each IoT domain group, IoT domain, or IoT Flow Runtime resource. You can also view IoT metrics in the Monitoring service.
For details about the metrics emitted by the metric namespace oci_iot, see Internet of Things Metrics Reference.
Console Metric Charts
The Console groups the predefined charts by the resource and the type of activity or inventory that the charts monitor.
IoT Domain Group Metric Charts
On an IoT domain group's Monitoring tab, view the following chart for the IoT domains in the domain group:
- IoT Resource Utilization Metrics
- Domains by lifecycle state
IoT Domain Metric Charts
On an IoT domain's Monitoring tab, view charts in the following groups:
- Authentication and Connectivity Metrics
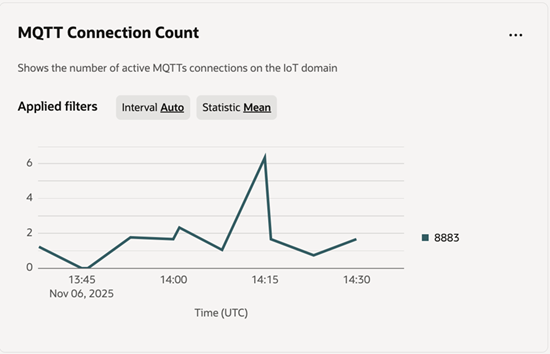
- MQTT Connection Count
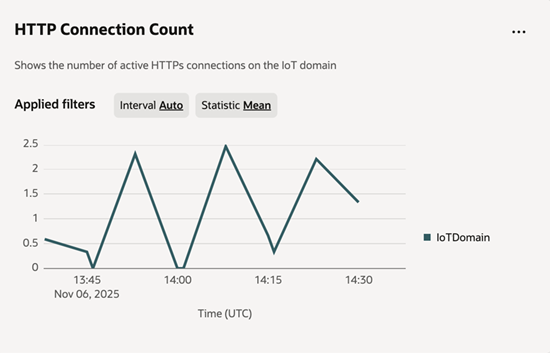
- HTTP Connection Count
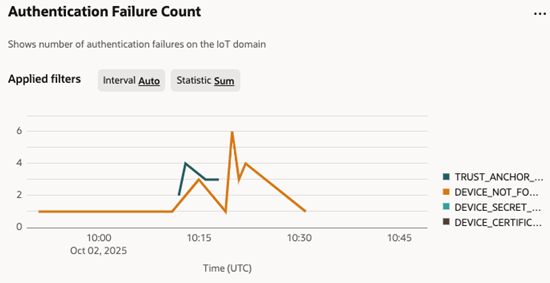
- Authentication Failure Count
- Message Processing Metrics
- Message Received Count
- Bytes Received Count
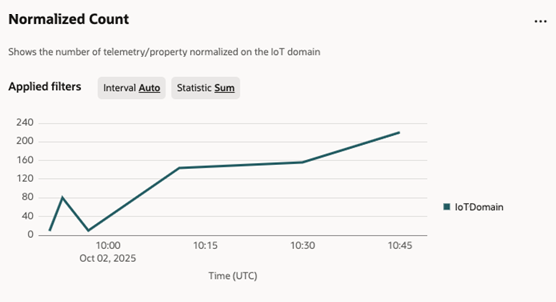
- Normalized Count
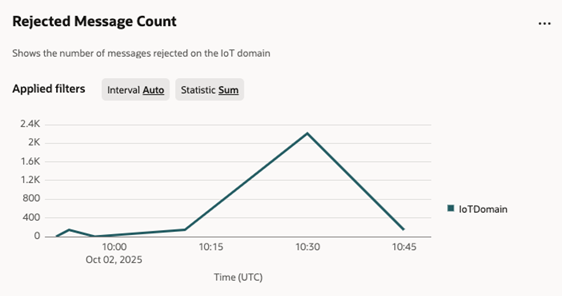
- Rejected Message Count
- Rejected Bytes
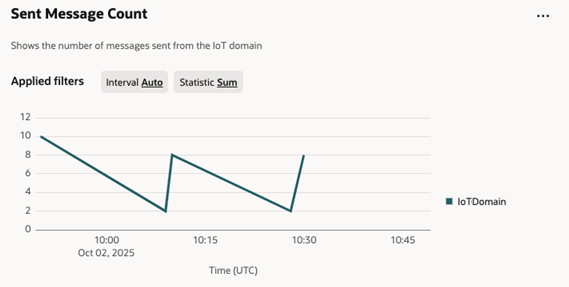
- Sent Message Count
- Sent Bytes Count
- IoT Resource Utilization Metrics
- Digital twin instances by connectivity type
- Digital twin relationships by lifecycle state
- Digital twin models by lifecycle state
- Digital twin adapters by lifecycle state
- Flow Runtimes by lifecycle state
- Flow Runtimes by scale
IoT Flow Runtime Metric Charts
On an IoT Flow Runtime's Monitoring tab, view the following performance charts:
- IoT Flow Runtime Metrics
- Flow Runtime CPU Utilization
- Flow Runtime Memory Utilization
- Flow Runtime Network Bytes In
- Flow Runtime Network Bytes Out
Metric Chart Examples