5 Monitor
Learn to monitor Oracle GoldenGate Studio processes and how to use the information reported.
GoldenGate Studio provides a graphical interface for designing, deploying, and managing data replication solutions. Monitoring pipelines is a critical aspect of ensuring your data integration projects run efficiently and reliably.
Monitor Pipelines
Monitor your pipelines to ensure that your data replication processes are running smoothly without lag. Use the tools available to troubleshoot or diagnose issues you may encounter.

-
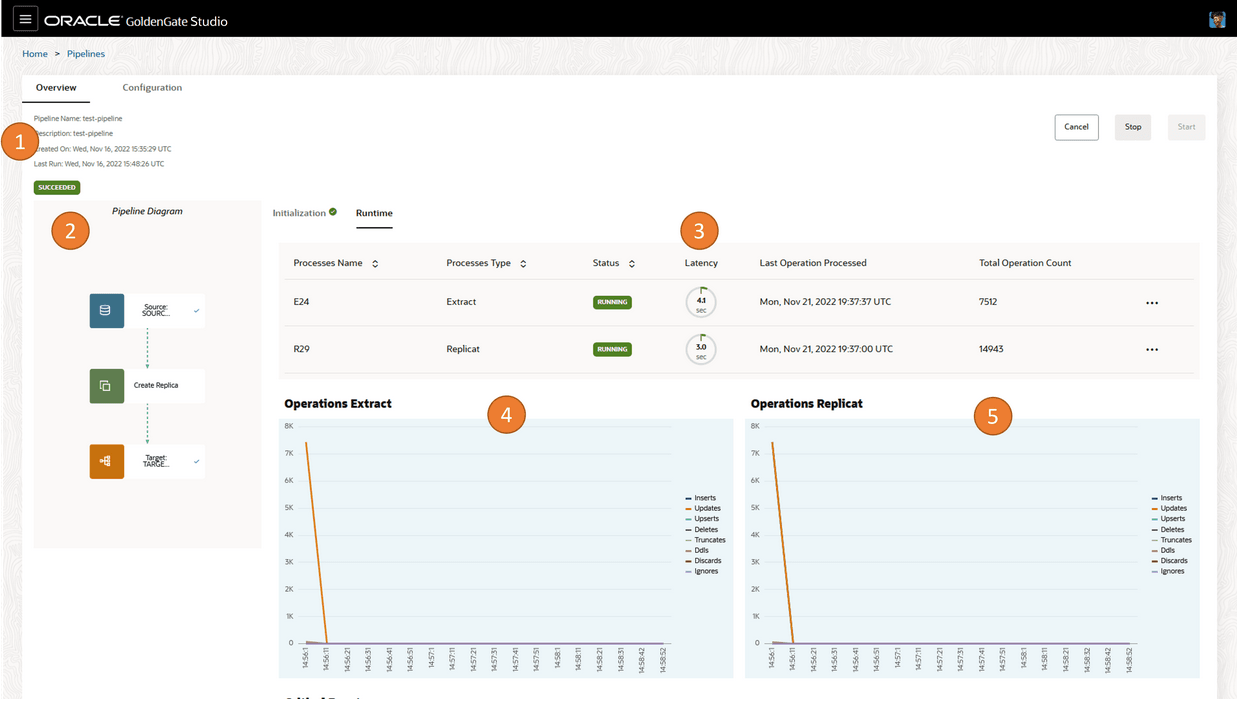
Basic pipeline information, including the pipeline's name, description, created date, and run date.
-
A realtime visual pipeline diagram, that updates as you make changes to the pipeline configuration.
-
Information about the pipeline processes, including process names, process types, their statuses, their latency, when their last operation was processed, and their total operation count.
-
Log events, reports, latency graphs of processes.
-
Operations' Extract graph, showing inserts, updates, upserts, deletes, truncates, DDLs, discards, and ignores over time.
-
Operations' Replicat graph, showing inserts, updates, upserts, deletes, truncates, DDLs, discards, and ignores over time.
-
(Not shown) A list of critical events, along with their codes, when they occurred, their severity, and message details.
-
View log events
-
Access the Oracle GoldenGate Administration Service web interface
-
Download reports
-
Download latency details