Use a Parameter as a Visualization's Axis Label
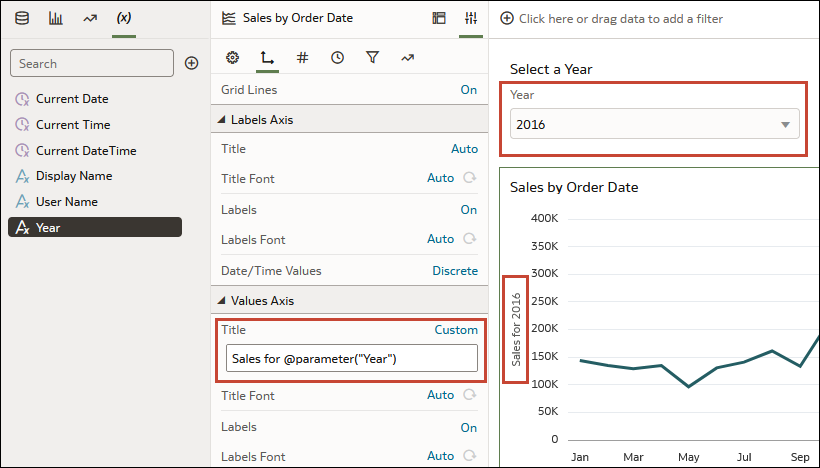
A parameter value can be dynamically passed to a visualization's axis labels. The current value of the parameter is used as the axis label's name.
For example, you can create a parameter called Year and add it
to a dashboard filter on the canvas. Then you can reference the parameter in
a visualization's value axis so that when the user chooses a year value, the
value axis title is updated to include the selected year.

