Use Filter Functions Instead of Time Series Functions
This topic explains the difference between time series functions and filter functions and explains how to implement filter functions. This information applies to both workbooks and classic dashboards.
Times Series Functions vs. Filter Functions
The times series functions Ago and Todate offer a simple way to create metrics to calculate year-ago, year-to-date, and so on. This method works well for business user reports; however, these functions generate complex queries that have a significant cost on performance. Also, each time that one of these functions is used in a report, an additional sub-query is generated using even more resources on the database.
In classic dashboards, instead of using time series functions, you can usually achieve the same result by using base metrics with the Filter function to filter on the appropriate time period. This method might be too complex for business user reports but it works well in dashboards predefined by the IT team. Using this method, the generated physical SQL code is much simpler and more efficient, and doesn't require an additional sub-query. This means the SQL query runs faster and uses fewer resources on the database, reducing the overall database CPU usage and input-output calls.
The following figure shows an example of the physical query that's generated when you use both the base metric and month Ago metric in the same report. Two queries are generated.
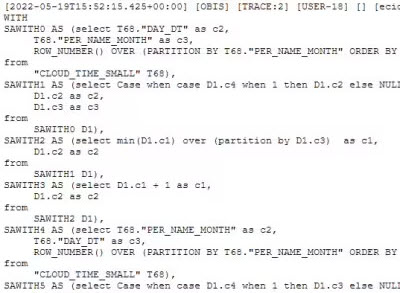
Description of the illustration ceal_physical_ago_query.jpg
The following figure shows the SQL code that's generated for a single query when you use a Filter function instead.

Description of the illustration ceal_filter_function_sql.jpg
Implement Filter Functions in a Dashboard with Prompts
In most implementations, the dashboard already includes a prompt so users can select the month that they're looking for. The first step is to identify the time periods that you need to filter on based on a user's selection.
In this example, the calendar dimension includes the column Julian Period Number because it makes the calculation easier. This is also feasible without Julian Period Number but would require much more complex formulas to calculate the time period selected.
- Modify the
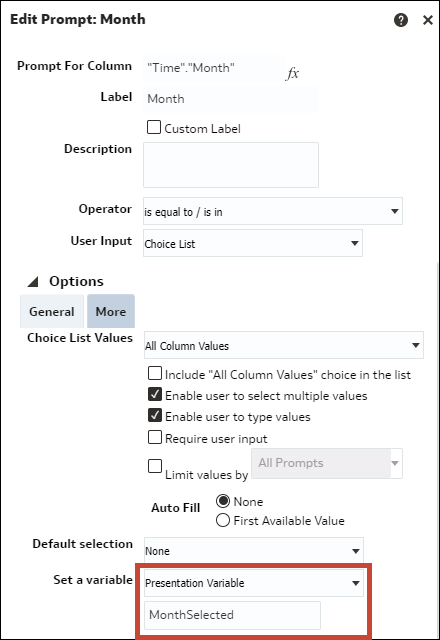
Monthprompt to add the presentation variable (MonthSelected). - Create a separate dashboard prompt to retrieve the corresponding
Julian Period Numberand put it in another variable (PeriodNumberSelected). This second prompt isn't shown to the end user; instead it's hidden in the dashboard and the value is calculated automatically based on the variableMonthSelected.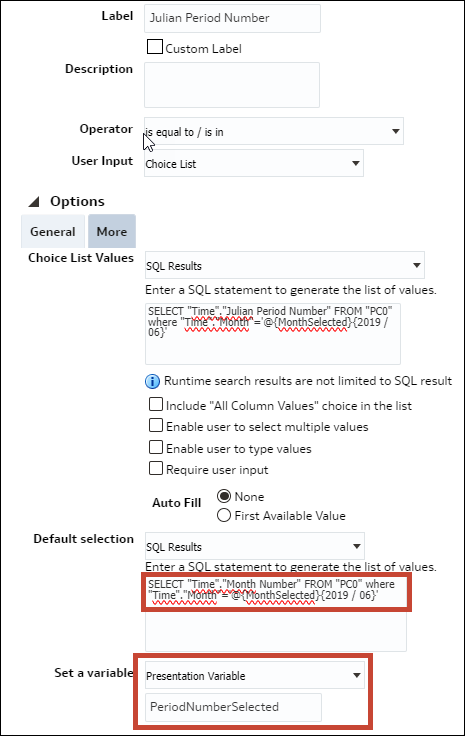
Description of the illustration ceal_julian_period_number_prompt.png - Edit your dashboard properties and click Filters and Variables.
- Add the
Julian Periodprompt path.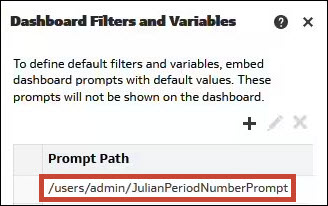
Description of the illustration ceal_dashboard_filters_variables.jpg - In the analysis, delete the global filter on the
Monthcolumn, and use the column formulas filter functions based onJulian Period Numberas required. Here are some examples:Current Month: Filter("Revenue Metrics"."Revenue" using "Time"."Julian Month Number"=@{PeriodNumberSelected}{80800})Month Ago: Filter("Revenue Metrics"."Revenue" using "Time"."Julian Month Number"=@{PeriodNumberSelected}{80800}-1)Year Ago: Filter("Revenue Metrics"."Revenue" using "Time"."Julian Month Number"=@{PeriodNumberSelected}{80800}-12)Year to date: Filter("Revenue Metrics"."Revenue" using "Time"."Julian Month Number"<=@{PeriodNumberSelected}{80800} and “Time”.”Year”=@{YearSelected}{2019})
Implement Filter Functions in a Workbook with Parameters
You can apply the same principle in a workbook. Prompts and presentation variables are replaced by a dashboard filter and parameters.
Create three parameters: MonthSelected, PeriodNumberSelected, and YearSelected. Only the parameter MonthSelected is displayed in the canvas in a dashboard filter.
The possible values for the parameter MonthSelected are defined based on a logical SQL query selecting all months.
For the parameters PeriodNumberSelected and YearSelected, the possible values aren't populated.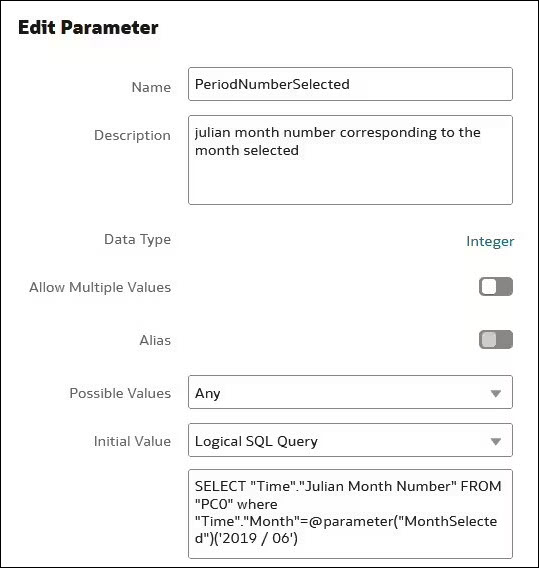
Description of the illustration ceal_periodnumberselected_parameter.jpg
Only the initial value is populated with a logical query filtered based on the value of MonthSelected.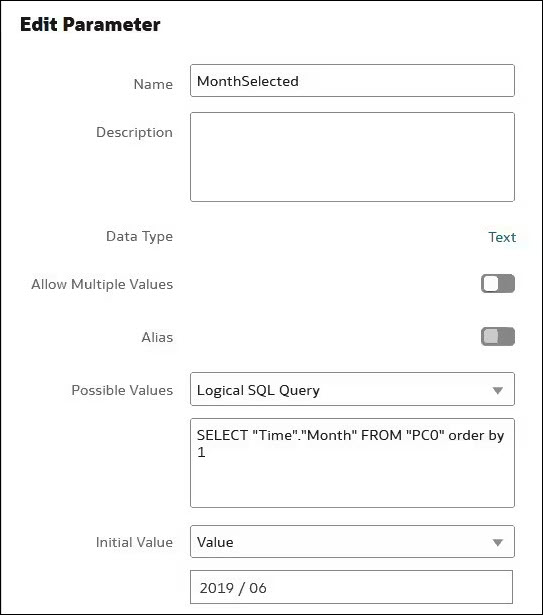
Description of the illustration ceal_monthselected_parameter.jpg
