Tips on Editing a Visualization
These tips can help you become more productive when you work with visualizations.
Access visualization options
The visualization toolbars provide quick access to formatting and editing options, and a menu (![]()
) with additional options.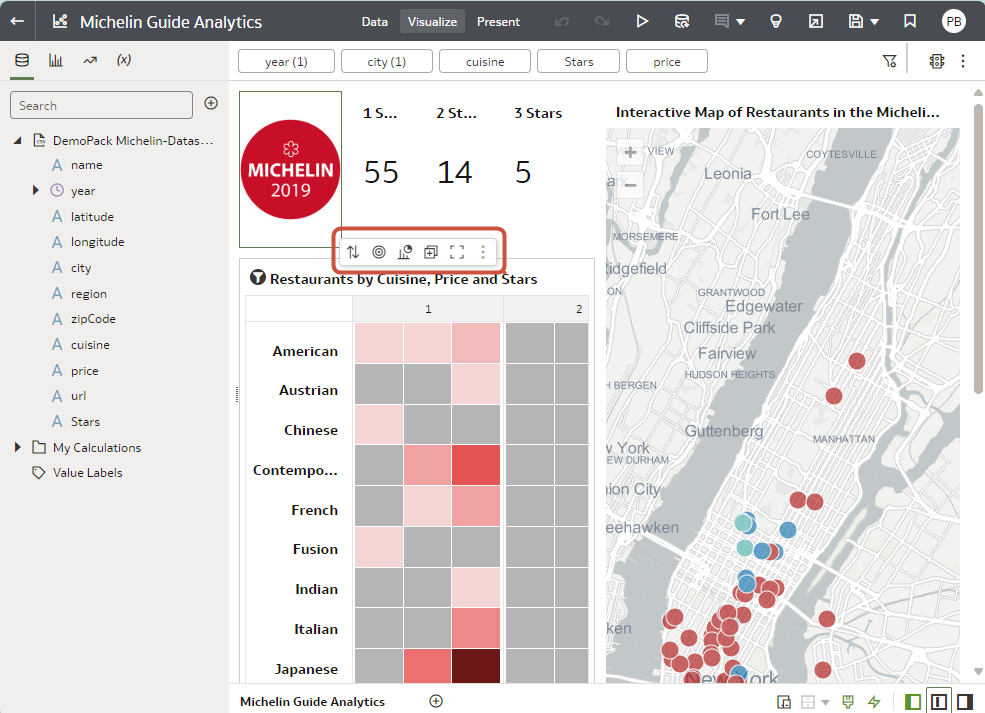
Description of the illustration viz_options.png
Access the visualization menu
Hover over a visualization, and click Menu to display a more
comprehensive visualization menu including options such as Sort By,
Use as Filter, Add Statistics, Color, Edit, Export, or Delete
Visualization.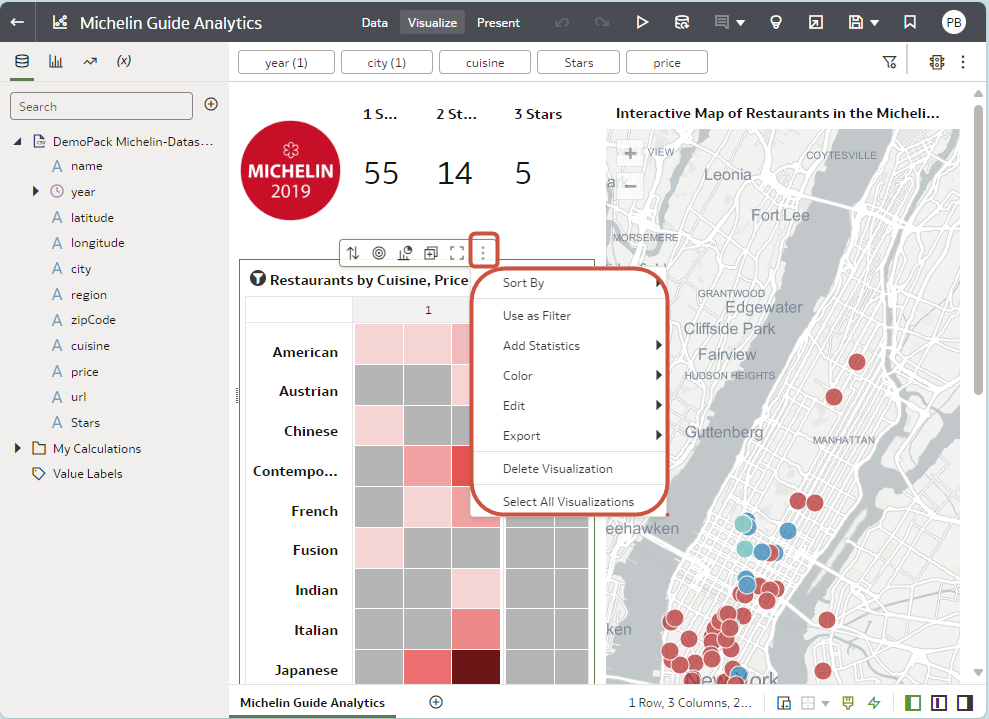
Description of the illustration viz_menu.png
Add a field to an existing visualization
Drag the item from the Data Panel over the visualization until the cursor displays a green cross, indicating a valid drop zone.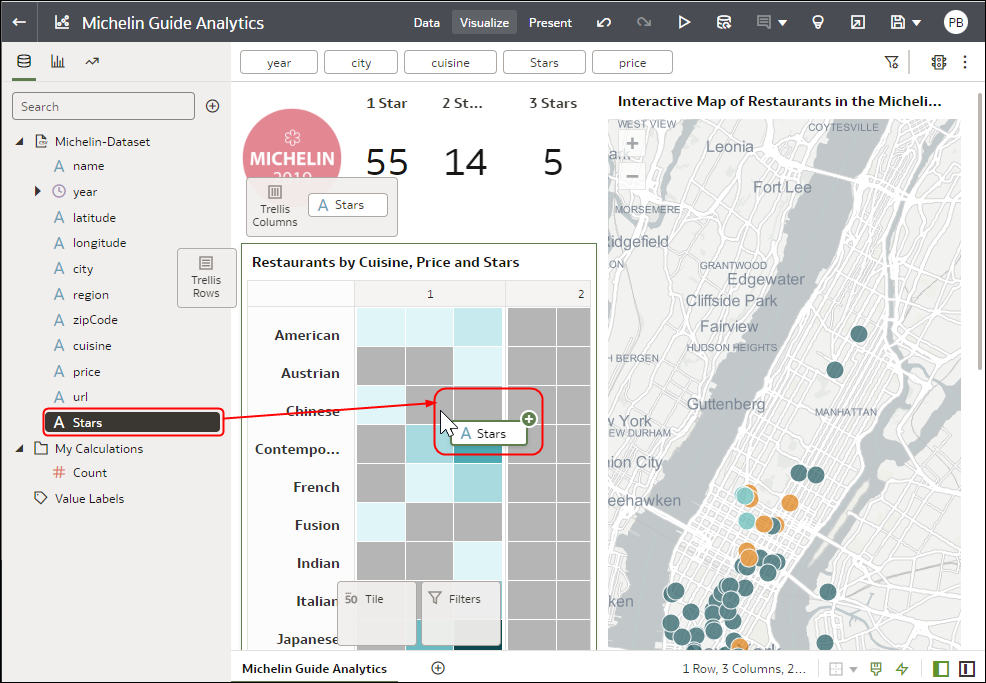
Description of the illustration viz_drag1.png
Add a field to a new visualization
Drag the item from the Data Panel over the visualization until the cursor displays a green bar, indicating a valid drop zone.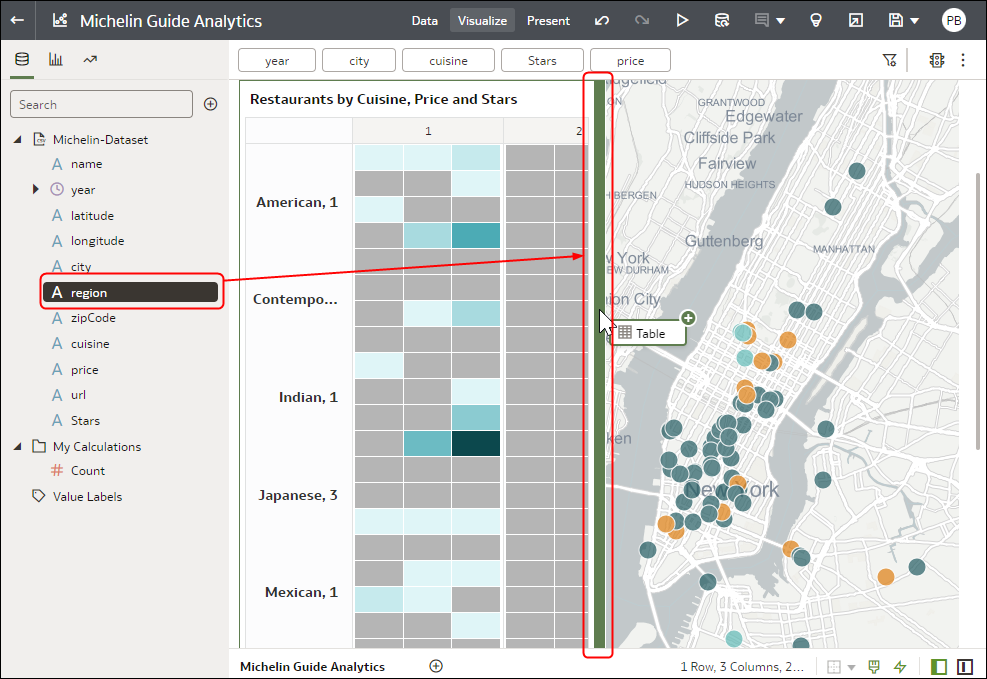
Description of the illustration guid-a1728b5c-6804-4e31-bbc7-f6ac9ccff685.png
Delete a field from a visualization
Display the Grammar Panel, hover over the field, and click X.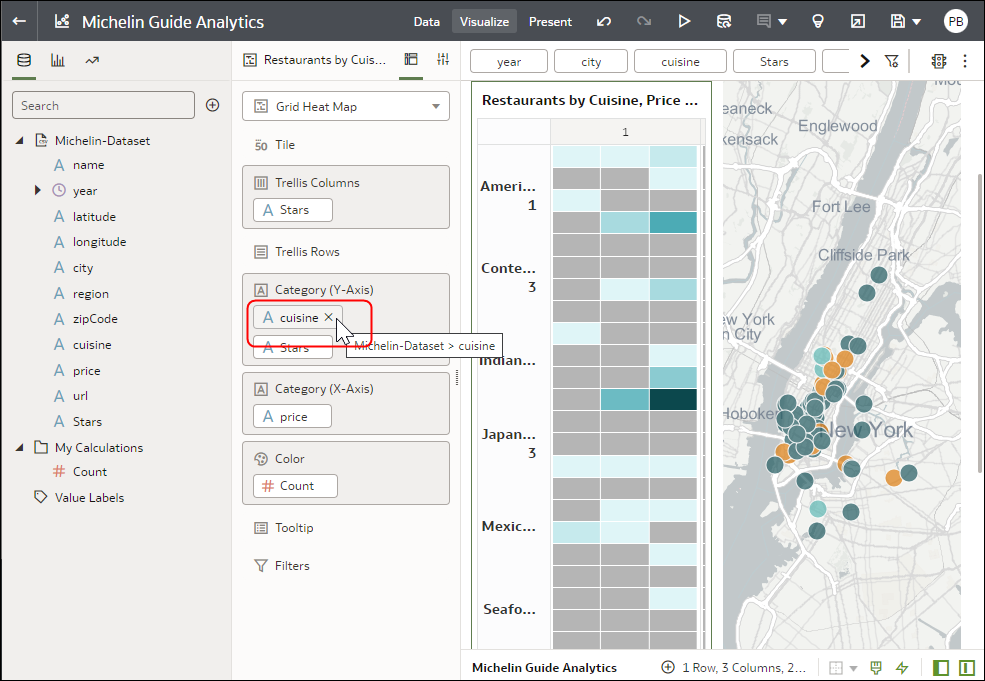
Description of the illustration viz_field_del.png